Article Text

Abstract
Objectives To examine the associations between socioeconomic position (SEP) and multidomain self-reported and objectively-assessed sedentary time (ST).
Design Cross-sectional.
Setting General population households in England.
Participants 2289 adults aged 16–96 years who participated in the 2008 Health Survey for England.
Outcomes Accelerometer-measured ST, and self-reported television time, non-television leisure-time sitting and occupational sitting/standing. We examined multivariable associations between household income, social class, education, area deprivation for each SEP indicator (including a 5-point composite SEP score computed by aggregating individual SEP indicators) and each ST indicator using generalised linear models.
Results Accelerometry-measured total ST and occupational sitting/standing were positively associated with SEP score and most of its constituent SEP indicators, while television time was negatively associated with SEP score and education level. Area-level deprivation was largely unrelated to ST. Those in the lowest composite SEP group spent 64 (95% CIs 52 to 76) and 72 (48 to 98), fewer minutes/day in total ST and occupational sitting/standing compared to those in the top SEP group, and an additional 48 (35–60) min/day watching television (p<0.001 for linear trend). Stratified analyses showed that these associations between composite SEP score and total ST were evident only among participants who were in employment.
Conclusions Occupational sitting seems to drive the positive association between SEP and total ST. Lower SEP is linked to higher TV viewing times.
- EPIDEMIOLOGY
- PUBLIC HEALTH
- SOCIAL MEDICINE
This is an Open Access article distributed in accordance with the Creative Commons Attribution Non Commercial (CC BY-NC 4.0) license, which permits others to distribute, remix, adapt, build upon this work non-commercially, and license their derivative works on different terms, provided the original work is properly cited and the use is non-commercial. See: http://creativecommons.org/licenses/by-nc/4.0/
Statistics from Altmetric.com
Strengths and limitations of this study
-
First study of its kind to use objective sedentary behaviour measurements.
-
Broad range of self-reported sedentary behaviour types.
-
Broad set of socioeconomic status markers including area-level deprivation.
-
This is a cross-sectional design.
-
The occupational sedentary time question and accelerometry cannot differentiate between sitting and standing.
Introduction
Recent studies show that sedentary time (ST) (defined as an energy expenditure rate below 1.5 metabolic equivalents,1 often characterised by activities involving sitting) is linked to increased all-cause2–5 and cardiovascular2 ,3 mortality risk independently of leisure-time physical activity participation. Television viewing, one of the most common ST activities, has been specifically linked to all-cause and cardiovascular mortality and type 2 diabetes.6 Objective data show that adults in England spend approximately 9–10 h a day being sedentary on average, out of which approximately 4 h/day is TV watching.7 ,8 Assuming that the average waking day lasts for 16 h, total ST accounts for some 55–65% of total waking time. For working age adults a substantial proportion of total ST takes place while at work, 56% of working English men and 50% of women report more than 5 h/day being sedentary while at work.7
Socioeconomic position (SEP) is a broad term that encompasses a range of characteristics, including occupational type and employment status, purchasing capacity and ownership, educational level and deprivation. Accordingly, there are several SEP indices each of which measures different aspects of social standing. Overall, SEP is a strong predictor of premature mortality and chronic disease occurrence including cardiovascular disease (CVD)9 and diabetes10 with individuals in lower SEP being considerably more likely to fall ill and die prematurely. Although there is no consensus on the origins of the socioeconomic gradient in health, one of the suggested pathways involves higher prevalence of poor health behaviours (eg, physical inactivity and smoking) among lower socioeconomic groups.11
We have previously shown that lower SEP is linked consistently with increased TV viewing and other recreational screen time in Scottish adults,12 a finding that has been confirmed by studies in other countries such as Belgium,13 Australia14 ,15 and the USA16 that used TV as a proxy for ST. However, these findings are not necessarily generalisable to overall sedentary or sitting time because TV viewing is a complex exposure that seems to be a poor index of overall ST.17 In a recent US study comparing associations between TV time and objectively measured ST, associations were of fair magnitude, but were not consistent across population subgroups.18 The results of the few studies that looked at overall (self-reported) sitting in relation to SEP are inconsistent. Higher social position was linked to higher overall sitting time among Australian women19 but education level was unrelated to sitting time among Portuguese adults.20 Objective measuring methodologies such as accelerometers and inclinometers can give more comprehensive and complete estimates of total sedentary behaviour than partial self-reported indices such as TV viewing, or self-reported total sitting time, which may be more difficult to recall than TV viewing and therefore be subject to more measurement error. Besides, SEP characteristics that relate to occupational class and income will naturally have an impact on work time sitting. For example, manual unskilled workers normally spend less time sitting during work than professionals in managerial office-based jobs.21 Similarly, higher incomes and the associated spending capacity might impact on the time spent sitting driving a car or commuting. To the best of our knowledge, no study has looked at the associations between SEP defined using education, occupational class, income and area deprivation indices, and SB estimated using self-reported sitting across different domains as well as objective methods.
The aim of this study was to look at the associations between multiple SEP indicators and self-reported indices of sitting time and SB as well as objectively-assessed total SB time. We used data from one of the largest European accelerometry general population studies, the 2008 Health Survey for England.
Methods
Study sample
The Health Survey for England (HSE) is a repeated nationally representative study of individuals living in private households in England. We drew our sample from the 2008 HSE which had a special focus on physical activity and sedentary behaviour. The sample is drawn using multistage stratified probability sampling with postcode sectors as the primary sampling unit. More details of the sample design are available elsewhere.8 The overall interview household response rate for the main sample of 15 102 adults was 64%, and for the accelerometer subsample of 4507 adults was 73%.8 In this analysis, we included adults aged 16 and above (age range 16–96 years) who had valid accelerometry and self-reported SB data. Participants provided written informed consent. An abridged methods section is presented here: the full methods section with more information can be found in online supplementary file S1 (Unabridged Methods).
Demographics and contextual variables
Trained fieldworkers assessed participants’ demographics, self-rated health, long standing illness, alcohol consumption and smoking using Computer Assisted Personal Interviewing.
Height was measured using a standard stadiometer with a sliding head plate, a base plate and three connecting rods marked with a metric measuring scale. Participants were asked to remove their shoes. One measurement was taken, with the participant stretching to the maximum height. Weight was measured using Tanita electronic scales with a digital display (Tanita Corporation, Japan). Participants were asked to remove their shoes and any bulky clothing and a single measurement was recorded to the nearest 100 g.7 Body mass index (BMI) was computed as weight (kilograms) divided by squared height (metres).
SEP measures
Social class (of the household reference person) was determined by asking questions on participants’ occupation and using the Registrar General's classification to group them as I&II (professional and managerial/technical), III non-manual, III manual, IV&V (semiskilled manual and unskilled manual). Equivalised household income was grouped into quintiles. Highest education qualification was coded as no qualification and three levels: level 1 represents secondary school or below (National Vocational Qualification (NVQ) 1/Certificate of Secondary Education (CSE) and NVQ2/General Certificate of Education (GCE) O level equivalent); level 2 represents postcompulsory secondary school (NVQ3/GCE A level equivalent) and level 3 represents higher education (higher education below degree and NVQ4/NVQ5/degree or higher). Area deprivation was assessed using the 2004 Index of Multiple Deprivation (IMD), a continuous score that we grouped into quintiles (1 representing the most deprived quintile, and 5 representing the least deprived).
ST and physical activity measures
A random subsample of HSE 2008 participants were selected to wear a uniaxial accelerometer (Actigraph model GT1M, Pensacola, Florida) during waking hours for seven consecutive days. Consistent with previous epidemiological SB studies,22 the sampling epoch was 1 min and non-wear time was defined as periods of at least 60 consecutive minutes of zero minutely counts, with allowance for up to 2 consecutive minutes of 1–100 counts/min. For a day to be ‘valid’ for inclusion in the analyses, participants had to have worn the accelerometer for a minimum of 600 min. Participants with at least 1 day of valid wear were included in these analyses.22
Self-reported ST was assessed using a set of questions on the usual week/weekend day in the past 4 weeks prior to the interview time spent on: (1) TV (including DVDs and videos) viewing; and (2) any other sitting during non-work times, including reading and computer use. For those participants who were economically active another set of questions assessed the average daily times spent sitting or standing while at work.17 While it is not ideal to include standing as a measure of ST, it is often necessitated by the unavailability of sitting-specific data, and standing is routinely included in objectively measured sedentary data as accelerometers are unable to differentiate between time spent sitting or standing. Like previously17 for the purposes of this study standing will be considered a measure of sedentary behaviour.
Physical activity questions included frequency (number of days in the past 4 weeks) and duration (min/day) of participation in walking for any purpose, domestic physical activity,12 ,23 and any recreational sports and exercise including cycling for any purpose.24 Both the physical activity and the ST questions have been validated against accelerometry.25
Data handling
Regrouping the SEP variables
Owing to small numbers of observations, the top and bottom two categories of social class were collapsed, resulting in four categories: unskilled/semiskilled manual; skilled manual; skilled non-manual; and managerial/technical/professional. Using existing methods,12 we derived a composite SEP score using household income, individual education and occupational social class of the head of household. The lowest category of each component variable was assigned a SEP score of 0, with the highest category given a SEP score of 4. The scores for each individual SEP indicator were then aggregated, resulting in a SEP score ranging from 0 to 12. Owing to small numbers of observations in the high end of the score, the top SEP score was collapsed into five categories of comparable sample size: SEP1 consisted of the lowest two SEP categories (0 and 1), SEP2 comprised categories 2 and 3, SEP3 comprised categories 4 and 5, SEP4 comprised categories 6 and 7 and SEP5 comprised of categories 8 and 9 (the highest observed SEP category).
Deriving ST and physical activity variables
Weekday and weekend day-specific TV and non-TV leisure time sitting were converted to all-week time (minutes) using the following formula: (weekday time×5)+(weekend day time×2)/7. Occupational sitting/standing time (minutes) per day was calculated by multiplying the number of days worked per week by the average time spent sitting/standing at work on a work day, and dividing by 7. Weekly self-reported moderate to vigorous physical activity (MVPA) hours/week were calculated as number of days of participation multiplied by time per day in each activity type7 ,8 Owing to the large number of participants and the very skewed distribution, self-reported MVPA was categorised into none, less than 30 min, 30 min–1 h, 1–2 h, and more than 2 h of MVPA per day. For the accelerometry data we used 0–99 counts/min to denote sedentary (<1.5 MET)3 and ≥2020 counts/min to denote MVPA (>3 MET).26 Accelerometry-measured variables were converted to time (minutes) per valid day and daily ST time was calculated as the sum of the average ST minutes per valid day divided by the number of valid days.
Missing data and multiple imputation
Outliers outside 3 SDs of the mean for all continuous variables apart from age were removed from the analyses to improve normality. This excluded 1.3–2.2% of cases from each continuous variable. Owing to a substantial proportion of cases with at least one missing value in at least one covariable or exposure variable (22–28% depending on the exposure variable) we performed multiple imputation. IBM SPSS V.20 was used to conduct the multiple imputation, missing values were imputed for all covariables and exposures, with observed maximum and minimum values used as constraints. Outcome variables did not have missing values imputed, but were included in the imputation models to predict missing values in other variables. Linear regression was used as the type of imputation, and five cycles of imputation were conducted resulting in five imputed data sets. Results from these five data sets were combined using the multiple imputation module in SPSS to provide pooled results. The imputed sample size is limited to the number of valid observations for each outcome variable (2289 for accelerometry-measured ST, 2279 for TV time, 2253 for non-TV sitting time and 1170 for occupational sitting time). Non-imputed results are presented in the appendix.
Statistical analysis
Analyses were weighted for non-response to give a sample that was representative of adults living in England. The associations between each of the socioeconomic indicators (household income, social class, education, SEP score and area deprivation,) and each individual ST indicator (TV time, non-TV sitting tine, occupational sitting/standing and accelerometry-measured ST) were examined using generalised linear models (GLM), and by multiple linear regression to determine linear trend p values. Results are presented for the whole week, the weekday/weekend day-specific results can be found in the online appendix. We also repeated the SEP score analyses stratified by economic activity (employed/self-employed vs non-economically active). SPSS V.21 was used for all analyses. For all multivariate analyses we used the complex samples GLM procedure to take into account the complex survey design. Different models were adjusted for: (1) age and sex; (2) additionally for BMI, limiting long standing illness, difficulty with usual activities, car ownership, drinking frequency, smoking status, and other socioeconomic indicators (household income, social class, area deprivation); (3) additionally for time spent in self-reported MVPA or accelerometry-measured MVPA as appropriate, and average accelerometer wear time on valid days. Models 2 and 3 with accelerometry-measured ST as the outcome were also adjusted for average accelerometer wear time on each valid day. This work conforms with the STROBE statement for observational studies.27
Results
Descriptives
A total of 2289 adults (1030 males) provided valid accelerometry data, with 2279 (1020 males) and 2253 (1014 males) also providing self-reported TV and non-TV time, respectively, 1170 (576 males) provided occupational sitting/standing time. Table 1 presents the sample characteristics of the accelerometry sample by SEP score group (prior to MI) with casewise deletion of missing values (N=1651). In total 628 participants in the accelerometry sample had at least one covariate imputed. The variables with the most imputed values were household income (361 imputed) and BMI (233 imputed). Participants from lower SEP groups were more likely to be female, older, have a higher BMI, spend less time sedentary overall and sitting at work, but spend more time watching TV than individuals in higher SEP groups. Lower SEP individuals were also more likely to report a limiting longstanding illness and difficulties with usual daily activities, and be a current cigarette smoker, but less likely to be a heavy drinker and meet physical activity guidelines. The mean wear time on valid days was 831 min. The mean number of valid days (for those with at least 1 valid day) was 6 days.
Sample characteristics by socioeconomic position score
Composite SEP and ST
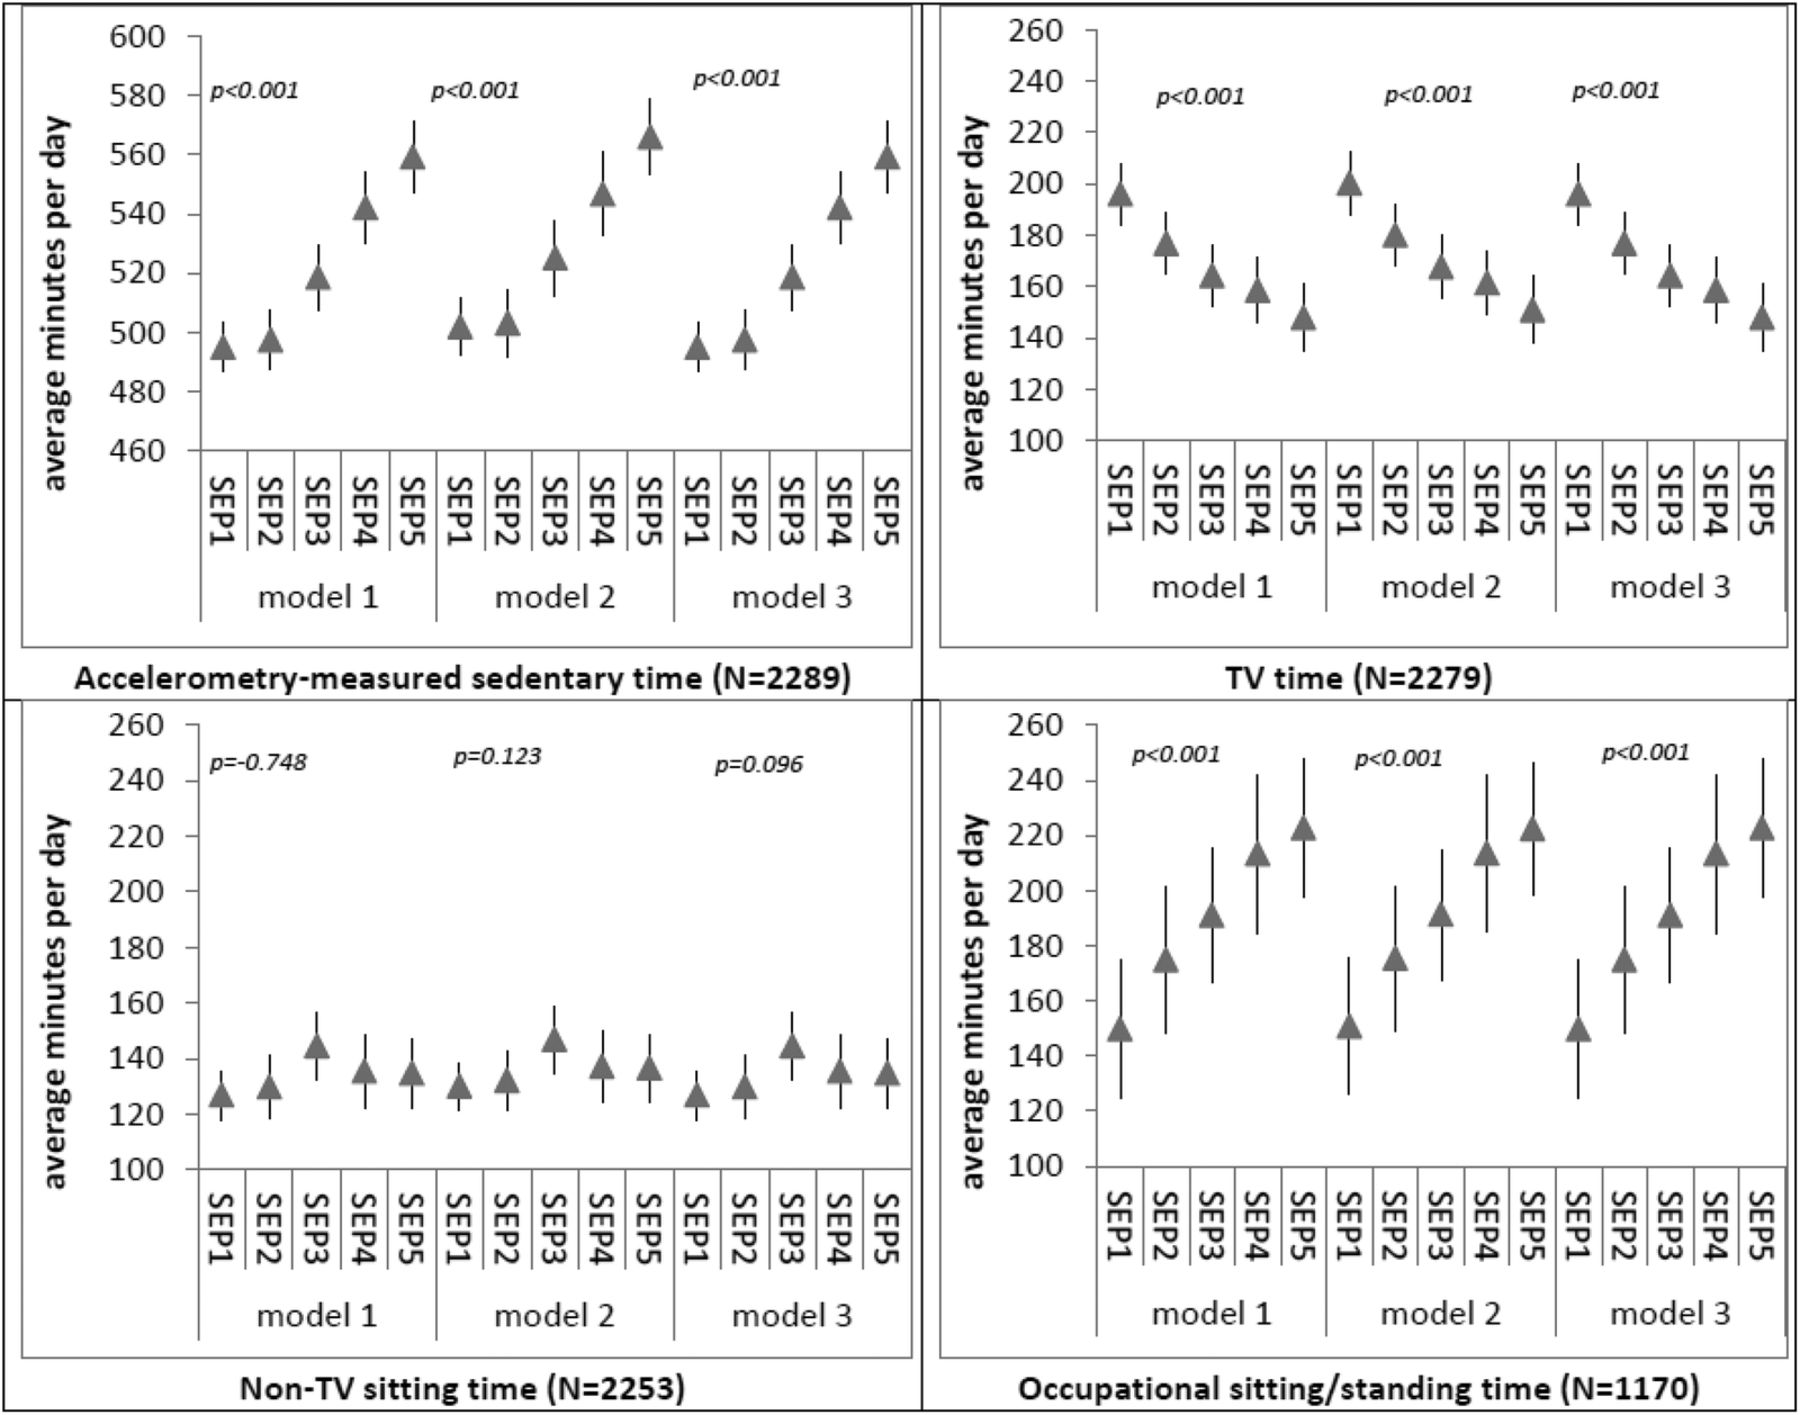
Figure 1 presents the GLM estimated marginal means and their 95% CIs describing the associations between composite SEP score and each measure of ST. SEP was positively associated with accelerometry-measured ST and occupational sitting/standing time, and inversely associated with TV time in all models. There were no associations between SEP and non-TV sitting time. Adjustments for potential confounders made no material difference to all above associations. Figure 2 presents associations between SEP score and accelerometry-measured ST, stratified by employment status. SEP score was positively associated with accelerometry-measured ST for those in employment only. SEP was inversely associated with TV time regardless of employment status, while non-TV leisure-time sitting was positively associated with SEP (SEP1 coefficient 134, 95% CI 125 to 145; SEP5 coefficient 177, 155 to 198), but only for those not in employment. However this association was not linear (data not shown).

Multivariate-adjusted average daily sedentary time by socioeconomic position (SEP) score. Model 1: adjusted for age and sex; model 2: further adjustments for area deprivation, body mass index (BMI), limiting long standing illness, difficulty with usual activities, car ownership, drinking frequency and smoking status; model 3: further adjustments for self-reported time spent in moderate to vigorous physical activity (MVPA), accelerometry-measured MVPA time and average accelerometer wear time on valid days. Models with accelerometer sedentary time as the outcome were also adjusted for average accelerometer wear time on valid days. (A) Coefficients represent estimated marginal means from generalised linear models, with 95% CIs. Linear trend p values were obtained from linear regression. (B) SEP1 indicates most deprived, SEP5 indicates least deprived. (C) Any paid work in the past 4 weeks.

Multivariate-adjusted accelerometer-measured sedentary time by socioeconomic position (SEP) score for individuals stratified by employment status. Model 1: adjusted for age and sex; model 2: further adjustments for area deprivation, body mass index (BMI), limiting long standing illness, difficulty with usual activities, car ownership, drinking frequency and smoking status; model 3: further adjustments for self-reported time spent in moderate to vigorous physical activity (MVPA), accelerometry-measured MVPA time, and average accelerometer wear time on valid days. Models with accelerometer sedentary time as the outcome were also adjusted for average accelerometer wear time on valid days. (A) Coefficients represent estimated marginal means from generalised linear models, with 95% CIs. Linear trend p values were obtained from linear regression. (B) SEP1 indicates most deprived, SEP5 indicates least deprived. (C) Any paid work in the last 4 weeks.
Equivalised household income and ST
Figure 3 presents associations between household income and each measure of ST. Household income was positively associated with accelerometer-measured ST and occupational sitting time and these associations persisted following adjustments for MVPA and other confounders. Like with SEP score, household income was inversely associated with TV time, although this association was attenuated to the null following adjustments for potential confounders in models 2 and 3. Household income was not associated with non-TV sitting time.

Multivariate-adjusted average daily sedentary time by household income quartile. Model 1: adjusted for age and sex; model 2: further adjustments for area deprivation, body mass index (BMI), limiting long standing illness, difficulty with usual activities, car ownership, drinking frequency and smoking status; model 3: further adjustments for self-reported time spent in moderate to vigorous physical activity (MVPA), accelerometry-measured MVPA time, and average accelerometer wear time on valid days. Models with accelerometer sedentary time as the outcome were also adjusted for average accelerometer wear time on valid days. (A) Coefficients represent estimated marginal means from generalised linear models, with 95% CIs. Linear trend p values were obtained from linear regression. (B) Q1 indicates lowest income quartile (≤£13 876), Q4 indicates the highest income quartile (≥£39 001).
Educational attainment and ST
Figure 4 presents the associations between the highest educational qualification and each measure of ST. Educational attainment was positively associated with accelerometry-measured ST and inversely associated with TV time in all models. Occupational sitting/standing time was inversely associated with education but the association did not appear to be linear (it was evident across the lowest three educational levels only) and was attenuated to the null following adjustments for potential confounders. There was a weak positive association between education and non-TV sitting time, following adjustments for potential confounders in models 2 and 3.
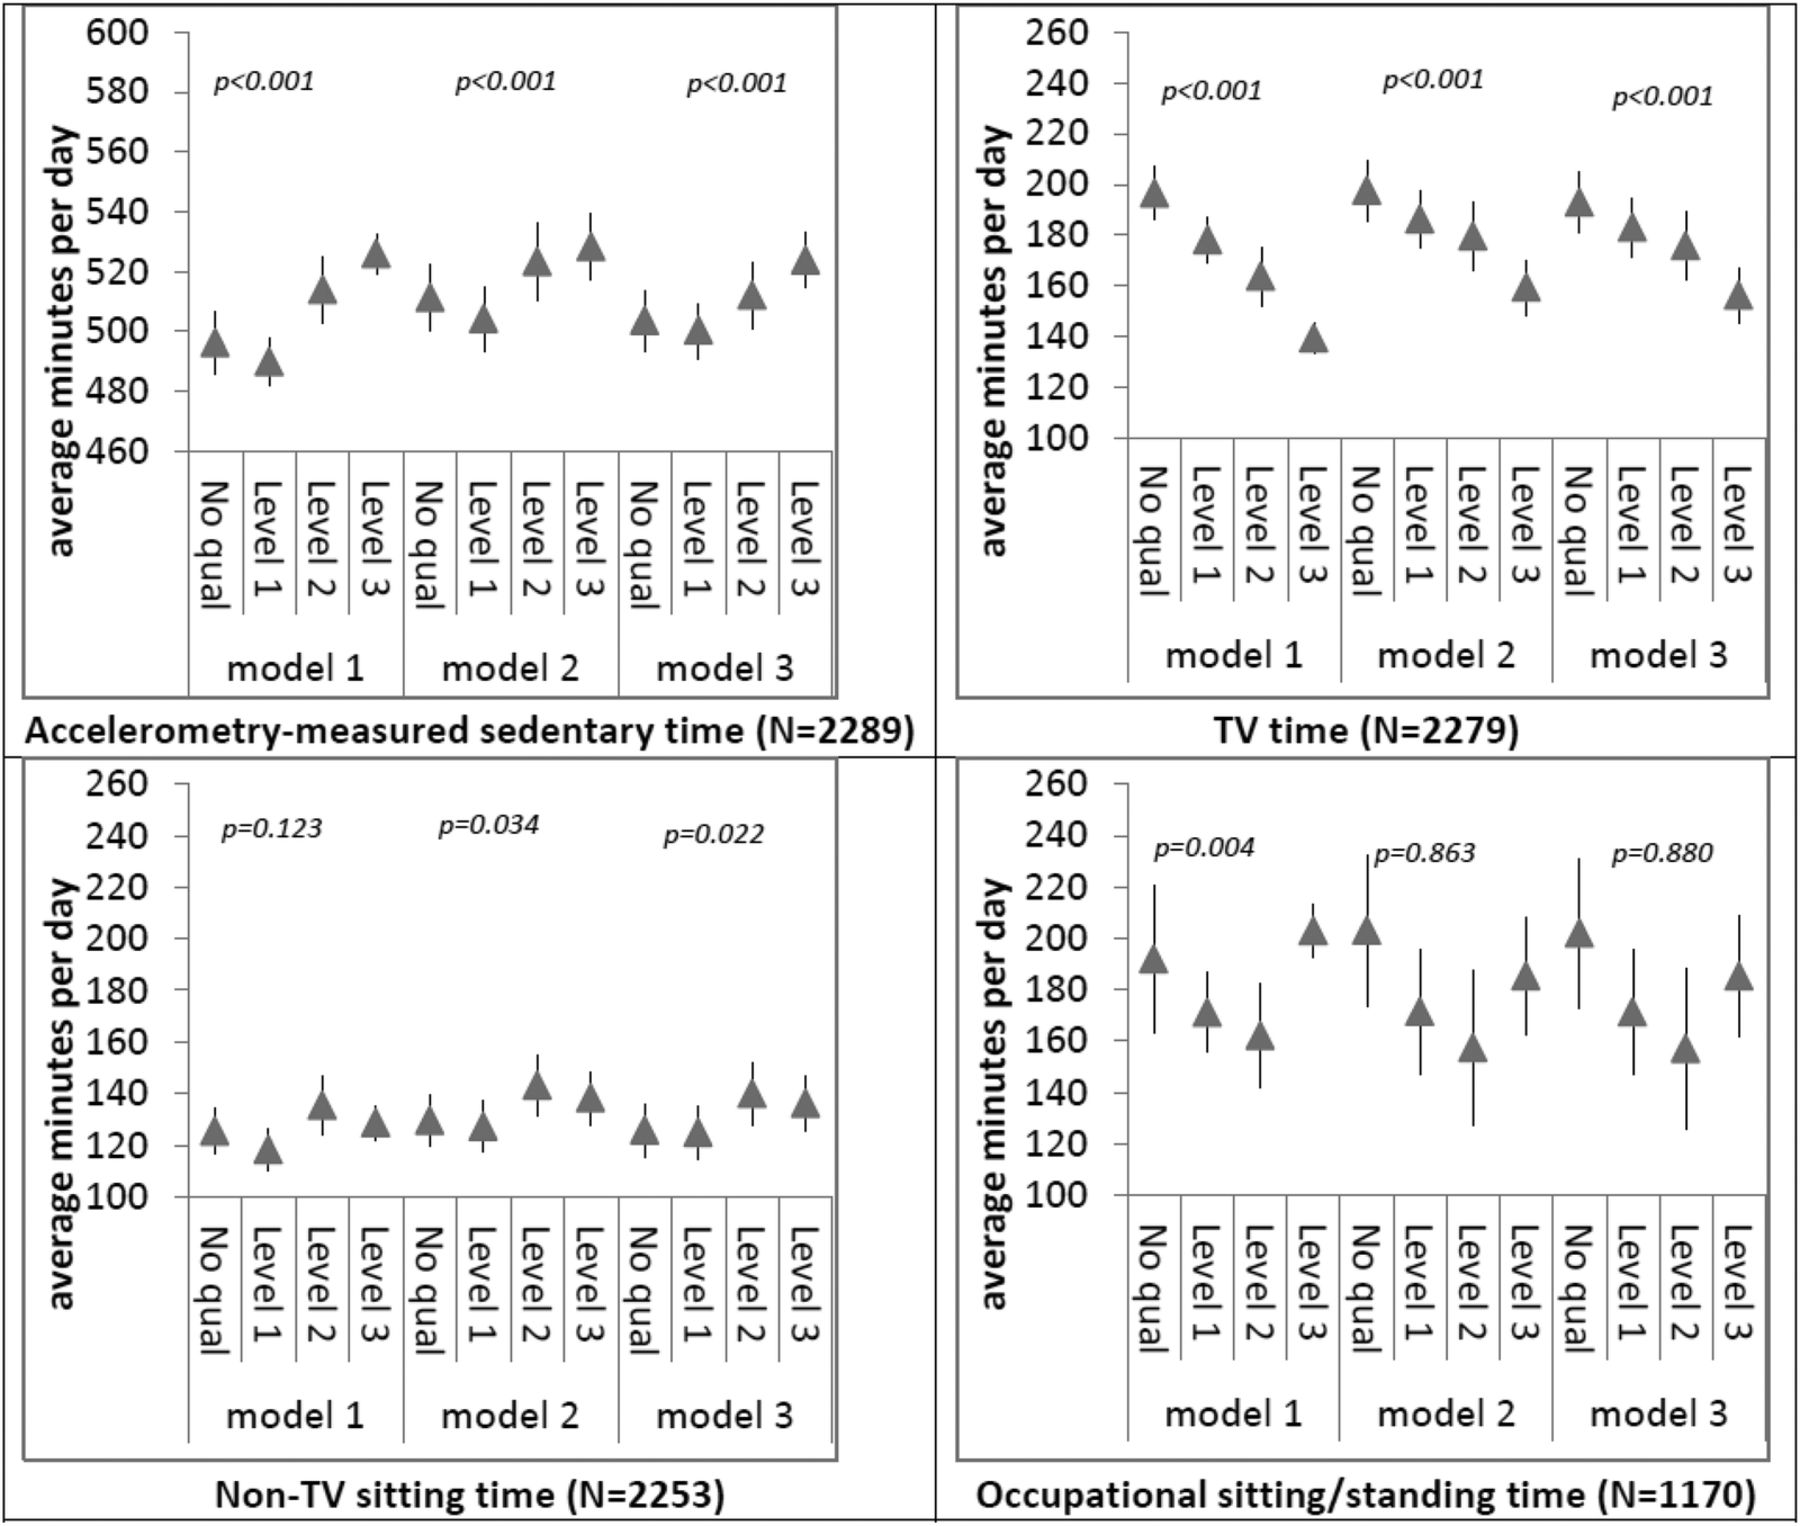
Multivariate-adjusted difference average daily sedentary time by highest qualification. Model 1: adjusted for age and sex; model 2: further adjustments for area deprivation, body mass index (BMI), limiting long standing illness, difficulty with usual activities, car ownership, drinking frequency and smoking status; model 3: further adjustments for self-reported time spent in moderate to vigorous physical activity (MVPA), accelerometry-measured MVPA time, and average accelerometer wear time on valid days. Models with accelerometer sedentary time as the outcome were also adjusted for average accelerometer wear time on valid days. (A) Coefficients represent estimated marginal means from generalised linear models, with 95% CIs. Linear trend p values were obtained from linear regression. (B) Education level 1 represents NVQ1/CSE and NVQ2 GCE O Level equivalent; Level 2 represents NVQ3/GCE A level equivalent; level 3 represents higher education below degree and NVQ4/NVQ5/degree or higher.
Occupational social class and ST
As shown in figure 5, occupational social class was positively associated with accelerometry-measured ST and occupational sitting/standing. The initial inverse association with TV time (model 1) was attenuated to the null following adjustments for potential confounders. Similarly to SEP score and income, social class was not associated with non-TV sitting time.

Multivariate-adjusted average daily sedentary time by occupational social class. Model 1: adjusted for age and sex; model 2: further adjustments for area deprivation, body mass index (BMI), limiting long standing illness, difficulty with usual activities, car ownership, drinking frequency and smoking status; model 3: further adjustments for self-reported time spent in moderate to vigorous physical activity (MVPA), accelerometry-measured MVPA time, and average accelerometer wear time on valid days. Models with accelerometer sedentary time as the outcome were also adjusted for average accelerometer wear time on valid days. (A) Coefficients represent estimated marginal means from generalised linear models, with 95% CIs. Linear trend p values were obtained from linear regression.
Area deprivation and ST
Area-level deprivation was positively associated with TV time (the lower the deprivation the lower the TV time) but these associations did not persist in the adjusted models (figure 6). Area deprivation was not associated with any other measures of ST (figure 6).

Multivariate-adjusted sedentary time by area deprivation quintile. Model 1: adjusted for age and sex; model 2: further adjustments for area deprivation, body mass index (BMI), limiting long standing illness, difficulty with usual activities, car ownership, drinking frequency, and smoking status; model 3: further adjustments for self-reported time spent in moderate to vigorous physical activity (MVPA), accelerometry-measured MVPA time, and average accelerometer wear time on valid days. Models with accelerometer sedentary time as the outcome were also adjusted for average accelerometer wear time on valid days. (A) Coefficients represent estimated marginal means from generalised linear models, with 95% CIs. Linear trend p values were obtained from linear regression. (B) Q1 indicates most deprived, Q5 indicates least deprived.
Differential associations between imputed and non-imputed data
There were no differences between the imputed and non-imputed models describing the associations between SEP score and ST indicators, although the 95% CIs were slightly broader in the unimputed models due to the lower sample size (see online supplementary figure S2).
Differential associations in weekday versus weekend days
There was no consistent pattern of differences in the associations of SEP and ST by weekend versus weekday (see online supplementary figures S3 and S4), time of the week-specific results showed broadly the same pattern as the whole week. The only notable difference was that a direct association between SEP and non-TV sitting time was observed on weekend days, but not on weekdays.
Discussion
Literature on the socioeconomic gradient of sedentary behaviour is very limited and has relied on partial sedentary behaviour indicators, mostly TV viewing. To the best of our knowledge, this study is the only one that considers four indicators of SEP in relation to four indicators of sedentary behaviour, allowing a much more in-depth examination of the associations of interest than in previous studies. Our study suggests that occupational ST is what drives the positive association between overall SEP and total ST as there was no association among those not in employment (figure 2). The difference between the lowest and highest SEP groups (figure 1) is in the region of 60–70 min/day for total accelerometry-measured ST and occupational sitting/standing time and this is comparable with the difference between the extreme SEP group among the economically active part of the sample (∼90 min/day). As low SEP is more likely to involve fixed length shift-based work one possible explanation is that these occupational ST differences reflect the longer working hours of professionals in higher SEP groups, although we had no information on work times to examine this hypothesis or make statistical adjustments. Our findings agree with an Australian study,19 which found that among women, full-time work, skilled occupations and university education were all associated with high (self-reported) total sitting time. Our study also found that the inverse association between TV time and SEP was significant regardless of employment status. In a study of Dutch workers, sitting time at work varied considerably by type of occupation but not sitting during leisure time.28
Previous studies of adults in Belgium13 and Australia14 ,15 ,29 have reported inverse associations between SEP indicators and TV time. We observed the same TV time pattern with SEP score and education but not with occupational class, household income or area deprivation. Although the occupational class and household income data were suggestive of a weak association with TV time, our current results somehow contradict our study in Scottish adults,12 where all SEP indicators (occupational class, household income or area deprivation) as well as the composite SEP score were associated with recreational screen time (including TV time). Explanations for this might be that the Scottish study was three times larger in size (which might have made it easier for data patterns to emerge) and the inclusion of non-TV screen time as an outcome, although studies from other countries suggest no clear pattern between non-TV recreational screen time (eg, computer use) and SEP.15 ,30 Nevertheless, our English and the Scottish studies demonstrate that when education, occupational social class and income are combined into a single measure (SEP score) they are a much more powerful predictor of ST than any single indicator, perhaps because they collectively capture actual SEP more thoroughly than any single indicator. Composite SEP score showed a clear and consistent pattern with all ST outcomes, although each of the individual/household-level SEP indicators seemed to influence each ST outcome in various ways, suggesting there are complex, interacting, multidimensional influences of SEP on ST. Accelerometry-measured ST was the only sedentary behaviour variable that showed clear and consistent (positive) associations with all SEP variables (except from area-level deprivation). Although the cross-sectional design of this study precludes causal inferences, the pattern of the accelerometry-based associations we observed suggests that it is unlikely that total sedentary behaviour contributes to the well-documented socioeconomic inequalities in health.11
Strengths of our study include the availability of objectively-measured and self-reported indicators of sedentary behaviour which allowed us to be more thorough and detailed when examining the associations of interest. Accelerometers can capture total ST more comprehensively than any partial self-reported indicator and as such are able to better quantify the socioeconomic gradient of ST as a contributor to health inequalities, however, a limitation is that accelerometers do not distinguish between sitting and standing which have different health implications, this also applies to occupational sitting/standing time. It has been argued that standing should not be considered a sedentary behaviour.31 This limitation is also pertinent to the self-reported ST assessment as standing time was included in the occupational ST question. The lack of information on work times did not allow us to examine the possibility that ST differences between SEP groups are partly due to longer work hours in higher SEP groups. Taken together, these limitations of the measurements may, to some extent, have confounded the associations of SEP with total and occupational ST we reported. Another limitation is that our study was limited to the accelerometry sample of HSE 2008 and this might have led to our sample being less representative of the target population. Although those in the subsample offered the accelerometer were older and more likely to be retired and to be less healthy than the rest of the adult Health Survey for England sample, those who refused to wear an accelerometer were similar in terms of employment status and area-level deprivation compared to those who wore the accelerometers for at least 4 days a week.32 Higher SEP is linked to higher commuting by car33 and this may partly explain the socioeconomic gradient but our data are limited in that there was no specific question on commuting-related sitting to examine this explanation.
Conclusions
Objectively-measured total ST and occupational ST are higher among economically active English adults in higher socioeconomic groups compared to less privileged groups. However, TV viewing is lower in higher socioeconomic groups regardless of economic activity. Combining different socioeconomic indicators appears to have composite power as a predictor of ST.
References
Supplementary materials
Supplementary Data
This web only file has been produced by the BMJ Publishing Group from an electronic file supplied by the author(s) and has not been edited for content.
Files in this Data Supplement:
- Data supplement 1 - Online supplement
- Data supplement 2 - Online figures
Footnotes
-
Contributors ES conceived the idea, prepared the data set, drafted most of the manuscript and revised the manuscript several times. NC did the statistical analysis under the supervision of ES and prepared the tables, figures and supplemental online material. AR processed the accelerometry files. NS, MH and AR redrafted parts of the manuscript and critically evaluated the whole material. All authors approved the final version before submission.
-
Funding This work was funded by the National Institute for Health Research through a Career Development Fellowship (ES) (grant number: CDF-2010-03-30). NC is also funded by the National Institute for Health Research through the same source. The views expressed in this article are those of the authors and not the English Department of Health or the National Institute for Health Research.
-
Competing interests None.
-
Patient consent Obtained.
-
Ethics approval Ethical approval was obtained from the Oxford Research Ethics Committee (reference number 07/H0604/102).
-
Provenance and peer review Not commissioned; externally peer reviewed.
-
Data sharing statement No additional data are available.