Article Text

Abstract
Objectives To systematically identify and qualitatively review the statistical approaches used in prospective cohort studies of team sports that reported intensive longitudinal data (ILD) (>20 observations per athlete) and examined the relationship between athletic workloads and injuries. Since longitudinal research can be improved by aligning the (1) theoretical model, (2) temporal design and (3) statistical approach, we reviewed the statistical approaches used in these studies to evaluate how closely they aligned these three components.
Design Methodological review.
Methods After finding 6 systematic reviews and 1 consensus statement in our systematic search, we extracted 34 original prospective cohort studies of team sports that reported ILD (>20 observations per athlete) and examined the relationship between athletic workloads and injuries. Using Professor Linda Collins’ three-part framework of aligning the theoretical model, temporal design and statistical approach, we qualitatively assessed how well the statistical approaches aligned with the intensive longitudinal nature of the data, and with the underlying theoretical model. Finally, we discussed the implications of each statistical approach and provide recommendations for future research.
Results Statistical methods such as correlations, t-tests and simple linear/logistic regression were commonly used. However, these methods did not adequately address the (1) themes of theoretical models underlying workloads and injury, nor the (2) temporal design challenges (ILD). Although time-to-event analyses (eg, Cox proportional hazards and frailty models) and multilevel modelling are better-suited for ILD, these were used in fewer than a 10% of the studies (n=3).
Conclusions Rapidly accelerating availability of ILD is the norm in many fields of healthcare delivery and thus health research. These data present an opportunity to better address research questions, especially when appropriate statistical analyses are chosen.
- methodology
- workloads
- training load
- athletic injury
- statistics
This is an open access article distributed in accordance with the Creative Commons Attribution Non Commercial (CC BY-NC 4.0) license, which permits others to distribute, remix, adapt, build upon this work non-commercially, and license their derivative works on different terms, provided the original work is properly cited, appropriate credit is given, any changes made indicated, and the use is non-commercial. See: http://creativecommons.org/licenses/by-nc/4.0/.
Statistics from Altmetric.com
Strengths and limitations of this study
As intensive longitudinal data become increasingly common across disciplines, catalysed by technological advances, this methodological review provides researchers with several considerations when determining how to analyse these data.
Whereas systematic reviews provide a quantitative synthesis of research findings, they do not account for the statistical approaches used in the original studies. Therefore, methodological reviews like this one fill an important void in the literature to highlight key shortcomings and ways forward from a methodological and statistical perspective.
By choosing a homogenous group of papers—prospective cohort studies in team sports that collected intensive longitudinal data—we were able to focus more directly on the statistical analyses that the authors employed.
It was beyond the scope of this review to list every challenge posed by intensive longitudinal data, and we are not exhaustive in our discussion of different analyses and their capacity to handle the challenges that we did highlight.
Introduction
Intensive longitudinal data (ILD) are being collected more frequently in various research areas,1 catalysed by technological advancements that simplify data collection and analysis.2 By collecting data repeatedly on the same participants, researchers are enabled to answer more detailed research questions, particularly regarding phenomena that change or fluctuate over time. However, arriving at these answers requires researchers to overcome the challenges of analysing ILD, which include: (1) the dependencies created by repeated measures, (2) missing/unbalanced data, (3) separating between-person and within-person effects, (4) time-varying and time-invariant (stable) factors and (5) specifying the role of time/temporality.3
The field of exercise and sports medicine provides one specific example which can illustrate principles that apply to the use of ILD broadly. In the field of sports performance, technological advances mean that a plethora of physiological, psychological and physical data are conveniently available from athletes.4 5 As one example, of 48 professional football clubs that responded to a survey on player monitoring, 100% reported collecting daily global positioning system (GPS) and heart rate (HR) data.6
One research question that has gained a great deal of interest in the last decade is how athletes’ training and competition workloads relate to injury risk. Since athletes’ training and injury risk continually varies over time, many researchers have used prospective cohort studies to collect and analyse ILD to answer this question.7 There is moderate evidence from systematic reviews and an International Olympic Committee (IOC) consensus statement suggesting a positive relationship between injury rates and high training workloads, increased risk of injury with low workloads and a pronounced increase in injury risk associated with rapid workload increases.7–11 However, such systematic reviews do not consider the statistical approaches used in included studies.12 Choosing the wrong statistical analysis or poorly implementing an otherwise correct one (eg, violating statistical assumptions) can bias results and create false conclusions. Even a perfectly performed systematic review cannot compensate for poorly designed, or poorly analysed studies.13
Longitudinal data analysis is most effective when the chosen statistical approach aligns with the frequency of data collection and with the theoretical model underpinning the research question (box 1).14 Therefore, we used this lens to evaluate whether the statistical models employed in prospective cohort studies using ILD to investigate the relation between athletic workloads and injury were optimal. We had three aims: (1) to summarise researchers’ data collection, methodological, statistical and reporting practices12 15; (2) to evaluate the degree to which the adopted statistical analyses fit within Collins’ threefold alignment (box 1) and (3) to provide recommendations for future investigations in the field.
Theoretical model, temporal design, statistical model
In a landmark, highly cited paper, Professor Linda Collins described how aligning the (1) theoretical model (subject matter theory), (2) temporal design (data collection strategy/timing), and (3) statistical model (analytical strategy) is crucial when analysing longitudinal data.14 For example, if researchers (1) theorise that a given physiological variable fluctuates every hour, (2) data must be collected at least on an hourly basis. If researchers measure participants once a day, they will miss virtually all the hourly fluctuations that their theories predict. Once researchers have collected their hourly data, they should (3) select a statistical strategy that enables them to examine the relationship between these fluctuations and the outcome of interest. As Collins noted, perfect alignment of these three components may not be possible, but it provides researchers a target, and readers a lens through which longitudinal research can be evaluated.
Methods
Article selection
We systematically searched the literature (MEDLINE, CINAHL, SPORTDISCUS, PsychINFO and EMBASE) (10 December 2016) to identify systematic reviews and consensus statements that investigated the relationship between workloads and athletic injuries, with the aim of extracting all original articles included in these reviews that met our inclusion criteria. A summary of the systematic search and article selection process is described in online supplementary appendix 1 (table A1 and figure A1)), and the full systematic search is available from the authors.
Supplementary file 1
A priori, we operationally defined ‘workload’ as either external—the amount of work completed by the athlete (eg, distance run, hours completed, etc), or internal—the athlete’s response to a given external workload (eg, session rating of perceived exertion, HR-based measures, etc). We acknowledge that athlete self-reported measures often evaluate how athletes are handling training demands and may be referred to as ‘internal’ load measures, but we considered these perceptual well-being measures as a distinct step from quantifying athletes’ internal or external workloads.16 Athletic injuries have been diversely defined in the literature, so we operationally defined athletic injury as any article that reported measuring ‘injury’, regardless of their specific definition (eg, time loss, medical attention, etc).
Two authors (JW and TG) screened the titles/abstracts of the systematic reviews. Where necessary, the full texts were retrieved to determine whether they should be included. A total of six systematic reviews7–10 17 18 and one consensus statement11 were identified that included at least one article meeting the inclusion criteria.
We extracted and reviewed the full texts of all the original studies included (n=279) in these seven papers. For our analysis, we included all the original articles that met the following criteria:
Original articles were prospective cohort studies that examined the relationship between at least one measure of internal or external workload (as defined above) and athletic injury. Since theoretical models describe the recursive nature of injury risk with each training or competition exposure, workloads had to be continually monitored and include both training and match workloads for the same athletes. Although some athletes may have entered or left the group during the study period (eg, through retirement or trades to other teams), the same team/group of athletes had to be followed throughout the study period, as opposed to repeated cross-sectional snapshots of different cohorts.
Articles collected ILD. We defined ILD as >20 observations per athlete.14
Articles studied team sport athletes. We chose team sports because (1) there are high amounts of ILD collected in applied team sport settings6 and (2) the majority of workload–injury studies are in team sport athletes.7 Military populations and individual sports (eg, distance running) were excluded due to the differences in task requirements and operating environment.
Patient and public involvement
As a methodological review, there was no patient or public involvement in this current investigation.
Article coding and description
To describe the methodological, statistical and reporting approaches used in each article, two authors (JW and CA) reviewed all the included papers and extracted 50 items of information for each article. These items included publication year, journal, variable operationalisation (eg, internal vs external load measures, injury definition, etc), methodological approaches, statistical analyses implemented, reported findings and more. To ensure consistency between coders, 10 articles were randomly selected, coded independently by both reviewers and compared with assess agreement. Discrepancies were discussed by the two coders and an additional five articles were randomly selected and coded independently. The remaining articles were coded by JW and checked by CA.
Assessing how statistical models aligned with Collins’ threefold framework
To evaluate the statistical approaches used in this field, we first identified the key themes and challenges within the theoretical models and temporal design features within the workload–injury field, then developed a qualitative assessment to evaluate the statistical approaches.
Collins' component 1: the theoretical models that underpin athletic workloads and injury risk (in brief)
Briefly, we identified at least three key elements of athletic injury aetiology models. First, sports injuries are multifactorial.19–21 Aetiology models since 1994 have all explained between-athlete differences in injury risk by identifying a host of ‘internal’ (eg, athlete characteristics, psychological well-being, previous injury) and ‘external’ (eg, opponent behaviour, playing surface) risk factors. More recently, the dynamic recursive model by Meeuwisse et al 22 and the workload–injury aetiology model23 have highlighted the recurrent nature of injury risk, meaning each athlete’s injury risk (ie, within-athlete risk) also fluctuates continually as they train or compete in their sport (figure 1). Thus, a second theme is that injury risk differs between-athletes and within-athletes. Finally, more recent injury aetiology models have highlighted injury risk as a complex, dynamic system (figure 2).24 25 Complex systems, as in weather forecasting or biological systems,26 27 possess many key features, including an open-system, inherent non-linearity between variables and outcomes, recursive loops where the system output becomes the new system input, self-organisation where regular patterns (risk profiles) may emerge for given outcomes (emergent pattern) and uncertainty.24
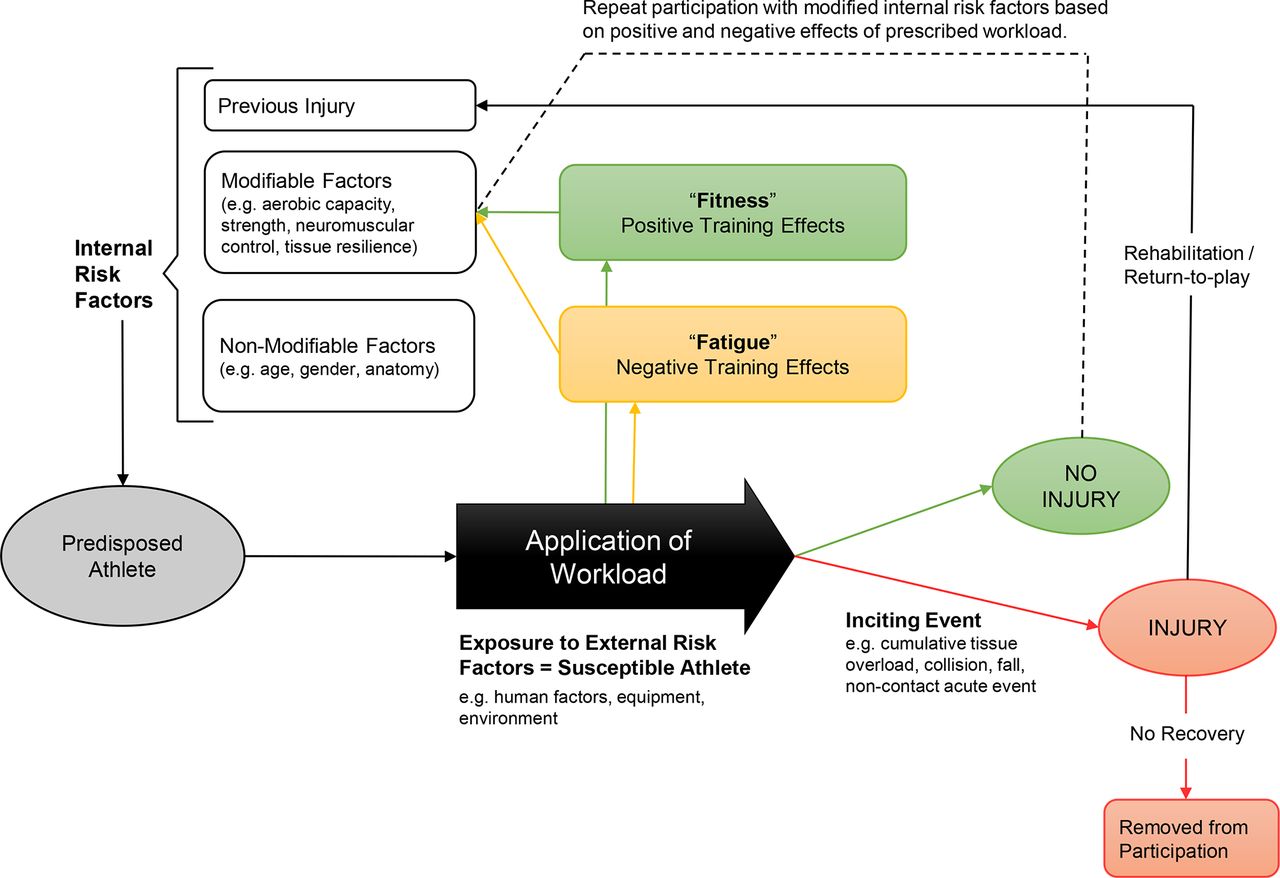
The workload–injury aetiology model. Key features include the multifactorial nature of injury, between-athlete and within-athlete differences in risk and a recursive loop.

Complex systems model of athletic injury. Web of determinants are shown for an anterior cruciate ligament (ACL) injury in basketball players (A), and in a ballet dancer (B).
Collins’ component 2: temporal design/data collection
The theoretical models relating workloads and injury illustrate a continuously fluctuating injury risk, with many variables that influence risk on a daily or weekly basis.22–24 Thus, if researchers want to investigate the association between workloads and injuries, these data must be collected frequently enough to observe changes in these variables as they occur (temporal design). With technological advances, athletes’ physiological, psychological and physical variables are now often collected on a daily, weekly or monthly basis, along with ongoing injury surveillance data.4 5 Therefore, in the workload–injury field, the theoretical models (injury aetiology models that describe regular fluctuation in workloads and injury risk) and the temporal design (frequent, often daily, data collection) are often well-aligned, especially in prospective cohort studies using ILD. This leaves us to consider only whether Professor Collins’ third component—the statistical model—aligns with these first two.
Collins’ component 3: statistical model
From the theoretical aetiology models underpinning the workload–injury association, we highlighted three key themes to consider when choosing a statistical model: (1) injury risk is multifactorial, (2) between-athlete and within-athlete differences in injury risk fluctuate regularly and (3) injury risk may be considered a complex, dynamic system.
From a temporal design perspective, ILD are necessary to address these key themes, but they also carry at least five challenges that influence the choice of the statistical model.
Differentiating between-person and within-person effects.
ILD include time-varying variables (eg, workloads) and may also incorporate stable (time-invariant) variables (eg, sex).
The ‘dependency’ created by repeated measurements of the same individuals violates the assumption of ‘independence’ common to many traditional analyses.28 29
Almost all longitudinal datasets have missing or unbalanced data.14
Longitudinal data analysis require researchers to consider the role of time in their analysis.3
Evaluating statistical approaches
We deliberately tried to align components 1 and 2 of Collins’ framework by describing the theoretical models underpinning the workload–injury association and only including articles that had a temporal design characterised by ILD. To review whether statistical approaches aligned with these two components, two authors (JW and BZ) qualitatively assessed whether the statistical models, as employed in the included studies, (1) were multifactorial, (2) differentiated between-athlete and within-athlete differences in injury risk and (3) analysed the data as a dynamic system—the three themes highlighted in the theoretical framework. From the temporal design, the same two authors evaluated whether the statistical analyses (4) included both time-varying and time-invariant variables, (5) were robust to missing/unbalanced data, (6) addressed the dependencies created by repeated measures and (7) incorporated time into the analysis.
Data synthesis approach
We first describe the characteristics of the included articles, then present our qualitative assessment of how well the various statistical approaches fit within Collins’ framework.
Results
Thirty-four articles were included in this methodological review (see online supplementary appendix 1). In the first 10 articles coded by both reviewers, there were 10 discrepancies out of 500 total coded entries (10 papers×50 items/paper), which gave us 98% agreement between reviewers. No item had more than two discrepancies. Of the 250 study criteria in the second set of 5 articles coded by both reviewers, there were 8 discrepancies (97% agreement).
Included articles were published from 2003 to 2016, with 78% of the studies published since 2010. Sports studied included rugby league (n=10), soccer (n=7), Australian football (n=6), cricket (n=5), rugby union (n=2), multiple sports (n=1) and basketball, handball and volleyball (n=1 each). Studies included an average of 96 athletes (median=46), ranging from 1230 to 502 athletes.31 The observation period for these cohort studies ranged from 14 weeks32 to 6 years.33 Most studies investigated male athletes (n=30), with two studies on female athletes and two on both sexes. Table 1 summarises the included articles’ basic characteristics, while the full data extraction table is available from the authors on request.
Summary of included workload–injury investigations, sorted by sport then publication year
Data collection
Injury definitions
Injury definitions varied across articles, with exact wording outlined in the online supplementary appendix. In table 2, we have categorised the definitions into more discrete injury categories (and subcategories) in accordance with recognised consensus statements.34 Where studies used multiple injury definitions, we categorised them according to the definition used for the primary analysis.
Broad injury definitions used in workload–injury investigations
Subsequent or recurrent injuries
Of the 34 articles, 30 did not define or include subsequent or recurrent injuries. Of those that explicitly addressed subsequent injuries, two defined these injuries as those occurring at the same time and occurring by the same mechanism.35 36 Two articles explicitly stated that they only considered time until first injury, meaning no injuries were subsequent or recurrent.37 38
Workload definitions
Workload variables varied widely across articles and are summarised in table 3. For a more detailed description of each article’s load measures, see the online supplementary appendix. Many articles used workload metrics to derive additional variables from workload distribution over time (eg, monotony, strain, acute:chronic workload ratios).
Independent variables used in workload–injury investigations
Measurement frequency
Most included articles (n=32) collected workload data at every session that athletes completed, while two studies recorded workload on a weekly basis.39 40
Handling missing data
Twenty-three of the 34 articles (67%) did not report any strategies for missing data. Of those that did, five used listwise or casewise deletion, and six used estimation. Estimation methods for players missing data included techniques such as: using the full team average values for the drills a player completed,41 using an individual’s mean weekly value42 and multiplying player’s preseason per-minute match data by the number of minutes they played in a match.43
Statistical analysis and reporting in included articles
Data binning/aggregation
Although 32 articles collected daily workload measurements, many aggregated data for analysis. Most (n=16) summed workload metrics for a total or average weekly workload. Three studies aggregated workload data for the entire year, three aggregated data into season periods, two aggregated data monthly and three used multiple aggregation strategies.
Analysis methods
Table 4 summarises the statistical practices of applied researchers investigating the relationship between workload and injury. Although some studies had analysed other primary or secondary objectives, we recorded only the analyses used to investigate the workload–injury relationship.
The number of studies using various statistical analysis techniques
Typical uses of statistical tools
Regression approaches were used most commonly (22/34 studies). The most common approach was logistic regression (binary injury status as the outcome variable), independently or jointly modelling workload variables as independent variables. Generalised estimating equations (GEEs) were used in five studies to account for the clustering of observations within players and were used very similarly to simple logistic regression approaches.
Correlation was the second most common method (10/34 studies). Most studies that used correlation (7/10) measured the association between weekly or monthly workloads and injury incidence at the team level. Of those that used correlation at the individual level, two compared the number of completed preseason sessions with the number of completed in-season sessions,23 44 while the final compared workload with injury operationalised as a numerical score on the injury subscale of the Recovery-Stress Questionnaire for Athletes.45
Relative risk approaches were generally used in one of two ways. First, workload categories were established for the entire year, like cricket bowlers who averaged <2, 2–2.99, 3–3.99, 4–4.99 or >5 days between bowling sessions up until an injury, or for the entire year if they did not sustain an injury.37 Risks were calculated as the number of injuries/number of athletes in a given group, and relative risks were calculated to compare across groups.46 In the second approach, athletes contributed exposures on a weekly basis, and thus contributed to multiple workload classifications. In this case, the likelihood/risk was the number of injuries/number of weekly player exposures to that workload category.33 41 47
Group differences were sometimes evaluated using t-tests, analysis of variance (ANOVA) or Χ2 analyses. Typically, unpaired t-tests contrasted workload variables (eg, mean sessions/week) between athletes who sustained an injury during the year, to those who did not.37 38 Paired t-tests and repeated measures ANOVAs (one-way or two-way) were most often used to contrast the workloads of the same athletes at different time periods. For example, workloads in an ‘injury block’ (like the week preceding an injury) were contrasted with non-injury blocks, like other weeks in the season,37 46 or the 4 weeks preceding the injury block.48
Justifications for statistical approaches
Authors of 15 of the included articles (44%) did not cite any sources to support their analytical choices. Of those who did, most (n=14) cited previous literature in the sports medicine field. Eight articles referenced statistics or methodology articles, four cited articles on Professor Will Hopkins’ website (www.sportssci.org) and three cited statistical textbooks.49–51
Addressing analysis assumptions and model fit
More than half (n=20) the included articles did not report on the assumptions underlying their statistical analyses. Among those that did report on analysis assumptions, checks included checks for normality, collinearity of predictor variables in regression analyses,52 sphericity for repeated measures ANOVA,45 overdispersion39 or correlation structures for GEEs.53
When authors reported checking for normality, Shapiro-Wilk44 or Kolmogorov-Smirnov tests32 were referenced. Regression modelling was the most common analysis to investigate the workload–injury association. In 8/10 instances where simple logistic regression was chosen, the authors appear to have conducted the analyses using weekly observations without accounting for the dependencies created by repeated-measures across players. In all instances were regression was used, it was uncommon for authors to report that model assumptions were checked. Where multiple regression approaches were used, multicollinearity checks were rarely reported—an important consideration since multicollinearity can cause imprecise estimates of regression coefficients when multiple workload variables are simultaneously modelled.52 54 55
Of the papers that modelled data using regression or similar techniques, six described how they assessed model fit. Some authors assessed specificity/sensitivity, or receiver operating characteristics, either on the current data set,40 or future data set.56 Other in-sample model fit indices R2 values,36 Akaike Information Criteria and Bayesian Information Criteria, which were sometimes mentioned as guiding the model selection process.57
Alignment of authors’ statistical models with theoretical model and temporal design challenges
In table 5 (see online supplementary appendix 2 (table A2)), we qualitatively evaluated whether the statistical approaches chosen by the authors in our current review effectively addressed the key themes/challenges presented by the theoretical model and the temporal design (ILD). This table is an analytical tool to guide the reader through the discussion. It highlights the themes/challenges of the theoretical model and temporal design, as well as the strengths/weaknesses of the statistical tools used in included studies. The table has the challenges/themes in columns and statistical tools in rows. The reader can follow a row to see how well a given statistical tool addressed key challenges as used by researchers in our included articles, or they can choose a challenge and follow the column down to see which analyses were used in a way that addressed that challenge adequately. The rows are ordered according to their qualitative ‘score’. As one proceeds down the rows, the statistical tools address more of the temporal design and theoretical model challenges.
Evaluation of the degree to which authors’ use of statistical tools addressed theoretical and temporal design challenges
We caution the reader that (1) not every possible statistical tool is included in the table, only those used in at least one article in our review, and (2) the evaluation is based on whether researchers of our included papers used a test in a way that addressed a given challenge, not necessarily whether the test is capable of being used in a way that meets that challenge. For example, a logistic regression analysis conducted using a GEE framework can include multiple explanatory/predictor variables, thereby allowing for a multifactorial model. However, some authors used GEEs and only included one predictor variable,58 59 in which case the GEE did not address the multifactorial theme.
Discussion
We used the workload–injury field of medical research to examine whether statistical approaches analyse ILD optimally. By design, the theoretical models underpinning the workload–injury field and the temporal design (ILD) were aligned in all the included articles, but common statistical approaches varied in how adequately they addressed the key themes needed to align them with the other two components.
Consideration 1—theoretical theme—multifactorial aetiology
Sports injury aetiology models of the last two decades have highlighted the multifactorial nature of athletic injury.19 21 We asked whether the burgeoning body of research relating workloads and injury is using modern statistical methods to capture workloads while incorporating known risk factors. Few articles in this review incorporated previously identified risk factors and workload into the same analysis. In some instances, the analytical approach prevented this from being an option. For example, simple analyses like t-tests, correlations and Χ2 tests do not allow for multiple variables to be included. In other instances, the statistical approaches allowed a multifactorial approach (eg, GEEs) but researchers opted to focus on the effects of workloads in isolation.58 59
Including known risk factors in workload–injury investigations is important from an aetiological perspective in at least two ways. First, failing to control for known risk factors may mean that key confounding variables are not included in the analysis and the relationship between workloads and injury are spurious. For example, women have a 2–6 times higher risk of ACL injury in soccer than their male counterparts.60 61 If a study included both male and female soccer players and did not account for sex in the analysis, then differences in workload may be spuriously correlated with injury rates if male and female players performed varying levels of workload. Depending on the injury type and sporting group, previous injury, age, sex, physiological and/or biomechanical variables may all be important to include.
Second, by including additional risk factors into the analysis, the investigator may be able to identify moderation or effect-measure modification to better understand how risk factors and workload jointly contribute to injury risk.62 63 As a reminder, there are subtle, but important differences between mediation, moderation and effect measure modification that will influence analytical choices.64 65 Effect modification occurs when the effect of a treatment or condition (eg, a given workload demand), differs among different athlete groups. Interaction (or moderation), although similar, examines the joint effect of two or more variables on an outcome. Finally, mediation is concerned with the pathway of exposure to a given outcome, and what are potentially intermediate variables. Previously identified risk factors may aetiologically relate to workload in each of these three ways and may be explored through different modelling strategies.
Statistical approaches that allow multivariable analyses enabled researchers to examine the effects of workloads while controlling for known risk factors. Malisoux et al 48 used a Cox proportional hazards model to control for age and sex while examining the effects of average training volume and intensity. The frailty model by Gabbett and Ullah66 incorporated previous injury—a proven injury risk factor—into the evaluation of the influence of different GPS workloads on injury risk. When investigating multifactorial phenomena, statistical approaches that enable multiple explanatory variables provide a more appropriate option.
Consideration 2—theoretical theme—between-athlete and within-athlete differences
One of the primary benefits of ILD is that it enables researchers (when using certain analyses) to differentiate within-person and between-person effects.3 In the sports medicine field, this would correspond to researchers asking (1) why do some athletes suffer few injuries (between-person inquiry) while others appear ‘injury-prone’? and on the other hand, (2) at what point is a given athlete (within-person inquiry) more likely to sustain an injury? The simpler statistical approaches used by researchers in our included studies (correlation, t-tests, ANOVAs, regular regression) are limited in the number of variables they can include, and consequently cannot differentiate risk between-athletes and within-athletes. Tests of group differences (independent sample t-tests and one-way ANOVAs) only differentiate between athletes (eg, injured vs uninjured), while repeated measures tests (repeated measures ANOVA and paired t-tests) only examine within-athlete differences (eg, loads preceding injuries vs loads during non-injury weeks).
GEEs were commonly used to address some of the longitudinal data challenges. Although this approach accounts for the clustering within-persons, it assumes the effects of predictor variables are constant across all athletes.67 Simple Cox proportional hazards models48 are common in survival analyses, but do not differentiate between-person and within-person effects.68
Only two statistical tools were used in a way that examined between-athlete and within-athlete differences in injury risk. The frailty model by Gabbett and Ullah66 modelled each athlete as a random effect with a given frailty. The multilevel model by Windt et al57 incorporated athlete-level variables (age, position, preseason sessions) and observation-level variables (weekly workload measures). In the latter case, athletes’ weekly distances did not affect their risk of injury in the subsequent week (OR 0.82 for 1 SD increase, 95% CI 0.55 to 1.21)—a within-athlete inquiry. However, controlling for weekly distance and the proportion of distance at high speeds, athletes who had completed a greater number of preseason training sessions had significantly reduced odds of injury (OR 0.83 for each 10 preseason sessions, 95% CI 0.70 to 0.99)—a between-athlete inquiry. These two examples highlight that certain analyses carry a distinct advantage of allowing researchers to tease out differences both between-study and within-study participants
Consideration 3—theoretical theme—injury risk as a complex dynamic system
Complex systems are defined, among other things, by the interaction between multiple internal and external variables that interact to produce an outcome. Simple analyses (t-tests, correlations), which cannot incorporate multiple variables, cannot examine the interaction between multiple factors. However, even other traditional analyses which are more effective in handling the challenges of longitudinal data (eg, GEEs, Cox proportional hazards models) were not used to incorporate non-linear interactions between predictor variables.
The most recent reviews of athletic injury aetiology have highlighted complex systems models.24 69 None of the analyses included in our review analysed intensive longitudinal workload–injury data with statistical analyses that fit within a complex systems framework. This lack of research may reflect the fact that the suggestion that injury aetiology fits within a dynamic, complex systems framework is still relatively ‘new’ in this field. It remains to be seen whether a complex systems approach and the analyses recommended in such reviews (eg, self-organising feature maps, classification and regression trees, agent-based models, etc) are more effective for evaluating the association between workloads and injury.24
Consideration 4—ILD challenge—including time-varying and time-invariant variables
Tying back to the theoretical model of workloads and injury, some relevant factors may be relatively stable (time-invariant) over the course of an observation period (eg, height, age), while others are time-varying (eg, workload). Some analyses can incorporate both time-varying and time-invariant variables, while others are limited in this respect. All analyses that cannot or did not address the multifactorial nature of injury cannot include time-varying and time-invariant variables concurrently. Group difference tests (t-tests, ANOVAs, etc) may collect time-varying measures, but must aggregate them into a single average for analysis.
Including time-varying and stable variables in the same analysis links closely to between-athlete and within-athlete differences—with the frailty model66 and multilevel model57 both used in a way that allowed the researchers to include both. The one exception in our included studies was the GEE approach. As mentioned earlier, the GEE assumes an ‘overall’ effect for each explanatory variable, such that between-athlete and within-athlete differences cannot be differentiated.70 However, the major benefit to a GEE is that it accounts for the repeated measures for each participant and can therefore include both time-invariant and time-varying variables for each participant.
Consideration 5—ILD challenge—handling missing and unbalanced data
Dealing with missing and unbalanced data is a near certainty when collecting ILD, and is common in applied workload-monitoring settings.71 Such missing data decrease statistical power and increases bias, and may be missing at completely at random, missing at random or missing not at random. When analysing aggregated data or using analyses that require balanced data, strategies may include complete-case analysis, last observation carried forward or various imputation methods.72 73 Multiple imputation methods, of which there are many, involves replacing missing values with values imputed from the observed data and is preferred over single imputation. Finally, if interactions are included in regression analyses, the transform-then-impute method has been recommended.74
However, these missing data approaches are not recommended for longitudinal analyses, since researchers have statistical analyses that are robust to missing and unbalanced data at their disposal.75 Statistically, four types of analyses used in this review are robust to missing and unbalanced data—Cox proportional hazards models, GEEs, multilevel models and frailty models, where all observations can be included in the analysis, and athletes can have different numbers of observations. Since mixed/multilevel models have less stringent assumptions for missing data (ie, missing at random) than GEEs (ie, missing completely at random), they have been suggested over GEEs.75
While the statistical concerns related to unbalanced data may be addressed with these analyses, missing data may also affect derived variables, which are common in workload–injury research. These derived variables include rolling workload averages (eg, 1 week, ‘acute’, workloads, 4 weeks average, ‘chronic’, workloads, etc),33 41 ‘monotony’ (average weekly workload divided by the SD of that workload) or ‘strain’ (the monotony multiplied by the average weekly workload).30 Since these measures are all calculated from workloads accumulated over time, failing to estimate workloads for these missing sessions (that end up being treated as ‘0’ workload days) means inferences from these derived measures may be underestimated and unreliable. Few authors discussed how they handled missing data. In these instances, it is important that researchers report how they accounted for missing data, whether they be strategies employed in the past, for example, full team average values,41 weekly individual averages,42 player-specific per-minute values by time played43 or whether through other advanced imputation methods recommended for ILD.72 74
Challenge 6—ILD challenge—dependencies created by repeated measures
Collecting ILD in applied sport settings means repeated (often daily) measurements of the same athlete, such that observations are clustered within athletes. Comparisons of independent groups, through Χ2 tests, independent sample t-tests and one-way/two-way ANOVAs all assume participants contribute a single observation to the analysis and force an aggregated variable (eg, average number of balls bowled in a week) to conduct the analysis.37 Similarly, correlation and simple regression (in its linear, logistic and multinomial forms) assume independence of observations.76 Paired t-tests and repeated measures ANOVA were used to deal with repeated measurements by comparing the same athletes’ workloads at different periods (eg, the week before injury vs weeks that did no precede injury).
Of the analyses that addressed this challenge, GEEs were used most commonly (six studies). GEE’s ability to handle clustering was also used in one article to control for players clustering within teams.39 Cox proportional hazard models, used in one article,48 can handle repeated measurements for participants.77 Multilevel models57 and frailty models66an extension of the Cox proportional hazards model—were also used in a single instance each, where repeated measures were clustered within players through a random player effect.
As mentioned in our introduction, there may be additional data dependency created by recurrent injuries.78 Previous recommendations to handle the recurrent injury challenges have included frailty models,79 and a multistate framework.80 However, as so few articles reported collecting information on recurrent injuries (n=5), we focused primarily on the dependencies caused by repeated measures across participants.
Challenge 7—ILD challenge—incorporating time into the analysis/temporality
One of the most relevant questions in ILD analyses is the way that time is accounted for.1 3 Some authors used one-way32 and two-way repeated measures ANOVAs81 to compare loading in different seasons or season-periods—a very simple way of accounting for time. Repeated measures ANOVAs44 48 82 and paired t-tests37 46 also account for time by categorising time-periods as preinjury blocks or non-injury blocks. Multilevel models have been used to examine change through the interactions of variables with time, but the one multilevel model used in this review did not include time as a covariate.57 Survival analyses explicitly account for time by calculating the effects of variables on the predicted time-to-event.48 66 Notably, only one analysis—the frailty model66adjusted the probability of long-term outcomes (eg, injury) based on variations after an initial capture of risk, something few traditional analyses accomplish.26
Temporality is also vital in considering potential causal associations. While making causal inferences from observational data is a topic beyond the scope of this paper, temporality is a well-accepted component of causality dating back, at least, to Bradford Hill’s ‘criteria’.83 Without temporality—where a postulated cause precedes the outcome—directional associations cannot be made.84 85 A lack of temporality can also skew associations since it allows for reverse causality. In the workload–injury field, findings that high weekly workloads are sometimes associated with lower odds of injury in a given week53 57 may be in part because players who get injured in a given week are less likely to accumulate high weekly workloads.
Trying to account for temporality, some researchers have included a latent period—where workload variables are examined for their association with injury occurrence in a given proceeding time window, like the subsequent week.33 57 While recent work has noted that the length of the latent period may affect model findings,86 it is clear that without some type of latent period, any directional inferences between workloads and injury cannot be made.
Methodological, statistical and reporting considerations
Data aggregation
Data aggregation was common, whether in data preparation, or forced through the analysis. In some cases, researchers aggregated individual level data into team-level measures (total/average workload and injury incidence). Although 32/34 articles collected daily data, most aggregated these daily data into weekly measures, potentially contributing to temporality problems if no latent period was included. Finally, certain analyses (eg, paired t-tests, simple logistic regression) aggregated data for athletes across an entire year so that workload measures were used to control for exposure.40 87 Differences in analyses make it impossible to measure the effect of fluctuations in workload and potential impact on injury risk. Furthermore, with no latent period, the directionality of the relationship is unclear. For example, players with high exposure throughout the year were at a lower injury risk than the intermediate group, but it could be interpreted that players who do not sustain an injury throughout the year are more likely to accumulate high total training and match exposures (ie, higher workload).87 Aggregated data may be easier to analyse but comes at the cost of losing some of the inherent benefits of collecting ILD, such as the changes in injury risk that occur at a daily level. As a result, theory-driven questions that relate to daily workload fluctuations and injury risk will become challenging, or impossible to answer.
Checking model assumptions and fit
While many studies may have under-reported how they assessed model assumptions or fit, others52 provide an example for other researchers to emulate. In fitting a GEE to account for intrateam and intraplayer clustering effects, they explained how they selected an appropriate autocorrelation structure, reported how potential quadratic relationships were assessed in the case of non-linear associations and described checking for potential multicollinearity with defined thresholds (variance inflation factor >10) and for their GEE.
Researcher ‘trade-offs’, consequences of misalignment
We used the workload–injury field to highlight seven themes that relate to theoretical injury aetiology models and temporal design (ILD). In many cases, highlighted published studies’ statistical models either could not, or were not used in a way that addresses these themes. In some cases, misalignment may carry a severe cost—like assumption violations that may bias study results.29 This is akin to building conclusions on an unstable foundation. Other times, researchers have properly employed their chosen statistical approach, but the approaches themselves were limited, and unable to answer research questions that ILD can address. This is more akin to having a grand building plan and all the necessary supplies, but only using a screwdriver to construct the building.
Simple regression models provide an ideal example of researchers’ trade-offs when using traditional statistical analyses on ILD, and the potential costs of misalignment. Although 13 papers used regular regression to analyse the association between workloads and injury outcome, they chose one of three paths when dealing with ILD. First, many proceeded to analyse each daily or weekly data point as an independent observation—not addressing the violation of the independence assumption.33 47 88 Second, some researchers aggregated the workload data into an average weekly workload or total workload exposure over the course of the year, such that each participant contributed only one observation to a classic logistic regression.40 87 Although the regression assumptions were not violated, workload was aggregated into a single metric, the temporal relationship between workload and injury was lost, and there was then no way to analyse the effects of workload fluctuations on injury risk. Third, some researchers converted individual data to team level data and examined team workloads with team injury incidence in a linear regression.36 89 In this final case, no differentiation could then be made between players or within-players, and inferences were only possible at the team level. This may be sufficient to inform research on the association of workloads and injury at the team level, but the theoretical model underpinning team injury rates may differ from those that underpin individual athletes’ injury risk.
Review limitations
Previous systematic reviews investigating the workload–injury relationship have documented the challenges of identifying articles through classic systematic review search strategies.7 9 Heterogeneous keywords and the breadth of sporting contexts have meant previous systematic reviews include many articles post hoc that were not originally identified by their systematic searches (eg, 29 of 67 articles in the paper by Jones et al,7 12 of 35 articles in the paper by Drew and Finch9). Therefore, although we worked to identify articles through six systematic reviews7–10 17 18 and the 2016 IOC consensus statement on athletic workloads and injury,11 we may have missed potentially eligible articles.
We used the cut-off for ILD (>20 observations) proposed by Collins.14 However, there is no universal cut-off for ILD, with previous thresholds of ‘more than a handful’,1 10 observations,90 or 40.3
In some instances, authors’ analytical choices may have been attributable to factors outside of statistical considerations. For example, in lower level competitions, or in organisations with lower budgets, it may not have been feasible to collect multiple variables longitudinally with the available equipment or staff. In these types of instances, the authors would be unable to employ a multifactorial approach, instead of choosing not to use one. Such external factors may have influenced the findings of this methodological review.
Finally, it was beyond the scope of this review to list every challenge posed by ILD, and we were not exhaustive in our discussion of different analyses and their capacity to handle the challenges. Where possible, we tried to identify the themes that are most common within the research field of sport and exercise medicine field. Ultimately, our call to action is that statistical tools be chosen more thoughtfully so that the extensive work put into theory building and data collection is not short-changed by a suboptimal statistical model.
Longitudinal improvements in ILD analysis
Methods and statistical analyses evolve over time, as with all scientific inquiry. Therefore, it is possible that we were a little unfair to some earlier papers. For example, researchers may have chosen analyses that aligned with ‘their’ theoretical model at the time, not what is considered the most current theoretical model. However, most papers were published since 2010—the dynamic, recursive aetiology model was introduced in 2007, and the multifactorial nature of injury risk has been highlighted since 1994.21 As complex systems approaches are the most recently proposed theoretical model,24 69 it is not surprising that none of the included articles analysed the data within this type of framework, with the first analysis of its kind in sport injury research only appearing recently.91 Furthermore, some techniques for longitudinal data analysis have been developed and grown in popularity recently, so researchers may not have been aware of alternative approaches at the time of their studies.
As more statistical methods are developed and refined for longitudinal data analysis, researchers will continue to gain awareness and skills with these analyses and their implementation is likely to become more common. Some evidence for that progression can be seen in this review. If we were to assign a ‘method’ score to each analytical approach outlined in table 1, assigning 0 for each red box, 0.5 for each yellow box and 1 for each green box (eg, correlation would score 0, while GEEs would score a 3.5), and then assign that score to each paper in the study, we could obtain a rough estimate of whether analytical approaches were improving over time. Breaking the papers roughly into four periods, the ‘average score’ for papers up to 2005 (n=6) is 1.6, papers between 2006 and 2010 (n=7) score an average of 1.9, papers between 2011 and 2015 (n=11) score 1.7 and papers since 2016 (n=10) score an average of 2.3. Moreover, since the search for this current review was conducted, there have been promising developments in the sports medicine field and a continued improvement in longitudinal analysis. Recent publications have applied statistical models that more appropriately take advantage of the strengths inherent to ILD, and better align with the theoretical frameworks.92–97
Mediation, effect measure modification and interaction/moderation are all causal models, which may also contribute to aetiological frameworks.98 We recently proposed that traditional intrinsic and extrinsic risk factors may act as moderators or effect measure modifiers of the workload–injury association.62 If that is true, the most appropriate statistical model would include workload measures as the independent variable of interest, and incorporate other risk factors such that these causal models can be investigated, whether by stratifying effects across different levels of these risk factors, or including an interaction term within regression.63 While no included articles performed such an analysis, recent studies (not included in this review because it was published after our search) have started to adopt these approaches.94 99 100 For example, Møller et al used a frailty model with weekly workload fluctuations (decrease or <20% increase, 20%–60% increase and >60% increase) as the primary predictor variable in a frailty model. Known shoulder risk factors were treated as ‘effect measure modifiers’, so the model was stratified based on the presence or absence of a given risk factor (eg, scapular dyskinesis).65 In so doing, the researchers used a statistical tool (component 3) that addressed all the challenges inherent to longitudinal data (component 2), conducting a multifactorial analysis that clearly differentiated both within-athlete and between-athlete injury risk—key aspects of the theoretical model (component 1).
Future directions and recommendations for ILD analysis
Researchers in the sports medicine field should be encouraged that the increased availability of ILD may improve understanding of athletes’ fluctuating injury risks—as articulated by their theoretical models. More advanced statistical techniques for longitudinal data are increasingly being developed and implemented across disciplines. This will enable sports medicine researchers to more accurately answer their theory-driven questions by taking advantage of the benefits of ILD. To capitalise on this understanding, researchers must choose statistical models that most closely align with their theory and that address longitudinal data challenges. GEEs, a Cox proportional hazards model, a multilevel logistic model, and a frailty model were the four analyses that most closely approached this alignment within our included papers. However, there remains some clear room for improvement in the future.
First, although mixed modelling was only used in one study, these forms of analyses have inherent values over GEE methods and have been recommended for this reason.101 Because of sample structure, mixed models prevent false-positive associations and have an applied correction method that increases the power of the analysis102; a finding that is useful with the commonly smaller samples. Mixed models also carry a less stringent missing data assumption (missing at random) when compared with GEEs (missing completely at random). Furthermore, whereas GEEs require the correlation structure to be chosen by the researcher (which may be wrong), mixed models model the correlation structure so that it can be investigated. Finally, GEEs assume a constant effect across all individuals in the model, while mixed models allow for individual level effects and for differentiating these individual effects.
To borrow an example from another field and demonstrate the flexibility and utility of mixed effect models, Russell et al used daily stressor values from students during their first three college years to demonstrate that students consumed more alcohol on high-stress days than low-stress days (within-person fixed effect).103 However, a significant random effect between students suggested that some students experienced this increase in alcohol consumption, while others did not. Finally, those students with a tendency to increase alcohol consumption with stressors were more likely to have drinking-related problems in their fourth year.103 For more information on multilevel/mixed effect models for longitudinal analysis, readers are referred to a other helpful resources.1 28 75 104 105
Time-to-event models are another family of statistical models that have become a very common in clinical research articles—reported in 61% of original articles in the New England Journal of Medicine in 2004–2005106but were used infrequently within our included articles. Notably, these models answer a different research question— when does an event occur? These approaches can account for many of the ILD challenges.107–109 Time-to-event models account for censoring, can incorporate time-varying exposures, time-varying effect measure modifiers and time-varying changes in injury status, and may be used to control for competing risks.107 As with other modelling techniques, the appropriate number of events per variable has been investigated, and at least 5–10 events per variable are recommended for these types of models to prevent sparse data bias.110 As long as this and other model assumptions are met, more advanced time-to-event models may be a valuable tool for researchers analysing ILD.77 111 112
Lastly, computational modelling methods, which involve computer simulation, have both pros and cons when modelling injuries. They may provide insight on the best ways to model certain predictor variables,113 and open the door to more complex systems modelling (eg, agent-based modelling).91 Although they show promise, such simulation studies are based on artificially generated data and must be interpreted carefully.114
More analytical approaches are available for ILD, but a full discussion of each of these is beyond the scope of this paper. For the interested reader, functional data analysis,115 machine learning approaches,92 95 time series analysis116 and time-varying effect models117 all show promise. Such analyses and others for ILD can be found in the landmark ILD textbook by Walls and Schafer,1 and more recently, in the work of Bolger and Laurenceau.104
We believe ILD provide an exciting opportunity for applied researchers and statisticians to collaborate moving forward. As the field continues to progress to more advanced analytical approaches that may better suit ILD, the need for collaboration with statisticians will be vital. In our included papers, few researchers referenced methodological or statistical references to justify their analytical approaches. In some instances, this may be attributable to using common, relatively simple analyses—one likely does not expect a citation for a t-test. Where such references existed, they were often to previous papers in the field, not statistical sources. In future longitudinal analyses, we encourage researchers to partner with a statistician, psychometrician, epidemiologist, biostatistician, etc.118 Such fruitful collaborations may lead to statistical approaches that take full advantage of ILD by aligning theory, data collection and statistical analyses as seamlessly as possible.
Conclusion
We used studies investigating the relationship between workloads and injury as a substrate to highlight to researchers how important it is to align their theoretical model, temporal design and statistical model. In longitudinal research, thoughtfully chosen statistical analyses are those grounded in subject matter theory and that maximise the utility of the collected data. The three most common analyses in our included papers (logistic regression, correlations and relative risk calculations) addressed one or none of the three key theoretical themes, and one or fewer of the four inherent challenges of ILD. In this example discipline, researchers have developed sophisticated theories and frequently collect data that enable them to test these theoretical models. The missing step, and future opportunity for researchers, is to avail themselves of all the tools at their disposal—choosing statistical models that address the ILD challenges and answer theory-driven research questions.
Acknowledgments
The United States Coalition for the Prevention of Illness and Injury in Sport is a partner in the United States Coalition for the Prevention of Illness and Injury in Sport, an International Research Centres for Prevention of Injury and Protection of Athlete Health supported by the International Olympic Committee (IOC). Technical or equipment support for this study was not provided by any outside companies, manufacturers or organisations.
References
- 1.↵
- 2.↵
- 3.↵
- 4.↵
- 5.↵
- 6.↵
- 7.↵
- 8.↵
- 9.↵
- 10.↵
- 11.↵
- 12.↵
- 13.↵
- 14.↵
- 15.↵
- 16.↵
- 17.↵
- 18.↵
- 19.↵
- 20.↵
- 21.↵
- 22.↵
- 23.↵
- 24.↵
- 25.↵
- 26.↵
- 27.↵
- 28.↵
- 29.↵
- 30.↵
- 31.↵
- 32.↵
- 33.↵
- 34.↵
- 35.↵
- 36.↵
- 37.↵
- 38.↵
- 39.↵
- 40.↵
- 41.↵
- 42.↵
- 43.↵
- 44.↵
- 45.↵
- 46.↵
- 47.↵
- 48.↵
- 49.↵
- 50.↵
- 51.↵
- 52.↵
- 53.↵
- 54.↵
- 55.↵
- 56.↵
- 57.↵
- 58.↵
- 59.↵
- 60.↵
- 61.↵
- 62.↵
- 63.↵
- 64.↵
- 65.↵
- 66.↵
- 67.↵
- 68.↵
- 69.↵
- 70.↵
- 71.↵
- 72.↵
- 73.↵
- 74.↵
- 75.↵
- 76.↵
- 77.↵
- 78.↵
- 79.↵
- 80.↵
- 81.↵
- 82.↵
- 83.↵
- 84.↵
- 85.↵
- 86.↵
- 87.↵
- 88.↵
- 89.↵
- 90.↵
- 91.↵
- 92.↵
- 93.↵
- 94.↵
- 95.↵
- 96.↵
- 97.↵
- 98.↵
- 99.↵
- 100.↵
- 101.↵
- 102.↵
- 103.↵
- 104.↵
- 105.↵
- 106.↵
- 107.↵
- 108.↵
- 109.↵
- 110.↵
- 111.↵
- 112.↵
- 113.↵
- 114.↵
- 115.↵
- 116.↵
- 117.↵
- 118.↵
- 119.
- 120.
- 121.
- 122.
- 123.
Footnotes
Contributors JW and TJG searched for, screened and identified appropriate systematic reviews and consensus statements. JW identified appropriate original data papers from included systematic reviews/consensus statements. JW and CLA performed quality assessment of original data papers and coded the study methods. BDZ provided the statistical feedback on the creation of the data extraction spreadsheet and advice on the approach of the methodological review. JW and BDZ completed the qualitative assessment of whether authors’ use of statistical tools aligned with theoretical or temporal design themes. BCS, CLA, BDZ and KMK provided early input during early stages of study development. CEC contributed to the original idea for the review, and contributed to the discussion section of the manuscript. JW compiled the first draft of the manuscript. CLA, CEC, BCS, BDZ and KMK all contributed to critical revision of multiple drafts of the current manuscript.
Funding JW was a Vanier Scholar funded by the Canadian Institutes of Health Research.
Competing interests None declared.
Patient consent Not required.
Provenance and peer review Not commissioned; externally peer reviewed.
Data sharing statement No additional data available.