Article Text

Abstract
Objective The purpose of this study was to determine the relationship between athletic performance and the change in body weight (BW) during a 42 km marathon in a large cohort of runners.
Methods The study took place during the 2009 Mont Saint-Michel Marathon (France). 643 marathon finishers (560 males and 83 females) were studied. The change in BW during the race was calculated from measurements of each runner's BW immediately before and after the race.
Results BW loss was 2.3±2.2% (mean±SEM) (p<0.01). BW loss was −3.1±1.9% for runners finishing the marathon in less than 3 h; −2.5±2.1% for runners finishing between 3 and 4 h; and −1.8±2.4% for runners who required more than 4 h to complete the marathon. The degree of BW loss was linearly related to 42 km race finishing time (p<0.0000001). Neither age nor gender influenced BW loss during the race.
Conclusions BW loss during the marathon was inversely related to race finishing time in 643 marathon runners and was >3% in runners completing the race in less than 3 h. These data are not compatible with laboratory-derived data suggesting that BW loss greater than 2% during exercise impairs athletic performance. They match an extensive body of evidence showing that the most successful athletes in marathon and ultra-marathon running and triathlon events are frequently those who lose substantially more than 3–4% BW during competition.
Statistics from Altmetric.com
Introduction
There is ongoing debate of the effects of even small body weight (BW) losses during exercise on athletic performance. The current 2007 American College of Sports Medicine (ACSM) Position Stand on Exercise and Fluid Replacement1 advises that athletes should drink according to the dictates of thirst (ad libitum) but should not lose more than 2% BW during exercise, since any weight loss greater than 2% impairs athletic performance.2 This represents a substantive change from the 1996 ACSM Position Stand that encouraged athletes to drink ‘as much as tolerable’ to ensure that no BW is lost during exercise.3
In contrast, the drinking guidelines of the International Marathon Medical Directors Association,4 5 adopted by US Track and Field in 2003, propose that athletes drink according to the dictates of thirst, as this will optimise performance and minimise the risk of ill health, including that posed by overdrinking.6 These guidelines presume that the regulation of the BW change during exercise is part of a whole body homeostatic response including control of serum osmolality.7 8 Since these complex homeostatic phenomena will vary between individuals, it is probable that the extent of individual BW loss during exercise will vary substantially, with some losing more than 2% BW.9
These guidelines further suppose that only athletes who drink less (or more) than their thirst dictates will suffer an impaired exercise performance independent of the precise BW loss or gain.2
The conclusion that a BW loss in excess of 2% impairs athletic performance comes from laboratory-based studies of relatively small numbers of subjects (for review see Noakes4). In contrast, the fastest finishers in athletic competitions usually lose the most weight. The early studies of Pugh et al10 and Wyndham and Strydom11 found that the race winners were those who lost the most weight and usually the highest postrace core body temperatures.10,–,13 The winner of the 1970 Commonwealth Games Marathon in near world-record time did not drink during the race, losing 3.9% BW.14 Other studies13 15,–,21 have shown either that BW losses greater than 3–4% are common in faster finishing competitors or there is a weak inverse relationship between BW loss and athletic performance so that the fastest finishers usually lose the most weight. A recent report shows that the current 42 km world record holder (2 h 3 m 59 s) lost 10% BW while establishing that record.22 If it is correct that a 10% BW loss will impair exercise performance by >50–100%,23 24 this performance would be impossible.
While there are data comparing BW changes and performance in large numbers of triathletes during competition,19 20 there appear to be no equivalent data in a large group of marathon runners.
Accordingly the goal of this study was to measure BW changes and performance in a large number of competitors in a French 42 km marathon footrace. We hypothesised that there would be a linear relationship with a negative slope between the extent of BW loss and finishing time so that the fastest finishing runners would lose the most, and the slowest finishers the least BW during the race. In addition, the fastest finishers would likely lose more than 2–3% BW. These findings would indicate that BW losses greater than 2% may not affect the performance of athletes who drink according to the dictates of their thirst. This would support the interpretation either that drinking to the dictates of thirst optimises athletic performance4 25 or that some athletes are more resistant to the development of thirst or to its potentially detrimental effects.
Materials and methods
This study was approved by the Ethics Committee of the University of Rennes 2 and by the Organizing Committee of the 2009 Mont Saint-Michel marathon.
Measurement of BW changes
All entrants in the 2009 Mont Saint-Michel marathon were invited to participate in the study. Each athlete was contacted before the race and received a detailed explanation of all aspects of the study. No mention was made of the hypothesis under evaluation or of the outcome that the researchers considered most likely (or desirable according to their particular biases).
At race registration, the ages of runners who consented to participate in the study and their best marathon performance in the last 12 months were recorded, and their heights were measured. We did not verify the self-reported age or best marathon performances of these athletes. The following morning between 90 and 60 min before the start of the race, 884 subjects were weighed on one of 12 numbered scales (BEURER BG 42, precision: ±100 g) wearing only their running clothes and without running shoes. Of this group, the 643 runners who finished the race were directed to a tent situated 20 m from the finish line; this was the sole exit from the finishing area. The athletes removed their running shoes and were reweighed by the same experimenter in the same clothing they wore before the start of the race on the same numbered scale used to measure their prerace weight.
Drinking instructions to runners
Participants in the race were advised to drink ∼250 ml every 20 min of either water or a 4–8% carbohydrate-containing drink. In addition, the race website (http://www.montsaintmichel-marathon.com) carried general advice of how athletes should conduct themselves during the race. Fluids were provided at eight refreshment stations located approximately 5 km apart.
Environmental conditions
Environmental conditions on race day were provided by the French National Weather Service.
Calculation of results
Changes in BW (kg) were calculated as the difference between the BW measured just before and just after the marathon. Percentage BW lost or gained was calculated as the difference between the initial and final BW divided by the initial BW and expressed as a percentage. Although it is often assumed that percentage BW loss and percentage dehydration are synonymous, the weight lost during exercise also includes the irreversible oxidation of fuel and the release of water as glycogen is metabolised.19 26,–,28 Accordingly, the term percentage BW loss is preferred to percentage dehydration.19 However, as a group, athletes with the greatest percentage BW loss will also likely be the most dehydrated.19
The runners were grouped into three groups according to their performance during the marathon: group 1, those finishing under 3 h; group 2, those finishing between 3 and 4 h; group 3, those finishing in more than 4 h. These divisions are arbitrary but differentiate groups of athletes with different levels of either physical ability or training commitment or both.
Statistical analysis
Data are presented as mean and the SEM (x±SEM). Data were analysed using computer-based statistical software (SIGMASTAT 3.1). Analysis of variance (one way) was used to determine differences between groups according to performance, age and gender. The Student t test for dependent variables was used to analyse differences within groups before and after the race. The limit of significance was set at p<0.05.
Results
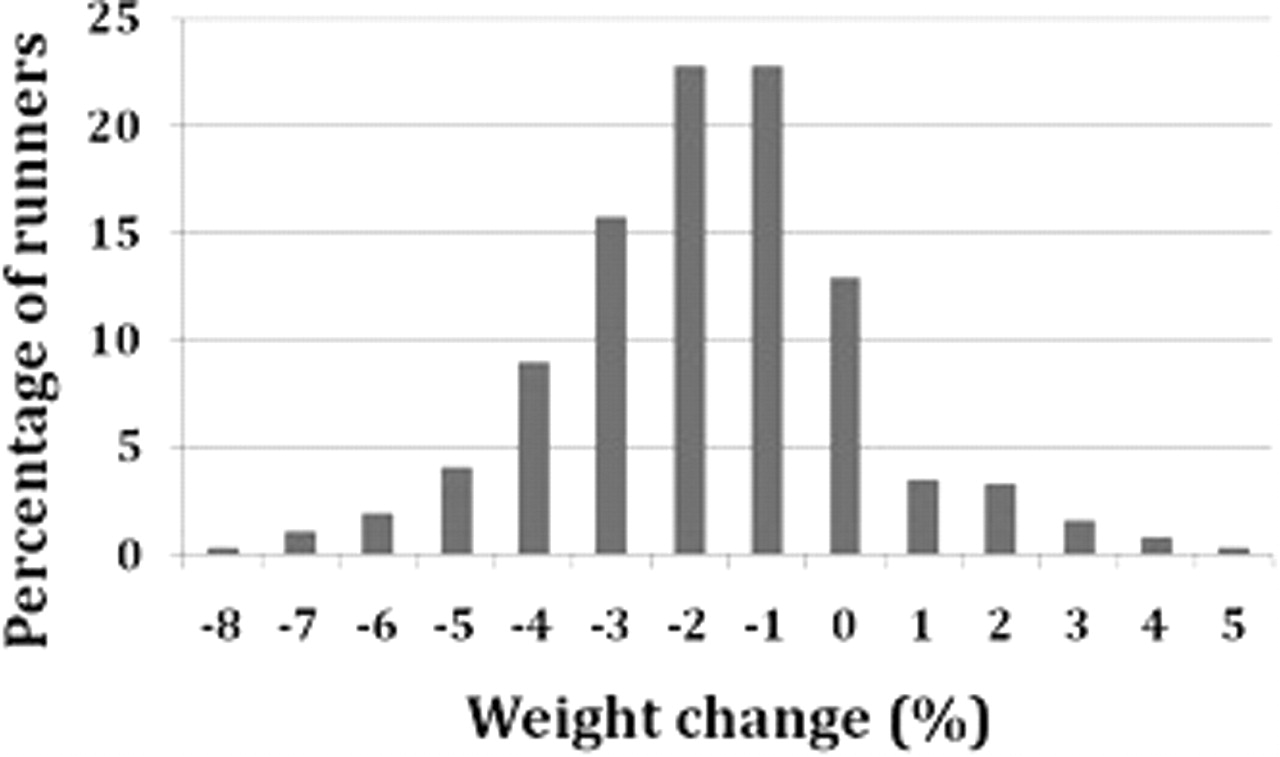
The race was run in cool conditions (9–16°C) with moderate humidity (60–82%) but with a strong wind blowing (table 1). The morphological characteristics of the 643 finishers that were studied, their best 42 km marathon performance during the last 12 months and their weight changes during the race are listed in table 2. The average age of the runners was 43 (±8.8 years), and they lost an average of 1.7 kg (2.3±2.2% BW) during the race (p<0.05). There was no difference in the degree of weight loss in men and women. Figure 1 shows that the percentage BW loss in all athletes was normally distributed, ranging from a gain of 5% to a loss of −8%.

Distribution of body weight change in 643 competitors in the 2009 Mont Saint Michel marathon.
Weather conditions at the start and finish of the 2009 Mont Saint-Michel Marathon
Descriptive data for 643 athletes competing in the 2009 Mont Saint-Michel Marathon
Table 3 lists the mean marathon finishing times according to the degree of BW change during the race. Sixty-two runners, comprising 9.5% of the total sample, gained BW during the race, whereas the remaining 581 runners lost BW (table 3). The effect of BW change during the race on marathon finishing time was graded so that those who ran the slowest lost the least BW whereas those who ran the fastest lost the most (table 3).
Marathon finishing time according to degree of weight change during the marathon
The same effect was apparent when subjects were grouped according to their marathon finishing times (table 4). Those who finished in less than 3 h lost significantly more BW than did those athletes who finished either between 3 and 4 h or slower than 4 h.
Degree of weight loss (%) according to marathon finishing times
BW changes during the marathon are listed according to gender and age in table 5. There were more men (560) than women (83) in the study, and this might have influenced the findings. The degree of BW loss was not different between men and women (562 men: −2.3±2.1%; 83 women −2.5±2.6%). There were no significant differences in either performance or extent of BW change for three age groups (<40 years; 40–50 years; >50 years) in either men or women. The degree of BW loss was not different between the best performing men and women (26 men finishing in under 3 h: –3.1±1.9%; nine women finishing in under 4 h: −2.5±1.0%).
Degree of body weight (BW) loss (%) and marathon performance in men and women of different ages
Figure 2 shows the degree of BW change plotted against the race finishing time (minutes) for the entire group of 643 marathon finishers. There was a significant linear relationship (p<0.0000001) between the degree of BW loss and race finishing time so that lesser degrees of BW loss were associated with longer finishing times. However, the predictive value of this relationship was small (r=0.2).

Degree of body weight change plotted against the race finishing time (minutes) for the entire group of 643 marathon finishers (p<0.0000001; r=0.217).
Discussion
The first important finding of this study was the wide variation in the degree of BW change experienced by runners in this event. This change was normally distributed (figure 1). The degree of BW change varied from a loss of 8% to a gain of 5% and is similar to that previously reported in 2135 competitors in eight endurance events, in which BW changes varied from a loss of 10% to a gain of 6%.9 It is surprising that some subjects in this study gained more than 5% BW in less than 6 h.
This variation occurred, even though all athletes in this race receiving identical drinking guidelines, specifically that they should attempt to drink about 250 ml/h every 20 min (750 ml/h). These are similar to current drinking guidelines.1 5 These data establish perhaps for the first time that marathon runners drink according to individual biological and behavioural influences regardless of what they are told by the race organisers.
Interestingly, 9.5% of runners in this sample overdrank and gained BW during the race. There is no benefit to overdrinking during exercise.29 Instead significant overdrinking will cause potentially fatal exercise-associated hyponatraemic encephalopathy.9 30 Since overdrinking cannot be produced by internal biological signals, the high prevalence of overdrinking must be due to behavioural conditioning. Such overdrinking was neither promoted by the information provided by the race organisers nor encouraged by the relatively few aid stations located only every 5 km. Rather, such overdrinking most likely results from specific messaging directed, especially by the sports drink industry.6 30 31 This messaging has promoted the concept that any dehydration that occurs during exercise impairs exercise performance and increases the risk for a potentially adverse outcome, including the risk that heat stroke will occur. As a consequence, athletes may continue to be believe that they must drink ‘as much as tolerable’ during exercise. However, marathon race organisers have a responsibility to warn runners about the dangers of overdrinking.
BW gain is more likely caused by the Syndrome of Inappropriate Antidiuretic Hormone (SIADH) secretion9 or perhaps related conditions that have yet to be discovered. This gain occurs most frequently in slower runners.
In contrast, 55% of subjects in the race lost more than 2% BW (figure 1). Runners with this extent of weight loss ran significantly faster than those who lost less weight (table 3). This conflicts with a core component of the most recent ACSM Position Stand1 but is consistent with other studies showing that the fastest finishers in marathon and other endurance races are often those who lose the most weight.16 18,–,21
An interesting question not previously asked is: why did 55% of athletes in this race lose more than 2% BW when sufficient fluid was available to allow 9.5% to gain weight by overdrinking? Since athletes will not wilfully ignore their thirst when fluid is available in excess, the only conclusion can be that these ‘dehydrated’ athletes were drinking according to their innate biological signals, which protect the whole body osmolality,7 8 not a BW loss of less than 2%. That these athletes were also the fastest finishers shows that the biological signals were appropriate to optimise athletic performance.2
The second important finding was the linear relationship with a negative slope between the degree of BW change during the race and the race finishing time. Furthermore, when analysed by race finishing times, successively slower groups of runners lost less BW than did the group running faster (table 4).
We are not the first to show this relationship in marathon runners. From an analysis of 24 studies of marathon runners, Cheuvront and colleagues16 showed that those marathon runners who ran the fastest also lost the most weight. Indeed, the fastest runners lost more than 8% BW. Surprisingly the authors concluded that: ‘The positive correlation … should not be wrongly interpreted as support for the ergogenic effect of dehydration (since) … dehydration by anything over 2% of BW significantly degrades endurance exercise performance especially in the heat.’ In contrast, their data actually suggest that levels of ‘dehydration’ in excess of 2% BW may be ergogenic in some athletes. Regardless, the data from our study would seem to disprove the theory that BW losses of this magnitude detrimentally impair exercise performance.2
The finding of a linear relationship with an inverse slope between weight change and performance confirms similar findings in another group of marathon runners,16 in cyclists32, in 224 km Ironman triathletes,19 20 in 160 km/24 runners18 and in runners in the 230 km Marathon of Sands.21 Other studies of athletes in competition have failed to show any effect of increasing levels of BW loss on performance in 21 km runners,13 Australian Ironman triathletes17 and military personnel.33 Thus, the possibility remains that high levels of BW loss in certain unique individuals might enhance exercise performance simply as the result of a lesser BW that needs to be transported.
There are a number of reasons why some laboratory studies may show an opposite effect.
In the first place, the motivation of the tested subjects in laboratory studies is quite different since only in competition is the athlete likely to produce a truly maximal effort. Second, competitive athletes may differ in important ways, both physiologically and psychologically, from subjects in laboratory trials, most of whom comprise a ‘convenience’ sample to whom the researchers have the easiest access. Subjects are not usually selected for either their known athletic abilities or their capacities to produce truly maximal efforts under laboratory conditions. Third, laboratory studies may not use self-paced activities that are the norm in athletic competition. Laboratory studies are also usually of relatively short duration compared with ultra-endurance events that can last for 10–24 h or even longer. Fourth, subject numbers for laboratory studies are typically small, whereas hundreds or thousands of athletes can be studied during competitive sporting events. Fifth, laboratory studies do not always evaluate weight-bearing activities.34 Yet some degree of weight loss could theoretically aid performance in weight-bearing activities that last many hours.
Finally, subjects in laboratory trials may understand the hypothesis being tested, and this could subconsciously influence their performances, a variant of the placebo effect.35 Indeed, the relevant beliefs of subjects participating in such trials are not usually reported. In contrast, the less intimate interaction between researchers and subjects participating in trials involving large numbers of athletes reduces the probability that extraneous factors including the beliefs of the researchers conducting the trial will influence the outcome of the studies.
What is already known on this topic
▶ Laboratory studies suggest that levels of body weight (BW) loss in excess of 2% impair exercise performance.
▶ In contrast, studies of athletes in competition find that the fastest finishers lose the most BW.
▶ A BW loss of 10% was recently measured in the athlete who established the current world record in the 42 km standard marathon.
What this study adds
▶ The degree of BW loss in 643 forty-two-kilometre marathon runners was normally distributed ranging from a BW loss of −8% to a BW gain of +5%.
▶ This occurred, even though all runners received the same race-day drinking advice and had equal access to fluids during the race.
▶ BW loss during the race was inversely related to 42 km race finishing time so that the fastest runners lost the most weight, with those finishing in less than 3 h losing >3% BW.
▶ When given the same race-day drinking advice and equal access to fluid, marathon runners respond individualistically.
▶ Some will gain weight as a result of overdrinking.
▶ There was no evidence that higher levels of BW loss impaired exercise performance.
▶ Instead, these data suggest that BW loss during a marathon race may be ergogenic in those who drink according to the dictates of their thirst.
▶ Alternatively, BW gain during exercise may be detrimental to performance.
Given this large number of factors that differ between laboratory and competitive sport, we propose that conclusions drawn from laboratory experiments of the effects of BW loss on exercise performance need to be evaluated with appropriate caution. Furthermore, the potential confounding influence of the belief systems of the subjects and researchers needs to be considered.
Scientists working with small groups of selected subjects in laboratory research should be aware that the outcomes of such experiments might be influenced by the prevailing concept held by the subjects, researchers or both. Scientists with specific beliefs could unknowingly influence the outcome of those trials by subliminally directing the beliefs and actions of those subjects. This question certainly invites scientific investigation.
In summary, this study failed to show that the fastest-finishing marathon runners lose less BW than do those who take longer to finish these races. This conflicts with the popular theory that BW losses of >2% are associated with impaired exercise performance. Instead, faster marathon finishing times were associated with higher levels of BW loss.
References
Footnotes
-
Competing interests None.
-
Ethics approval Ethics approval was provided by the Ethics Committee of the University of Rennes 2 and by the Organizing Committee of the 2009 Mont Saint-Michel marathon.
-
Provenance and peer review Not commissioned; externally peer reviewed.