Article Text

Abstract
Background Laboratory studies that support the hydration guidelines of leading governing bodies have shown that dehydration to only −2% of body mass can lead to increase in body temperature and heart rate during exercise, and decrease in performance. These studies, however, have been conducted in relatively windless environments (ie, wind speed <12.9 km/h), without participants being blinded to their hydration status.
Aim To investigate the effect of blinded hydration status on cycling time-trial performance in the heat with ecologically valid facing wind speed conditions.
Methods During three experimental trials, 10 cyclists were dehydrated to −3% body mass by performing 2 h of submaximal exercise (walking and cycling) in the heat, before being reinfused with saline to replace 100%, 33% or 0% of fluid losses, leaving them 0%, −2% or −3% hypohydrated, respectively. Participants then completed a 25 km time trial in the heat (33°C, 40% relative humidity; wind speed 32 km/h) during which their starting hydration status was maintained by infusing saline at a rate equal to their sweat rate. The treatment was participant-blinded and the order was randomised. Completion time, power output, heart rate, rectal temperature and perceptual variables were measured.
Results While rectal temperature was higher beyond 17 km of the time trial in the −3% vs 0% conditions (38.9±0.3°C vs 38.6±0.3°C; p<0.05), no other differences between trials were shown.
Conclusion When well-trained cyclists performed a 25 km cycling time trial under ecologically valid conditions and were blinded to their hydration status, performance, physiological and perceptual variables were not different between trials. These data do not support the residing basis behind many of the current hydration guidelines.
- Cycling
- Dehydration
- Endurance
- Fluid Balance
- Thermoregulation
Statistics from Altmetric.com
Introduction
It is commonly believed that dehydration (>2% of body weight) can degrade aerobic exercise performance, especially in warm-hot weather, and that the greater the dehydration level, the greater the physiological strain and aerobic exercise performance decrement.1 These beliefs are built on the basis of several laboratory-based studies that have consistently shown dehydration to be associated with increases in body temperature and heart rate, as well as decreases in endurance. For example, in the most recent review on the topic, Cheuvront et al,2 state that “when dehydration exceeds 3% of total body water (2% of body mass), then aerobic performance is consistently impaired independent and additive to heat stress.” Such decrease in performance as a result of dehydration is believed to be a consequence of the decrease in available total body water, leading to a lowered blood/plasma volume and consequently, a reduced stroke volume and cardiac output.3
In laboratory-based studies used to form these principles, hydration status has typically been manipulated prior to a performance trial using diuretics,4 or with prolonged exposure5 or exercise6 in a hot environment with limited or no fluid intake, leaving the effect of dehydrating during exercise largely unaccounted for. Moreover, rehydration is generally performed orally.3 ,6 ,7 Unfortunately, none of these methods allows for a blinding of the treatment, with participants clearly aware of the hydration status under which they are performing. It is possible, therefore, that a placebo effect could partially contribute to the reported performance outcomes shown in several laboratory-based studies.8 Although less commonly reported,9 intravenous infusion therapy can be used to manipulate hydration status. Such a method offers the unique ability to eliminate the placebo effect from influencing the performance outcome, as participants can be blinded to the amount of fluid reinfused after dehydration. Furthermore, this method can be employed to accurately and reliably control body water, as the amount of fluid infused goes directly into the blood stream, thereby removing any delays in fluid absorption that may occur with variable gastric emptying rates.10
Another factor that has been shown to alter endurance exercise performance and related physiological strain is the skin temperature and convective or evaporative cooling rate experienced during exercise. For example, Cheuvront et al5 showed an 8% reduction in 30 min time-trial performance in temperate (20°C) but not in cold (2°C) conditions, when moderately trained participants were dehydrated to −3%. Furthermore, in moderately active participants dehydrated to −4%, Kenefick et al11 showed that 15 min time-trial performance was only limited significantly when temperatures were above 30°C; trials performed below this temperature were not influenced by the −4% hypohydration. Saunders et al12 have also shown reduced core temperatures and lowered perceptions of fatigue during prolonged cycling in the heat when facing wind speed was nearer that experienced in outdoor cycling conditions (∼33 km/h). Thus, the convective/evaporative cooling rate associated with outdoor endurance exercise, especially cycling, and resulting lowered skin temperature, might influence physiological parameters and resulting exercise performance under different hydration levels. However, limited data have been obtained under these specific conditions, or in athletes who may be better able to tolerate higher levels of heat strain and dehydration.13 ,14
In light of the limitations associated with oral and diuretic-based hydration manipulation and the potential influence of wind speed on skin temperature and related physiological responses, the purpose of the current study was to examine the effect of intravenous infusion-adjusted hydration status on 25 km cycling time-trial performance in the heat in well-trained cyclists under wind speed conditions and convective cooling rates nearer those experienced with outdoor cycling. Based on the current fluid replacement guidelines for exercise,1 ,2 we hypothesised to find no difference in time-trial performance and related physiological variables with hypohydration up to −2% of body mass, but that decrements would appear in aerobic exercise performance concomitant with increased physiological strain at levels of −3% of body mass, compared with the euhydrated condition.
Materials and methods
Participants
Ten well-trained male cyclists (age, 32±5 year; height, 181.5±6.8 cm; body mass, 81.1±5.8 kg) volunteered to participate in this study. To attenuate the influence of week-to-week variations in total body water, a male-only cohort was selected, as women may have a greater week-to-week variation in total body water.15 Participants were instructed on the risks and benefits of their participation, and written informed consent was obtained prior to study participation. Ethical clearance was obtained from the institution's human research ethics committee before the start of the study.
The cyclists were requested to maintain regular training commitments (250–350 km/week) throughout the study and to refrain from any exercise on the day before each test. All tests were performed on a Velotron Cycle Ergometer (RacerMate; Seattle, Washington, USA), which was adjusted to the dimensions of the participants’ own bicycle and fitted with the cyclists’ own cycling pedals. All exercise tests were performed in a climate chamber that had the following dimensions: 2.9×6.8×2.7 m. Data collection for this study occurred during the summer period in Western Australia (November to April), where mean maximum daily temperatures ranged from 26.3°C to 30.4°C.
Experimental design
Participants were required to visit the laboratory on five separate occasions. During the initial visit, the cyclists were assessed for body composition through dual energy X-ray absorptiometry, before completing a progressive cycling test, which started at 70 W for 1 min and increased by 35 W/min until volitional fatigue. During the progressive test, participants were allowed to cycle at their preferred pedalling rate; the test was terminated either voluntarily, or when pedal rate dropped below 60 rev/min. Gas exchange was measured throughout the test using a validated16 ParvoMedics TrueOne 2400 diagnostic system (Sandy, Utah, USA). Immediately prior to the test, gas analysers were calibrated using α gases of known concentrations, and the ventilometer was calibrated using a 3 L syringe (Hans Rudolph, Inc, Kansas, Missouri, USA). Peak oxygen uptake (VO2peak) was defined as the highest VO2 value recorded over a 30 s average, while the workload (W and W/kg) corresponding to the first ventilation threshold (VT1) was determined as per the methods of Lucia et al.17
The second testing session was used to familiarise participants with the testing equipment and performance test. Participants completed a 25 km cycling time trial in the heat (33°C, 40% relative humidity (rh), wind speed 32 km/h), with wind speed generated using a large purpose-built fan positioned 1 m in front of the participant. Immediately before and after the time trial, nude body mass was measured and sweat rate (mL/min) was calculated as the difference between pretime and post-time trial body mass divided by the 25 km performance time. It was assumed that the body mass difference was equivalent to the amount of water lost due to sweat, and that participants had the same sweat rate for all subsequent time trials. This sweat rate calculation was used to control the rate of intravenous reinfusion for the remaining experimental trials.
Participants completed the remaining three trials in a randomised order, separated by at least 6 days to avoid the effects of acclimation due to constant heat exposure.18 As shown in figure 1, each trial consisted of a dehydration phase, a rehydration phase and a time trial. Prior to 6:30 arrival at the laboratory, participants were requested to be in a euhydrated state (subsequently defined) and to have consumed similar meals in the evening before and morning of all performance trials. In addition, participants were asked to refrain from strenuous physical activity in the 24 h period prior to each trial. Before the start of the trial, a venous catheter was inserted into an antecubital vein, where 10 mL venous blood samples were taken before and after each phase of the trial (dehydration, rehydration and time-trial phases). Urine samples were taken at identical time points.
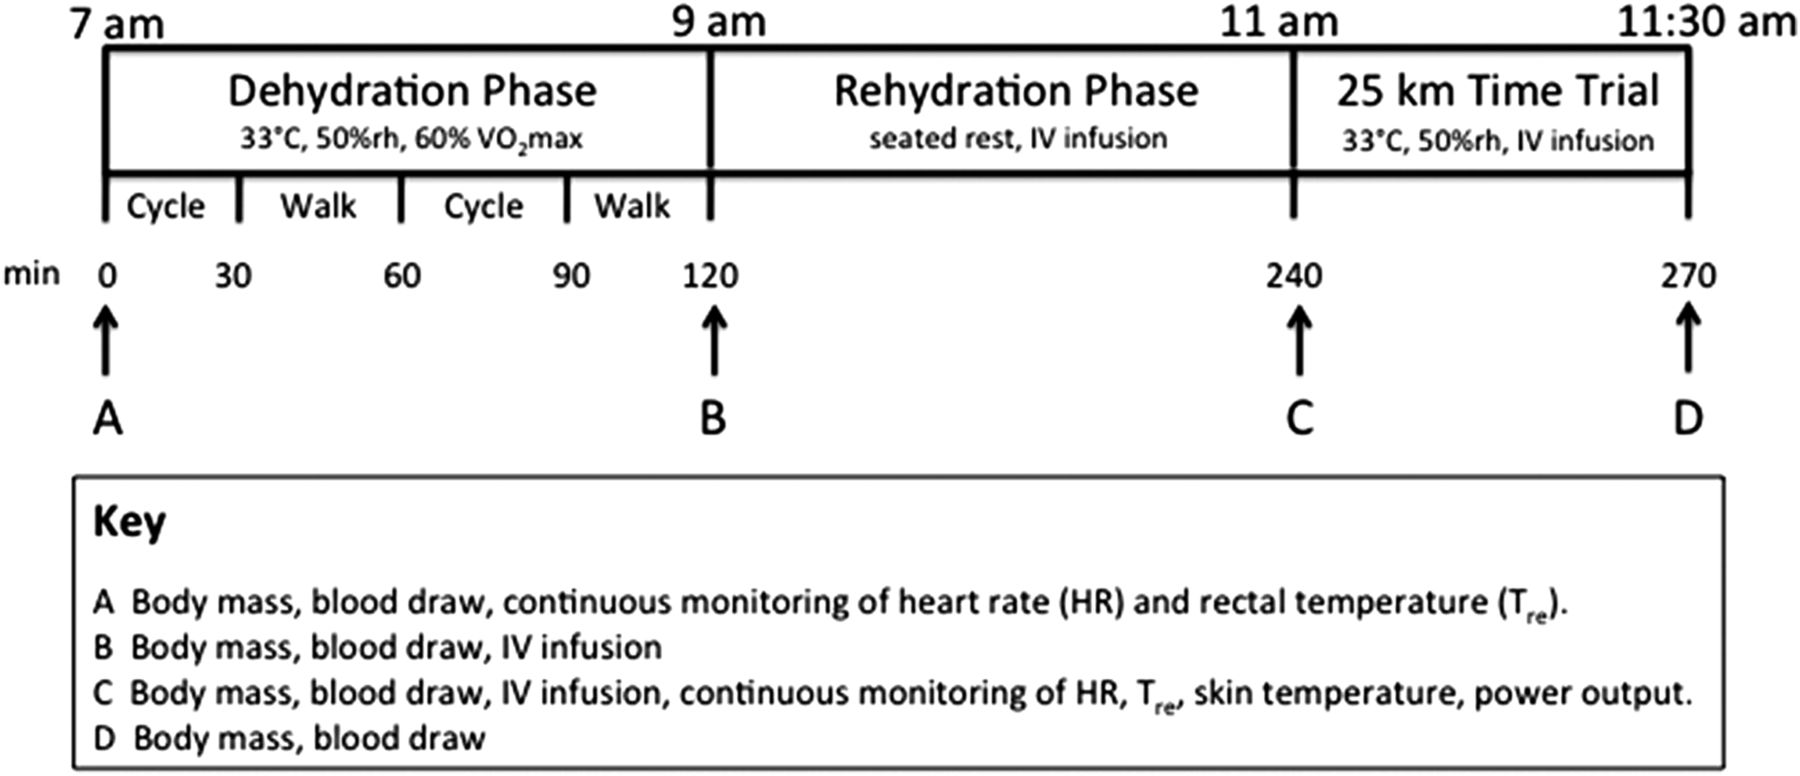
Experimental testing timeline.
Dehydration phase
The participants cycled for 30 min in the heat (37°C and 40% rh), followed by intervals of 30 min walks on the treadmill at ∼80% of VT1 until a 3% loss of body mass was observed. A percentage of the VT1 was used to individualise the procedure specific to each participant’s own prolonged exercise ability. Following confirmation of 3% hypohydration (via changes in nude body mass measured at 60 min and then every 30 min thereafter), participants were instructed to have a cool shower, before being weighed again to confirm the level of hypohydration. After the shower, participants entered a climate-controlled room (∼22°C) to begin the rehydration phase.
Rehydration phase
Rehydration was achieved by infusing a saline-based solution (PlasmaLyte Replacement, Baxter Healthcare, Deerfield, Illinois, USA) that contained the following concentrations of electrolytes: 140 mmol/L sodium, 5 mmol/L potassium, 1.5 mmol/L magnesium and 98 mmol/L chloride; the volume of which depended on the treatment. The rehydration phase consisted of one of three treatment conditions: (1) euhydration (EUH), a volume of saline equal to 100% of the change in body mass during the dehydration phase was infused; (2) 2% hypohydration, participants were infused with a volume of saline equal to 33% of the change in body mass during the dehydration phase to achieve 2% hypohydration and (3) 3% hypohydration, no saline infused so that participants remained 3% hypohydrated (although often a small amount was infused to obtain precisely 3% hypohydration). Participants were blinded with respect to the amount of saline reinfused. This was achieved by various means. First, all participants, regardless of rehydration strategy, were fitted with a venous cannula with the saline bags hidden from view. Second, a cool damp towel was placed over the forearm at the site of infusion to further disguise the infusion. Finally, the rates of intravenous infusion varied so that all treatments were completed in 90 min. After completion of the 90 min rehydration phase, participants were required to rest for a further 30 min to allow the fluid compartments of the body to equalise.
During the rehydration phase, participants were provided with a standardised meal to consume, which consisted of a commercially available breakfast bar (Kellogg's, Uncle Toby's, Melbourne) as well as a sandwich (white bread, butter, ham, cheese and tomato fillings). Ice cubes (10 mL water total) were provided to the participants to avoid the effects of ‘dry mouth’ on any sense of dehydration and subsequent thirst response. In addition to food, participants were allowed 100 mL of water with the meal to further aid in comfort; an amount of fluid that was subtracted from the intravenous reinfusion volume.
Time trial
After completion of the rehydration phase, participants completed a 25 km cycling time trial on the same stationary ergometer. Participants were instructed to complete the 25 km in the fastest time possible, with only ‘distance completed’ provided as feedback. The reliability of cycling time trials over similar distances have been reported to be good, typically eliciting a random error of between 2% and 3%.19 During the time trial, power output was recorded at a frequency of 1 Hz, and heart rate was measured using a Polar 810i heart rate monitor (Polar Electro Oy, Finland) at 5 s intervals, with 1 km average values reported.
Hydration during the time trial was achieved using continuous intravenous saline infusion (as described in rehydration phase), at an infusion rate matched to the sweat rate of the cyclist calculated from the 25 km familiarisation session. This ensured that the participant maintained the desired hydration status throughout the time trial. Infusion rather than drinking was necessary to avoid individual differences in gastric emptying rates, which tend to slow with increasing levels of dehydration.20
Hydration measures
Measures of hydration status were recorded on arrival, as well as before and after both dehydration and time-trial phases. EUH was defined by the following criteria: a urine specific gravity of <1.020,21 ,22 a serum osmolality of <290 mOsm/kg,21 ,23 a urine osmolality of <700 mOsm/kg 24 and a body mass within 1% of established baseline measures;25 all measures that have been previously shown to correlate well with changes in total body water.21 ,26 For the purpose of this study, all fluid lost during the time trial was referred to as ‘sweat rate’, as the body mass change due to respiratory water loss and substrate oxidation over the duration of the time trial (∼40 min) would have been negligible (∼108 mL).27
Blood measures
Ten millilitres of blood was collected from the catheter before and after the dehydration and time-trial phases. The predehydration, postdehydration and pretime trial blood samples were taken with the participant in a seated position for at least 10 min prior to the sample being taken. The final sample (post-time trial) was taken with the participant still on the bike immediately after completion of the time trial. A total of four blood samples were taken per trial (∼40 mL). Serum was extracted to determine the concentrations of sodium, potassium and chloride through an Easy Electrolytes bench top analyser (Medica Corporation, Bedford, Massachusetts, USA) as well as the osmolality through freezing point depression (Advanced Instruments, Inc, Needham Heights, Massachusetts, USA). A small sample of whole blood (65 μL) was used for determination of blood glucose levels and haematocrit (Hct) determined conductometrically via an iSTAT portable blood analyser (i-STAT Corporation, East Windsor, New Jersey, USA). Changes in blood volume were calculated using the Dill and Costill formula.28
Temperature measures
Skin temperature was measured using four flat-top copper skin thermistors (YTS Temperature, 400 Series; Dayton, Ohio, USA) attached on the chest, arm, thigh and calf and mean skin temperature was determined by Ramanathan's formula29:
Core body temperature was determined using a disposable rectal thermistor (Monatherm Thermistor, 400 Series; Mallinckrodt Medical, St Louis, Missouri, USA), which was self-inserted to a depth of 12 cm from the anal sphincter. All temperature measurements were recorded during the dehydration phase and time trial using a data logger (Squirrel SQ2020, Grant Data Acquisition) at a sampling rate of 1 Hz.
Sensation scales
Rating of perceived exertion (RPE) was measured using a 15-point scale,30 and thermal sensation measured using a 9-point scale, that ranged from 0 (unbearably cold) to 8 (unbearably hot), with 4 being comfortable.31 Perceived thirst was measured using a 9-point thirst scale that ranged from 1 (not thirsty at all) to 9 (very-very thirsty).32 All sensation scales were collected pre-dehydration, post-dehydration, pre-time trial (rehydration) and post-time trial.
Statistical analysis
Changes in hydration status, body temperatures, blood markers, heart rate, mean 1 km power output and 25 km power output were analysed using a two-way (condition×time) analysis of variance with repeated measures, with the number of time points analysed dependent on the sampling frequency (see Methods section). Main effects and interactions were evaluated using Tukey's honestly significant difference post hoc test. Statistics were analysed using SPSS statistical software (V.16.0, Chicago, Illinois, USA), with statistical significance accepted at an α level of 0.05. Data reported are means±SDs.
Results
Participant characteristics
Participant characteristics measured (11±2% body fat, VO2peak 61.7±2.2 mL kg/min, peak power 438±35 W) demonstrated that a trained population of male cyclists was recruited for this study.33 In accordance with previous literature,34 ,35 all participants were classified as euhydrated before each trial on the basis of their starting body mass, serum sodium and serum osmolality, which were not significantly different between trials (table 1).
Body mass, per cent change in body mass, haematocrit, blood volume change, serum osmolality and serum sodium measured at various phases of the experiment
Effect of hydration status on physiological variables
It was assumed for the purposes of this study that changes in a participant's body mass would provide an accurate indication of a participant's body water losses. Changes in body mass from predehydration to postdehydration phase in the euhydrated (0.02±0.08%), 2% dehydrated (−2.07±0.11%) and 3% dehydrated (−3.00±0.02%) conditions demonstrate the precision of the saline reinfusion technique for altering hydration status.
While the treatment order was correctly identified by 3 of the 10 participants, these three participants commented that their predictions were based on how they felt during their time-trial performance, and not due to any perceptual cues that might have occurred during the rehydration phase. Of the seven participants who incorrectly identified their treatment order, four incorrectly identified all three of the conditions. The remaining three of the seven participants correctly identified being euhydrated and dehydrated, but could not distinguish between being −2% and −3% hypohydrated.
Rectal temperature, heart rate, serum sodium as well as time to complete the dehydration and rehydration phases (85:09±5:59 min:s), were not different between conditions. Changes in body mass over the duration of each trial are shown in table 1. Hct was affected by the volume of Plasma-Lyte infusion during rehydration (interaction, p<0.001), decreasing significantly more (−6.8%) when participants were fully rehydrated (euhydrated) compared with when they were partially rehydrated (−2% dehydrated) and when they remained −3% dehydrated (table 1). Likewise, calculated percentage change in blood volume (%ΔBV; table 1) was affected by the amount of fluid infused during rehydration (interaction, p<0.01). The %ΔBV was greater after rehydration when participants were euhydrated compared with both dehydrated trials (p<0.01). As well, the %ΔBV was greater in the −3% compared with the −2% trial (table 1; p<0.01). Serum sodium concentration was affected by the amount of fluid infused during rehydration (interaction, p=0.003); it was higher in euhydrated compared with −3% dehydrated (p<0.01), and it was significantly higher in the −2% compared with −3% dehydration condition (p=0.008). Serum osmolality responded similarly between trials during the rehydration phase (table 1).
Time-trial performance
Mean time-trial power output (figure 2D) was not different between the euhydrated (249±27 W), −2% dehydrated (251±28 W) and −3% dehydrated (253±30 W) conditions. Similarly, the time (min:s) needed to complete the time trial was 40:38±2:12, 40:35±2:05 and 40:36±2:06 in the euhydrated, −2%, and −3% dehydration trials, respectively, which were not different between conditions.

Mean weighted skin temperature (MWST; A), rectal temperature (Tre; B), heart rate (HR; C) and power output (D) throughout the 25 km time trial.
Thermal, physiological and cognitive responses to manipulated hydration levels
Rectal temperature responses were only different between the −3% dehydrated and euhydrated conditions during the time trial (interaction, p=0.001; table 2) from the 17 km mark until the end of the 25 km time trial (p<0.05; figure 2B). Rectal temperature responded similarly in the euhydrated and −2% dehydration conditions. In all time trials, rectal temperature increased significantly over the duration of the trial. While mean weighted skin temperature increased significantly over the duration of all trials, there was no interaction or treatment effect evident (figure 2A).
Perceptual responses including thermal sensation, perceived thirst and rating of perceived exertion measured at various phases of the experiment
While heart rate increased during the time trial, it was not affected by hydration status (figure 2C; p>0.05). As shown in table 2, hydration status had no effect on RPE, thirst or thermal sensation during the time trial. The change in blood volume and serum sodium (table 1) was also not affected by hydration status during the time trial (p>0.05).
Discussion
To our knowledge, this is the first study to document the effect of blinded hypohydration on aerobic exercise performance in the heat under ecologically valid (ie, outdoor-related) wind speed conditions. The main finding was that the blinded intravenous saline infusion treatment, which induced different hydration levels in terms of participants’ body mass, had no effect on any aspect of cycling time-trial performance, heart rate or perceived effort. Our findings are at odds with a number of commonly believed concepts, including those listed in the American College of Sports Medicine Position Stand for Exercise and Fluid Replacement.1 The beliefs our data contest include (1) that ‘dehydration increases the perceived effort to perform the same exercise task, and that this is accentuated in warm-hot weather’,1 (2) that ‘dehydration (>2% of body weight) can degrade aerobic exercise performance, especially in warm-hot weather’,1 and (3) that ‘the greater the dehydration level, the greater the physiological strain and aerobic exercise performance decrement’.1 Indeed, there was no difference in time-trial performance, heart rate, skin temperature or perceived exertion between conditions, and rectal temperature was only higher during the later stages of the 25 km time trial (tables 1 and 2; figure 2).
Our findings contradict a body of literature built on research showing that drinking to offset dehydration prevents a cascade of factors that may be responsible for the decrease in aerobic performance often shown. For example, to investigate the effect of graded levels of dehydration on the physiological response to exercise, Montain and Coyle3 had well-trained cyclists ride at 62–67% of VO2peak for 2 h in the heat (33°C, 55% rh, wind speed 9 km/h) using fluid ingestion rates that replaced 0, 20, 40 or 81% of body mass loss during exercise. The authors showed that the increase in rectal temperature and heart rate and the decrease in stroke volume were graded in proportion to the amount of dehydration accrued.3 Laboratory cycling performance can also be reduced. For example, Walsh et al7 had trained cyclists ride in the heat (33°C, 66% rh, wind speed 3 km/h) for 60 min at 70% of VO2peak and then to exhaustion at 90% of VO2peak. In random order, cyclists performed the trial and either drank 1 L of fluid throughout or no fluid. High-intensity cycling time to exhaustion was significantly increased by 44% when participants drank during the trial.7 Outdoor endurance performance has also been shown to be influenced by hydration status. Using furosemide-induced diuresis (−1.5% to −2% body mass), Armstrong et al4 showed that 5000 and 10 000 m running performances were reduced by 6.7% and 6.3%, respectively, under the diuretic-induced dehydration conditions. There are several other examples documented in the most recent review on the topic.2 The findings from these studies suggest that dehydration lowers endurance exercise performance by reducing blood volume, stroke volume and cardiac output, and by raising heart rate and body temperature. But with the exception of the 0.3°C higher rectal temperature during the latter stage of the 25 km time trial in the −3% hypohydration trial, the current study is to our knowledge the first laboratory study to show no effect of hydration status in hot conditions on endurance exercise performance, skin temperature and heart rate, at least at hypohydration levels to −3% of body mass.
There are at least three potential reasons for the contrasting results of our study. We speculate that the dissimilar responses we have shown, compared with most literature, may be due to (1) removal of sensory cues related to hydration status, (2) the higher convective and evaporative cooling rates used and (3) the restoration of blood volume and osmolality during the rehydration phase in all conditions.
Effect of hydration-related sensory cues on the exercise performance response
In most prior studies that have manipulated hydration status to examine its effects, participants have been clearly aware of their hydration status, either through knowledge of how much they have drunk or in the case of diuresis-induced dehydration, how much they have urinated. It is therefore possible that a participant's prejudiced belief regarding the detrimental effects of exercising while dehydrated may have contributed to an altered behaviour (ie, exercise performance), not necessarily in response to the treatment per se, but rather due to the belief of its effect. Indeed, the expected outcome of an intervention has been shown to influence performance.8 The removal of this potential anticipatory component in the current study is one factor that could account for the maintenance of performance shown, irrespective of hydration status. The use of intravenous infusion meant that our treatment could be blinded during the rehydration phase and sweat rate could be matched more closely by controlling the rate of infusion during the time trial. Furthermore, no differences in sweating rate, percentage change in blood volume or plasma osmolality were shown between rehydration methods, suggesting that both treatments were equally effective at restoring lost body fluids.36
In the current study, the lack of sensory cues in the oral cavity related to the process of drinking and arrival of fluids could be another contributing factor to the dissimilar results shown. Recent studies have demonstrated the remarkable ability of the oral cavity to sense changes related to both energy37 and temperature,38 which may activate brain regions involved in reward and motor control, and alter subsequent exercise performance. Thus, the process of drinking itself, and the resulting sense of fluid arrival, could contribute as much to the exercise performance as more traditionally related physiological factors such as blood volume, stroke volume, heart rate and body temperature. Most recently, Arnaoutis et al39 showed that the act of swallowing a small volume of water (25 mL/5 min) increased exercise time to exhaustion by 17% compared with mouth rinsing and spitting the same fluid amount. Moreover, a classic study by Figaro and Mack40 had participants rehydrate by (1) drinking ad libitum, (2) infusing a similar volume of water directly into the stomach through a nasogastric tube and (3) drinking ad libitum but simultaneously extracting the ingested fluid through a nasogastric tube. Interestingly, the authors found a reflex inhibition of arginine vasopressin and thirst with both ad libitum drinking methods, but not with infusion, suggestive of the fact that oropharyngeal reflexes could play an important role with respect to the modulation of thirst and the secretion of arginine vasopressin. In accordance with these observations, it has been hypothesised that it is the development of thirst, rather than body fluid deficit per se, that impairs exercise performance.41 Indeed, during field-based exercise performances, athletes drink according to thirst in an attempt to mitigate these detrimental effects.42 In the current investigation, as perceived thirst (table 2), and its proxy, blood osmolality (table 1), were not different between conditions, this could explain why performance was virtually identical between the different hydration conditions. Such a finding supports the contemporary viewpoint that athletes need only drink to thirst to maximise their exercise performance.42–44
Influence of chosen facing wind speed on performance with hypohydration
A traditional mechanism thought to contribute to a reduced exercise performance with dehydration in the heat includes the effect that heat has on skin temperature and the resulting redistribution of blood flow to the cutaneous vasculature that must occur to offload heat. Such an increase in blood flow to the skin lowers the amount of blood that can be directed to working muscles, which is thought to limit exercise performance.26 In an attempt to provide an ecologically valid performance setting for cyclists, the current study used a large fan that provided a facing wind speed near that of forward cycling speed (∼32 km/h). The influence of wind speed on heat storage and cycling performance was shown by Saunders et al12 when they examined the effects of different facing air velocities on body temperature and heat storage during cycling in hot environmental conditions (33°C, 59% rh). In this study, cyclists rode to exhaustion at 60% of peak power output while replacing 59±7% of sweat losses, under four different wind speed conditions (0.2, 9.9, 33.3 and 50.1 km/h). Heat storage, body temperature and RPE were higher at 0.2 and 9.9 km/h wind speeds compared with all other conditions. Interestingly, the authors asked the participants to complete another trial under the 33.3 km/h wind speed conditions, and to replace 80±7% of sweat losses. No differences in any measured physiological variable were shown between the two drinking conditions. With the exception of rectal temperature in the current study, which was a modest 0.3°C higher in the latter stages of the time trial when participants were −3% hypohydrated compared with the euhydrated condition, our findings parallel those of Saunders et al,12 suggesting that the influence of hydration status on core temperature is minimal during cycling performance in the heat when convective cooling rates are adequate.
Effect of hydration status on core temperature, skin temperature, heart rate and blood volume
Numerous studies have analysed the effects of graded hypohydration on core body temperature, with the majority of the literature suggesting that a 1% reduction in body weight has the capacity to elevate rectal temperature anywhere from between 0.10°C and 0.20°C when compared with exercise in a euhydrated condition.6 ,15 ,45 ,46 Body water losses have been reported to contribute to the reduced ability to store and dissipate heat during exercise.26 During the current study, rectal temperature was significantly greater in the −3% hypohydration trial, from 17 km until the end of the 25 km time trial or for the last 13 min of the time trial when compared with being euhydrated. Although not statistically significant, the final temperature in the −2% trial was 0.21°C higher than the same point in the euhydrated trial. Thus, our data agree with some of the more conservative estimations from the hydration literature, whereby core temperature is predicted to increase by 0.10°C for every 1% reduction in body weight.46 While this marginal rise in core temperature with hypohydration was found, a 0.1–0.3°C difference in core temperature during exercise within the normal exercise temperature range (ie, 37.5–39°C) is unlikely to be meaningful to either performance or health, as shown in the current study.
Many of the similarities in physiological responses shown between the different hydration conditions are likely explained by the changes (or lack of changes) in blood volume observed during the rehydration phase. In all three conditions, blood volume was restored to (−3%) or above (−2% and EUH) baseline values before the time trial (table 1). Indeed, Saltin47 showed long ago that ‘the vascular compartment resists volume depletion’. Likewise in the current study, blood volume was not compromised by hypohydration, and at the completion of the time trial, was similar to baseline values. Thus, the body's own restoration of its blood volume (ie, through renal/hormonal adjustments in sodium and osmolality; table 1), despite a total body water deficit of up to −3% of body mass, appears to have mitigated any negative effects of hypohydration, and allowed cyclists to perform at their best irrespective of their hydration condition.
In conclusion, the current study has shown that hypohydration up to −3% had no effect on 25 km cycling time-trial performance in hot conditions (33°C, 40% rh), when well-trained participants were blinded to their hydration status and facing air speed was at a rate near that of field-based forward cycling speed (ie, ∼32 km/h). While rectal temperature was marginally (0.3°C) but significantly higher in the −3% hypohydration condition over the last 13 min of the time trial compared with the euhydrated condition, skin temperature, heart rate and power outputs were not different between conditions. Our findings contrast a well-established dogma that dehydration (>2% of body weight) increases perceived effort and degrades aerobic exercise performance, especially in warm-hot conditions,1 ,2 and in concert with recent meta-analyses42 ,43 suggest that previous position stands on exercise and fluid replacement be revisited.
What are the new findings
When hydration status was manipulated using blinded intravenous saline reinfusion methods, there was no difference in 25 km time-trial performance in the heat with hypohydration to −3% of body mass with ecologically valid convective cooling conditions (wind speed at ∼32 km/h).
Rectal temperature was modestly but significantly higher (0.3°C) beyond 17 km of the time trial in the −3% vs 0% hydration conditions, but no other physiological differences between the trials were shown.
While not a new finding, one seemingly forgotten in recent times was the body's rapid defence of its plasma and blood volume following dehydration, even when only a negligible volume of fluid was reinfused.
Acknowledgments
Appreciation is extended to Professor Tim Noakes and colleagues for inspiring us to test our hypothesis using the study design applied, and to Deborah Cohen for encouraging us to continue our efforts to publish the work. We would also like to thank Nadija Vrdoljak for technical assistance and Daniel Plews for assistance with figure drawing.
References
Footnotes
Contributors BAW completed the study as part of his Masters degree requirements at Edith Cowen University, Perth. This involved completing a study proposal, being the primary person recruiting participants and collecting data, analysing the data and creating a first draft of the manuscript from his Master’s degree thesis. GW conceptualised the study design, completed data collection, data analysis and manuscript writing. JJP and CRA assisted with data collection and manuscript writing. RS assisted with data analysis and manuscript writing. PBL is the primary supervisor of the student conducting the study, and led the study proposal, design, analysis and wrote the final version of the manuscript.
Competing interests None.
Patient consent Obtained.
Ethics approval ECU Human Research Ethics Committee.
Provenance and peer review Not commissioned; externally peer reviewed.
Data sharing statement All data are available through the ECU Library—Search for Bradley Wall Masters Thesis.