Article Text

Abstract
Aims (1) To investigate whether a daily acute:chronic workload ratio informs injury risk in Australian football players; (2) to identify which combination of workload variable, acute and chronic time window best explains injury likelihood.
Methods Workload and injury data were collected from 53 athletes over 2 seasons in a professional Australian football club. Acute:chronic workload ratios were calculated daily for each athlete, and modelled against non-contact injury likelihood using a quadratic relationship. 6 workload variables, 8 acute time windows (2–9 days) and 7 chronic time windows (14–35 days) were considered (336 combinations). Each parameter combination was compared for injury likelihood fit (using R2).
Results The ratio of moderate speed running workload (18–24 km/h) in the previous 3 days (acute time window) compared with the previous 21 days (chronic time window) best explained the injury likelihood in matches (R2=0.79) and in the immediate 2 or 5 days following matches (R2=0.76–0.82). The 3:21 acute:chronic workload ratio discriminated between high-risk and low-risk athletes (relative risk=1.98–2.43). Using the previous 6 days to calculate the acute workload time window yielded similar results. The choice of acute time window significantly influenced model performance and appeared to reflect the competition and training schedule.
Conclusions Daily workload ratios can inform injury risk in Australian football. Clinicians and conditioning coaches should consider the sport-specific schedule of competition and training when choosing acute and chronic time windows. For Australian football, the ratio of moderate speed running in a 3-day or 6-day acute time window and a 21-day chronic time window best explained injury risk.
- Injury prevention
- Australian football
- Training load
This is an Open Access article distributed in accordance with the Creative Commons Attribution Non Commercial (CC BY-NC 3.0) license, which permits others to distribute, remix, adapt, build upon this work non-commercially, and license their derivative works on different terms, provided the original work is properly cited and the use is non-commercial. See: http://creativecommons.org/licenses/by-nc/3.0/
Statistics from Altmetric.com
Introduction
Training loads can influence performance1–3 and injury risk4–9 in team sport athletes. The acute:chronic workload ratio is defined as the ratio of an athlete's short-term (acute) training load to the mean of their long-term (chronic) training load.10–12 The acute:chronic workload ratio appears to be a valid tool to assess an athlete's level of readiness to train or compete and their risk of injury.10–15 Blanch and Gabbett10 reported a quadratic relationship (R2=0.53) between the 1-week (acute) to 4-week (chronic) workload ratio and injury risk in a pooled set of athletes from cricket, rugby union and Australian football. Improvements in injury risk models may be possible by varying the way the acute:chronic workload ratio is calculated.
The acute:chronic workload ratio has previously been quantified using different internal and external workload variables.12 ,13 ,15 Hulin et al 13 ,15 used balls bowled and session duration×rating of perceived exertion (session-RPE)16 in cricket;13 studies of rugby league used total distance run.12 ,15 The relationships between different acute:chronic workload ratios and injury risk are yet to be explored in Australian football. It is possible that different internal or external workload variables may have greater influence on injury likelihood than others.
Acute workloads were defined as the total amount of training load in the previous calendar week, and chronic loads as the mean weekly load in the preceding 3–4 weeks.12 ,13 ,15 However, the rationale for these time windows are based on studies of swimmers tapering for performance1 ,2 and it is not known if varying these time periods will increase or decrease the accuracy of injury risk models. Furthermore, previous studies have modelled workload ratios against injury likelihood in the current and subsequent weeks.12 ,13 It is not known if workload ratios calculated on a daily basis can explain injury likelihood in individual training sessions and matches.
This study aimed to: (1) investigate whether daily acute:chronic workload ratios can inform non-contact injury risk in training sessions and matches, as well as the subsequent 2 and 5 days in Australian football, and (2) identify which combination of workload variable (athlete training loads monitored using Global Positioning System (GPS) devices, accelerometers and session-RPE), acute and chronic time window (varying between 2–9 days and 2–5 weeks) best explained the variation in injury likelihood.
Methods
Participants
All participants involved in the study were from one professional Australian football club competing in the Australian Football League (AFL). The club fielded 45 athletes in the 2014 season and 45 in the 2015 season, giving a total of 90 player-seasons from 53 unique athletes (mean±SD 22.9±4.0 years, 188.2±6.7 cm, 85.7±8.1 kg). Informed consent was received from the club for collection and analysis of de-identified training and injury data. The project was approved by the La Trobe University Faculty of Health Sciences Human Ethics Committee (FHEC14/233).
Data collection
All players wore commercially available 10 Hz GPS devices and 100 Hz triaxial accelerometers (Catapult Optimeye S5) during all outdoor training sessions and matches. The technology used has been previously validated for use as an athlete monitoring tool in Australian football.17–19 Session-RPE data were recorded in all sessions that GPS devices were used.16 While session-RPE is able to monitor loads in other training modalities (eg, resistance training and cross-training), these data were not available.
Seasons were structured with a precompetition phase (15 weeks), followed by a competitive phase (27 weeks) with regularly scheduled matches usually between 6 and 8 days apart. The weekly training schedule during the competitive phase varied depending on the number of days turnaround between matches. In general, the 2 days postmatch were dedicated to recovery and the main training session was held 2 or 3 days prior to the next match, the main training session was never held within the recovery period. When the schedule permitted, an additional accessory training session was included in between the recovery period and the main training day. The competitive phase of the season was defined to begin once the team started playing matches against competing clubs. Thus interclub practice matches were treated the same as regular season matches in all injury risk analyses and precompetition training sessions were included in chronic load calculations.
Injury definition
Injuries were recorded and classified by club medical staff using the Orchard Sports Injury Classification System (OSICS).20 All injuries were classified according to the mechanism by which they occurred (contact or non-contact) as well as severity (transient or time loss). Time-loss injuries were defined as those causing a player to be unavailable for training or competition.21 In this study, we focused on time-loss non-contact injuries. Transient injuries and traumatic injuries caused by collisions and other contact events were excluded from injury risk models.
Injury lag periods
To account for possible delay effects in injury occurrence and reporting, we considered three different injury lag periods (figure 1). On each training or match day, we observed whether an injury occurred: (1) that day (no lag time), (2) that day or the following 2 days, or (3) that day or the following 5 days. These periods were chosen to represent risk in: (1) a single session, (2) a short period postsession not including the next main session and (3) a longer period incorporating the next main session but not overlapping with more than one competitive match.
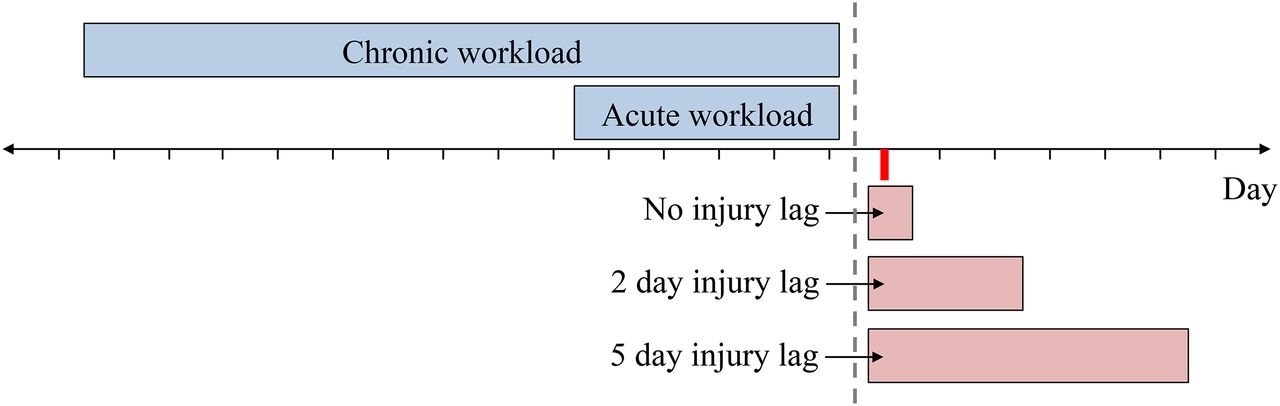
The definition of acute and chronic workloads and injury lag periods on a given day during the season (highlighted in red). Note the separation between workload and injury outcome periods.
Daily acute:chronic workload ratio
We propose a method of daily acute:chronic workload calculation using moving averages of daily loads. Defining the workload of an athlete on day i as wi, the acute:chronic workload for that day (ri) is calculated: 1
1
where a and c represent the time windows (in days) over which the acute and chronic workloads are calculated. This formula calculates the workload ratio each day by taking the average daily workload in the previous a days (ie, not including what was done on that day) and dividing it by the average daily load in the previous c days.
In defining the above acute:chronic workload ratio, there is freedom of choice in the parameters a and c as well as the workload variable w. In this study, we investigated the effect of varying the acute and chronic time windows on the ability of the acute:chronic workload ratio to inform injury risk. We allowed parameters to vary such that: a ∈{2, 3, 4, 5, 6, 7, 8, 9} and c ∈{14, 18, 21, 24, 28, 32, 35} and considered each of the 56 possible combinations.
The set of workload variables considered in this study is presented in table 1. For each of the 6 workload variable choices, we examined 56 combinations of acute and chronic time windows, giving a total of 336 unique parameter combinations. The discrete velocity bands used in this study (18–24 and 24+ km/h) were chosen to represent the speeds at which Australian football players reached their anaerobic threshold and sprinting threshold, respectively (unpublished data). Individualised velocity bands can offer a different interpretation of running demands;22–24 however, these data were not available in the studied cohort.
Workload variables considered in workload ratio modelling
Data analysis
For each combination of acute time window, chronic time window and load variable {a, c, w}, we calculated the acute:chronic workload ratio (r) for each player, each day. Workload ratios were binned into quantile groups and injury likelihood in each bin calculated as the proportion of match or training sessions resulting in injury.10 To account for possible effects introduced by choosing the number of quantile bins, models were generated for 7, 9 and 11 bins and results averaged to give a more robust assessment of the strength of relationship between workload ratio and injury risk. All figures were produced using 11 quantile bins for clarity of presentation.
Workload ratios were modelled against injury risk using a quadratic regression similar to Blanch and Gabbett.10 The independent variable was taken to be the mean of workload ratio within each bin and the dependent variable the associated injury likelihood. The ability of each workload ratio to explain injury likelihood was assessed using the R2 statistic. All models were created using the R statistical programming language (R Core Team. R: a language and environment for statistical computing. Vienna, Austria, 2014).
Injured players were included in risk analyses as soon as they began rehabilitation at the club. Their workloads in rehabilitation training were recorded and their ratio calculations did not differ from other players. To avoid extreme spikes in workload ratio for players with abnormally low chronic loads (ie, players returning from injury or after a scheduled break), a data preprocessing step was applied to remove observations when the chronic workload was <2 SDs below the mean.12 This did not interfere significantly with match observations due to a selection process that restricted players from participating in matches if they did not have a sufficient fitness base.
Results
Injuries
Over the two seasons, monitored players experienced a total of 178 time-loss non-contact injuries. A breakdown of the injuries by injury site and activity performed on the date the injury was recorded is shown in online supplementary table S1. The majority of injuries were recorded in matches (n=59) and main training sessions (n=68). The distribution of match turnaround times and injury rates is shown in table 2. Similar rates of injury (∼3%) were observed for 6, 7, 8 and 9+day gaps between matches. Table 2 also shows that players were very rarely required to play consecutive matches without at least a 6-day break. It is likely that this distribution of turnaround times is representative of other professional Australian football teams since the sport's governing body gives consideration to match turnaround times when creating the competition schedule.
Distribution of times between player matches and injury rates
supplementary tables
Acute:chronic workload ratio and injury risk
The ratio of 6:14 days distance load best explained the variation in injury likelihood in matches and training sessions combined (mean R2=0.91; figure 2A). However, when the relationship was decomposed by session type (figure 2B), we observed considerably different injury risk profiles. Matches were associated with higher injury likelihood than training sessions, irrespective of the athlete workload ratio (relative risk (RR)=4.04, 95% CI 2.86 to 5.70). Thus, while it is appropriate to group matches and training sessions together for load calculations, it may not be so when analysing injury likelihood. Since results suggested that most injury risk is contained within competitive matches, we have focused our injury risk analyses on matches. The following sections exclude injuries sustained during the precompetition phase (n=65) and injuries by players completing rehabilitation of previous injuries (n=16).
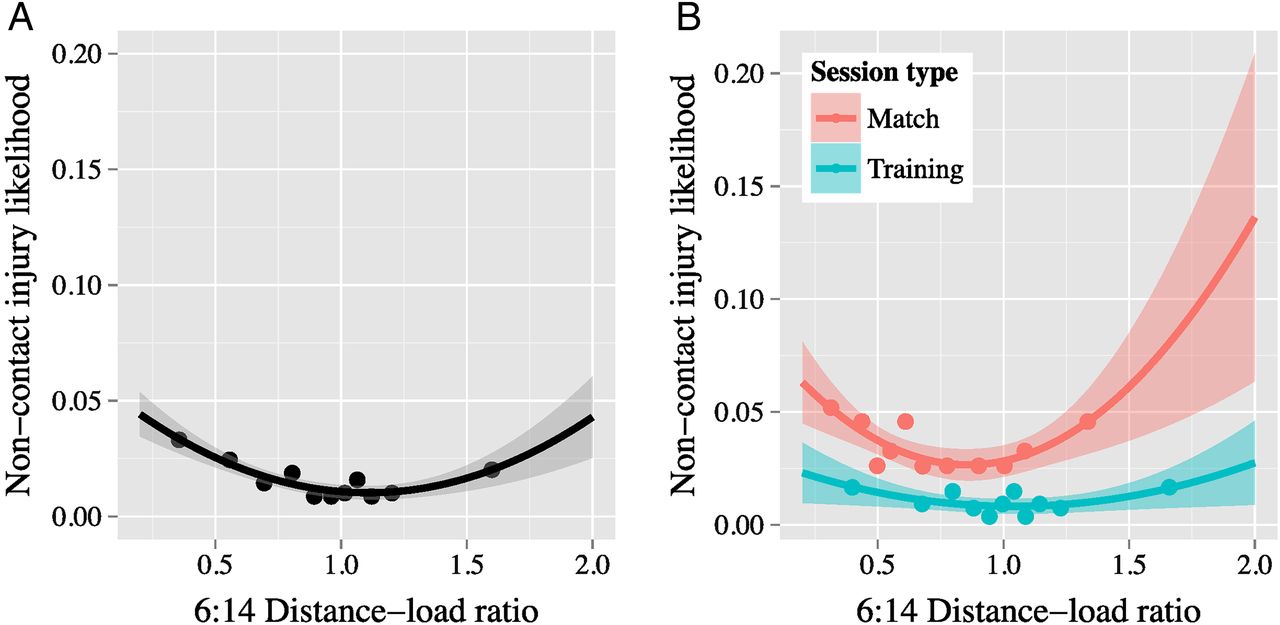
Relationship (with 95% CI) between 6:14 distance-load ratio and non-contact injury likelihood for: (A) matches and training sessions combined (mean R2=0.91) and (B) matches (mean R2=0.54) and training sessions (mean R2=0.53) separately.
Best predictors of match injury risk
Figure 3 shows the best performing (highest mean R2) risk models for each injury lag period in matches only. The ratio of 3:21 days moderate speed running load (highlighted cells) was observed to consistently explain injury likelihood for each time period considered (mean R2=0.76–0.82). This compared favourably with the 7:28 distance ratio (mean R2=0.04–0.41), and with previous studies using workload ratios calculated weekly (R2=0.53).10

Injury likelihood profiles (with 95% CIs) of the top 3 performing parameter combinations for explaining: (A) match injuries, (B) match injuries and following 2 days, and (C) match injuries and the following 5 days. HSR, high speed running (>24 km/h); MSR=moderate speed running (18–24 km/h).
The best performing injury risk models displayed similar shapes to those seen in previous studies.10 ,11 ,13 Irrespective of the acute time window, chronic time window or workload variable, the risk profiles suggested that athletes minimised their likelihood of non-contact injury when they approached matches with workload ratios around 0.8–1.0. Injury likelihood was greater for athletes with lower or higher ratios.
To investigate the different levels of risk, a RR analysis was performed on injury likelihood for workload ratios in the range 0.8–1.2 versus all observations outside of this range. The significant RR values for matches (95% CIs excluding 1) are shown in table 3. RR values including a 2-day or 5-day injury lag period are included in online supplementary tables S2–S3. These data quantify the level of risk associated with being outside of the ‘safe’ range (0.8–1.2) for different acute:chronic workload parameter combinations.
Relative risk of non-contact time-loss injury in matches
Similar to figure 3, the RR analysis identified moderate speed running with a 3-day acute time window as able to discriminate between high-risk and low-risk athletes in matches and the subsequent 2–5 days (RR=2.29–2.59). High speed running workload ratios were also highlighted by the RR analysis in table 3; however, the magnitude of risk was not significantly higher (RR=2.74 vs 2.59) than for moderate speed running and R2 values were lower (R2=0.24 vs 0.65). This suggested that while high speed running workload ratios appear to influence injury risk, moderate speed running may be a better choice to track in Australian football.
Effects of varying acute and chronic time window
Figure 4 shows the effects of varying the acute and chronic time windows on the ability of moderate speed running workload ratio to explain non-contact injury risk in Australian football matches (figure 4A) and the subsequent 2 (figure 4B) or 5 days (figure 4C). Moderate speed running was chosen for the workload variable due to it appearing as a top 3 workload parameter more than any other choice (figure 3).

Effects of varying acute and chronic time window on model R2 performance for: (A) match injuries, (B) match injuries and following 2 days, and (C) match injuries and the following 5 days. Moderate speed running used as the workload variable.
Peaks in model R2 for acute windows of 3 days and chronic windows of 21 days are clear for each injury lag period, and corresponded to the highlighted workload ratios in figure 3. The model performance contours suggested that acute time windows of 3 and 6 days generated better performing injury risk models, and that performance was highly sensitive to the choice of an acute time window. The optimal choice of a chronic time window was less clear, but 21 or 28 days (3 or 4 weeks) appeared to be a valid choice.
Effects of including injury lag periods
The similarity in model performance across each injury lag period (best R2=0.76–0.82, mean R2=0.26–0.28 and peak RR=2.29–2.74) suggested that the daily acute:chronic workload ratio can inform injury risk in Australian football matches and that including a forward looking injury lag period does not significantly improve the ability to explain variations in match injury rates.
Discussion
Daily acute:chronic workload ratio and injury risk
Acute:chronic workload ratios using moderate speed running, a 3-day or 6-day acute time window and a 21-day or 28-day chronic time window were best able to explain non-contact injury risk in the following three time periods: (1) matches, (2) matches and the next 2 days, and (3) matches and the next 5 days. The performance of injury risk models suggests that it is valid to track Australian football player workload ratios on a daily basis. This extends previous studies that found workload ratios, calculated on a weekly basis, and explained injury risk in cricketers13 and rugby players.12 ,15
Non-contact injury risk was significantly higher in competitive matches compared with training sessions (RR=4.04, 95% CI 2.86 to 5.70), suggesting that injury risk models can be strengthened by modelling match injuries separately to training injuries. Previous studies10 ,12 using weekly workload ratios avoided this issue by considering time spans that covered multiple training sessions and potentially multiple matches.
Injury likelihood profiles in figure 3 have consistent shape to previous study findings,10 ,11 ,13 suggesting that athletes are at minimum injury risk when their workload ratios are in the range 0.8–1.0. Risk increases as players have ratios on either side of this region. Using the ratio of 3:21 days moderate speed running, the model predicted that match injury risk doubled (from 1.8% to 3.6%) if the workload ratio deviated from 1 to 1.4 or 0.5. This result, using a daily workload ratio, extends conclusions from previous studies11 that rapid changes in training loads are associated with increased injury likelihood. The rate of increase in injury risk may differ for different parameter combinations, evidenced by the divergence of the curves in figure 3. However, a lack of data for athletes with very high workload ratios leading into matches prevented the identification of particular workload ratios as more ‘risky’ than others (due to a large overlap of CIs).
Choice of acute and chronic time window
Figure 4 shows that the choice of an acute window significantly influences the ability of workload ratios to explain injury likelihood in matches and the days following. Moderate speed running ratios captured with acute time windows of 3 or 6 days and chronic time windows of 3 or 4 weeks were best able to explain injury likelihood. Injury models using previously reported parameters of 7-day acute and 28-day chronic distance loads12 explained less of the variance (mean R2=0.04–0.41) in this study population. We suggest that teams model their own data so that over a period of years they will find which ratio is most useful for them.
The structure of a professional Australian football season means that 3-day acute periods include the main training sessions prior to matches but never the previous match. Results highlighting 3-day acute time windows may reflect this specific structure. Similarly, 6-day acute windows will include the previous match when teams are scheduled for a short turnaround between matches but will not for longer breaks.
These observations suggest that it may be best practice to choose an acute time window that reflects the schedule of an athlete's competition and training when monitoring injury risk (ie, different windows may be optimal in sports with different schedules such as basketball, soccer or cricket).
Choice of workload variable
Moderate speed running was the workload variable that explained a quadratic variation in injury likelihood (R2=0.76–0.82) and discriminated between high-risk and low-risk athletes (RR=2.3–2.6). While parameter combinations using other workload variables were able to generate models with high R2 and RR, none appeared as consistently as moderate speed running. Thus, in professional Australian football, distance covered at a velocity of between 18 and 24 km/h is an appropriate choice of workload variable when using the acute:chronic workload ratio to monitor injury risk. This is potentially a consequence of the specific demands of the sport and physiological characteristics of competing athletes and alternative workload variables may be more suited to other sports.
Choice of injury lag period
Figures 3 and 4 show the differences between injury models for the likelihood of injury in: (1) matches, (2) matches and the following 2 days, and (3) matches and the following 5 days. Models showed similar ability to explain variation in injury likelihood (figure 3) and similar changes in performance when varying acute and chronic time windows (figure 4). This suggests that managing one choice of athlete workload ratio (using an appropriate acute and chronic time window) may be effective in reducing injury risk in matches and the days immediately following.
Limitations and extensions
The study considered injuries classified as non-contact and causing the athlete to be unavailable for training or competition. Injury data also contained more detailed subclassifications by type of pathology (muscle, tendon, bone, ligament or joint injury); however, an examination of injury risk within each subclass was beyond the scope of this study. A larger sample of injuries may enable future studies to examine the relationships between acute and chronic time windows, workload variables and different injury pathologies.
Australian football was the only sport considered in this study. The reported results may not generalise to other sports due to the differences in physical demands. Investigations into different choices of acute:chronic workload ratio parameters may lead to improved athlete monitoring tools in other sports.
Previous studies of training loads and injuries have reported that risk factors are impacted by chronic loads12 as well as variables such as player age and experience.5 Different modelling techniques able to incorporate multiple risk factors were considered to be beyond the scope of this study. Future modelling attempts incorporating these factors may be able to improve on the predictive power of the injury models used in this study.
The analyses in this study compared the injury risk for athletes with acute:chronic workload ratios between 0.8 and 1.2 to those outside of this range. An extension considered beyond the scope of this study would be to compare the RR of approaching matches with a low workload ratio (underloading) versus a high workload ratio (overloading).
Conclusion
Daily acute:chronic workload ratios were able to explain the variation in non-contact injury likelihood in Australian football players. The 3:21 days moderate speed running ratio was the combination that performed best—it provided a better model fit than the commonly used 7:28 days ratio. The results suggested that the best choices of acute and chronic time windows may need to be identified sport by sport or team by team and it may depend on the specific structure of an athlete's competition and training schedule.
What are the findings?
The acute:chronic workload ratio, calculated on a daily basis, can explain variations in non-contact injury risk in Australian football players.
The ratio of moderate speed running loads in a 3-day or 6-day acute time window and a 21-day or 28-day chronic time window best explained injury risk in matches and the following 2–5 days. Including a forward looking injury lag period did not significantly improve the ability to explain variations in injury rates.
The size of an acute time window showed strong influence over the ability of the workload ratio to inform injury risk.
How might it impact on clinical practice in the future?
Daily monitoring of the acute:chronic workload ratio is a valid tool for injury risk management in Australian football.
The schedule of training and competition should be considered when choosing the size of acute and chronic monitoring periods.
References
Footnotes
Twitter Follow David Carey at @dlcarey88
Competing interests None declared.
Ethics approval La Trobe University Faculty of Health Sciences Human Ethics Committee (FHEC14/233).
Provenance and peer review Not commissioned; externally peer reviewed.