Article Text

Abstract
Objectives: To investigate the site, nature, cause, and severity of injuries in semi-professional rugby league players.
Methods: The incidence of injury was prospectively studied in one hundred and fifty six semi-professional rugby league players over two competitive seasons. All injuries sustained during matches and training sessions were recorded. Injury data were collected from a total of 137 matches and 148 training sessions. Information recorded included the date and time of injury, site, nature, cause, and severity of injury.
Results: During the two seasons, 1694 playing injuries and 559 training injuries were sustained. The match injury incidence was 824.7 per 1000 player-position game hours and training injury incidence was 45.3 per 1000 training hours. Over 20% of the total training (17.4 per 1000) and playing (168.0 per 1000) injuries sustained were to the thigh and calf. Muscular injuries (haematomas and strains) were the most common type of injury sustained during training (22.0 per 1000, 48.7%) and matches (271.7 per 1000, 32.9%). Playing injuries were most commonly sustained in tackles (382.2 per 1000, 46.3%), while overexertion was the most common cause of training injuries (15.5 per 1000, 34.4%). The majority of playing injuries were sustained in the first half of matches (1013.6 per 1000, 61.5% v 635.8 per 1000, 38.5%), whereas training injuries occurred more frequently in the latter stages of the training session (50.0 per 1000, 55.3% v 40.5 per 1000, 44.7%). Significantly more training injuries were sustained in the early half of the season, however, playing injuries occurred more frequently in the latter stages of the season.
Conclusions: These results suggest that changes in training and playing intensity impact significantly upon injury rates in semi-professional rugby league players. Further studies investigating the influence of training and playing intensity on injuries in rugby league are warranted.
- sub-elite
- skill
- intensity
- collision
- football
Statistics from Altmetric.com
Rugby league is an international collision sport played at amateur,1,2 semi-professional,3 and professional4 levels. The game is physically demanding requiring players to compete in a challenging contest involving frequent bouts of high intensity activity, such as, running, passing, sprinting, separated by short bouts of low intensity activity, such as walking, jogging.5 During the course of a match players are exposed to numerous physical collisions and tackles.6 As a result, musculoskeletal injuries are common.7
Several studies have documented the incidence of injury in amateur2,8 and professional9–11 rugby league, with professional players having 1.3–2.2-fold higher injury rates than amateur players. Not surprisingly, both amateur and professional rugby league injury studies have identified the tackle to be the most common cause of injury.2,9,11,12 While no significant differences have been reported between first and second half injuries for professional players,13 the majority (70.8%) of amateur rugby league injuries occur in the second half of matches, suggesting that fatigue, or a fatigue induced reduction in skill contributes to injuries in these athletes.8
Recent evidence has shown a progressive improvement in the physiological capacities of rugby league players as the playing level is increased.14 Semi-professional players have inferior muscular power, speed, and maximal aerobic power to professional players4,15 but superior physiological capacities to amateur players.16 The higher physiological capacities of semi-professional players in comparison to amateur players may suggest a lower susceptibility to fatigue related injuries. However, given the progressive improvement in physiological capacities14 and that injury rates are increased with higher playing intensity,9,11,17 one might also expect a progressive rise in the injury rates of amateur, semi-professional, and professional rugby league players. While the incidence of amateur and professional rugby league injuries has been documented, no study has investigated the incidence of injury in semi-professional rugby league players. With this in mind, the purpose of the present investigation was to document the incidence of injury in semi-professional rugby league players over two consecutive seasons.
METHODS
The incidence, site, nature, cause, and severity of training and playing injuries was prospectively studied in 156 semi-professional rugby league players over two consecutive seasons (2000 and 2001). The total number of registered players over this period was 77 and 79, respectively, with 39 players competing in both seasons. Each season lasted from December–September, with matches played from January–September. All players were registered with the same rugby league club, and were competing in the Gold Coast Group 18 semi-professional senior rugby league competition (New South Wales Country Rugby League, Australia). The New South Wales Country Rugby League governs competitions of a standard below the National Rugby League professional competition and the New South Wales Rugby League semi-professional competitions—for example, First Division, Metropolitan Cup, Jersey Flegg, SG Ball, and Matthews Cup—but above Second Division and amateur level competitions. Players were defined as “semi-professional” as they were receiving moderate remuneration to play rugby league, but were also relying on additional employment to generate income. The definition of a semi-professional player distinguished the subjects of the present study from amateur players, (who do not receive match payments), and professional players (who generate their entire income from their involvement in rugby league).2 The playing roster for each season included 57 players, with the remaining players relegated to the amateur team affiliated with the club. Depending on age and skill levels, players competed in one of three teams (First Grade, Second Grade, or Under 19). Second Grade and Under 19 teams consisted of a squad of twenty players while the First Grade team consisted of a squad of seventeen players.
Over the two competitive seasons, all injuries sustained to the total cohort of 156 players were recorded. Injury data were collected from 137 matches, which included all trial, fixture, and finals matches. All trial matches were 60 minutes in duration. Fixture and finals matches were either 60 minutes (Under 19), 70 minutes (Second Grade), or 80 minutes (First Grade) in duration. One finals match (Second Grade) required 2 × 10 minute “extra-time” periods (90 minutes in duration) due to level scores at the completion of regulation time.
In addition, each player participated in two organised field training sessions per week, with each training session lasting approximately 90 minutes in duration. Injury data were collected from a total of 148 training sessions, which included all preseason and in season training sessions that corresponded with preseason, fixture, and finals matches. All Under 19 players participated in 138 training sessions, which corresponded with preseason, fixture, and finals matches. All First Grade and Reserve Grade players participated in 148 training sessions, which corresponded with preseason, fixture, and finals matches.
Definition of injury
A single head trainer, employed by the club to provide injury prevention and management services, and skills and conditioning coaching, assessed all injuries. The head trainer held tertiary qualifications in exercise and sport science and was nationally accredited in injury prevention, assessment, and management. For the purpose of this study, an injury was defined as any pain or disability suffered by a player during a match or training session, and subsequently assessed by the head trainer during, or immediately following the match or training session.3,8 All injuries sustained during matches and training sessions were recorded using a standardised injury reporting form (fig 1).18 Where necessary, slight modifications were made to the injury reporting form to allow for potential differences in the cause of injury between matches and training sessions. To allow comparison among other studies,10,17 injuries were also classified according to the number of matches missed as a result of the injury. Injuries were classified as transient (no matches missed), minor (one match missed), moderate (two to four matches missed), and major (five or more matches missed).17
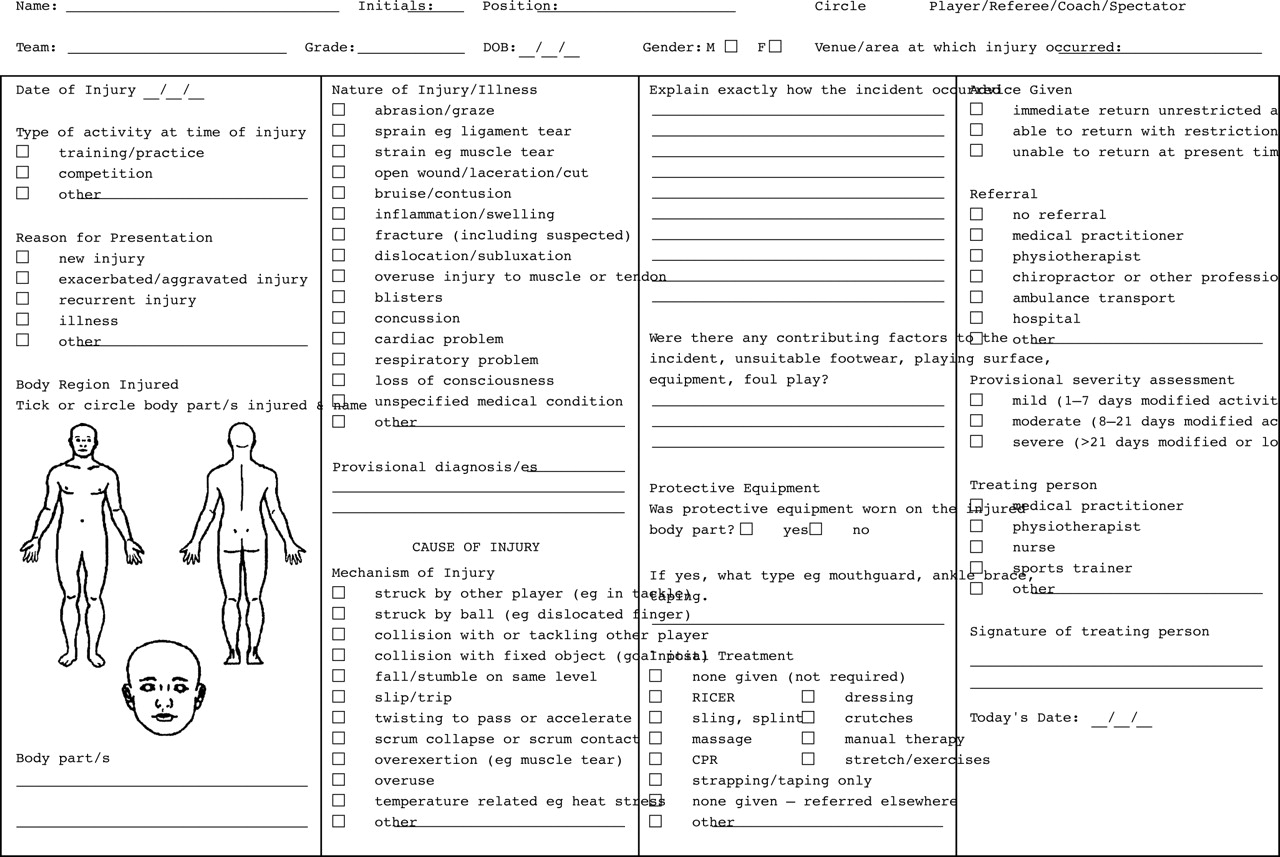
Injury reporting form.18
Classification of injury
Injuries were categorised according to the site of injury.3,8 The head and neck, face, abdomen and thorax, shoulder, arm and hand, thigh and calf, knee, ankle and foot, and “others” categories were the sites selected. Injuries were also described according to the type (nature) of injury sustained.3,8 Muscular injuries were classified as either haematomas or muscular strains. Additional categories for the type of injury included joint injuries, concussions, contusions, abrasions, blisters, lacerations, fractures and dislocations, respiratory disorders, unspecified medical conditions, and “others”. Finally, injuries were described according to the cause of injury.2,9 Causes of injury were categorised as being tackled, while tackling, being struck by another player or ball, collision with another player or fixed object (for example, goal post, ground), fall/stumble, slip/trip, twisting to pass or accelerate, scrum contact, overexertion, overuse, temperature related disorders (for example, heat stress), and “others”.
STATISTICS
Injury rates were calculated as described previously.17 Over the two competitive seasons, 137 matches were played. Fifty four matches lasted 60 minutes, 41 matches lasted 70 minutes, and 41 matches lasted 80 minutes in duration. One match lasted 90 minutes in duration. Therefore, the average duration of matches was 1.1533 hours. Match injury exposure was calculated by multiplying the number of players, the match duration, and the number of matches. The overall match injury exposure for all players was 2054 playing hours at risk (13 players × 1.1533 hours × 137 matches). Training injury exposure was calculated by multiplying the number of players, the number of training weeks, the session duration, and the number of sessions per week.10 The overall training injury exposure for all players was 12 354 training hours at risk (57 players × 69 weeks × 1.5 hours/session × 2 sessions/week) + (37 players × 5 weeks × 1.5 hours/session × 2 sessions/week). Expected injury rates were calculated as described by Hodgson Phillips et al.10 The χ2 test was used to determine whether the observed injury frequency was significantly different from the expected injury frequency (table 1). The level of significance was set at p<0.05.
Observed and expected training and match injury frequency
RESULTS
Playing injuries
Over the two competitive seasons, a total of 1694 playing injuries were recorded, with an overall incidence of injury of 824.7 (785.4 to 864.1) per 1000 player-position game hours. Significant differences were found between the 2000 (731.0 (678.6 to 783.4) per 1000) and 2001 (917.3 (858.8 to 975.7) per 1000) seasons for observed and expected playing injuries (χ2 = 21.8, df = 1, p<0.001). Over 20.0% (168.0 (150.2 to 185.7) per 1000) of the playing injuries sustained were to the thigh and calf. Injuries to the face (114.9 (100.2 to 129.6) per 1000, 13.9%), arm and hand (114.4 (99.8 to 129.0) per 1000, 13.9%), and knee (109.1 (94.7 to 123.4) per 1000, 13.2%) were less common. The incidence of injury was higher in forwards than backs (968.4 (905.7 to 1031.0) per 1000 v 701.6 (652.2 to 751.1) per 1000). Compared with backs, forwards had a higher incidence of injury for head and neck (104.4 (83.9 to 125.0) per 1000 v 60.6 (46.0 to 75.1) per 1000), facial (140.3 (116.5 to 164.1) per 1000 v 93.1 (75.1 to 111.2) per 1000), arm and hand (137.1 (113.6 to 160.7) per 1000 v 94.9 (76.7 to 113.2) per 1000), knee (134.0 (110.6 to 157.4) per 1000 v 87.7 (70.2 to 105.2) per 1000), and ankle and foot injuries (87.6 (68.8 to 106.3) per 1000 v 48.8 (35.7 to 61.9) per 1000) (fig 2).

Site of injury.
The nature of playing injuries sustained is shown in figure 3. Muscular injuries (haematomas and strains) were the most common type of playing injury (271.7 (249.1 to 294.2) per 1000, 32.9%), while contusions (166.5 (148.8 to 184.2) per 1000, 20.2%) and joint injuries (129.0 (113.4 to 144.6) per 1000, 15.6%) were less common. Compared with backs, forwards had a higher incidence of injury for contusions (207.8 (178.9 to 236.8) per 1000 v 131.1 (109.8 to 152.4) per 1000) and joint injuries (168.8 (142.5 to 195.0) per 1000 v 94.9 (76.7 to 113.2) per 1000).

Nature of injury.
The cause of playing injuries is shown in figure 4. The majority of injuries were sustained in tackles (382.2 (355.5 to 408.9) per 1000, 46.3%). In addition, physical collisions with fixed objects (90.1 (77.1 to 103.1) per 1000, 10.9%) and direct contact with another player (113.4 (98.8 to 128.0) per 1000, 13.8%) were also common causes of injury. Compared with backs, forwards sustained more injuries while tackling (201.5 (172.9 to 230.1) per 1000 v 132.9 (111.5 to 154.3) per 1000) and being tackled (263.7 (231.0 to 296.4) per 1000 v 178.1 (153.4 to 202.9) per 1000).
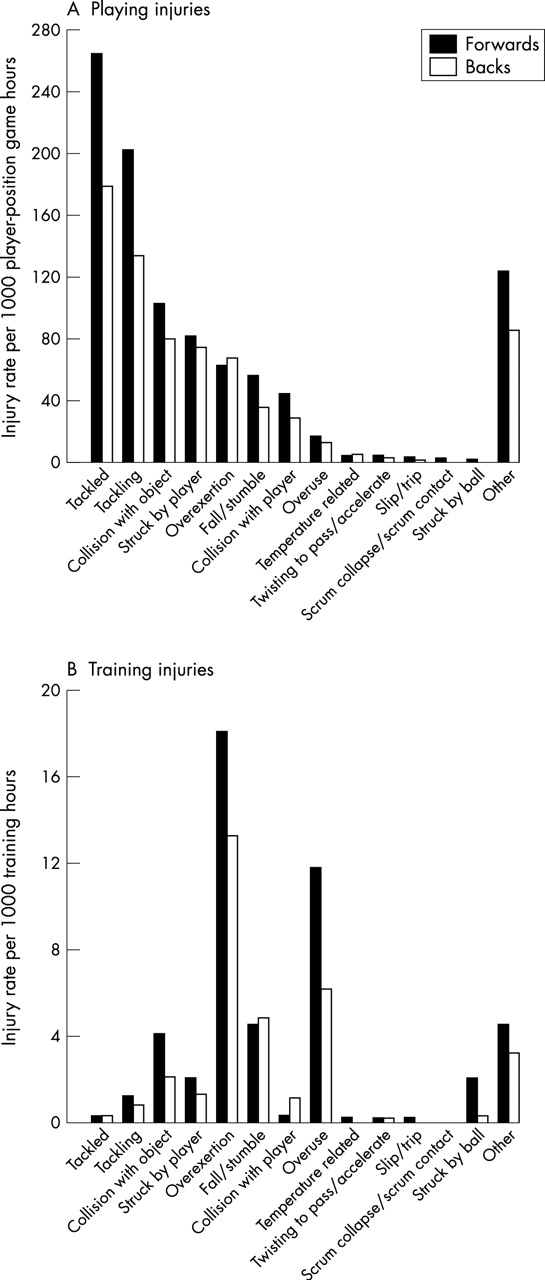
Cause of injury.
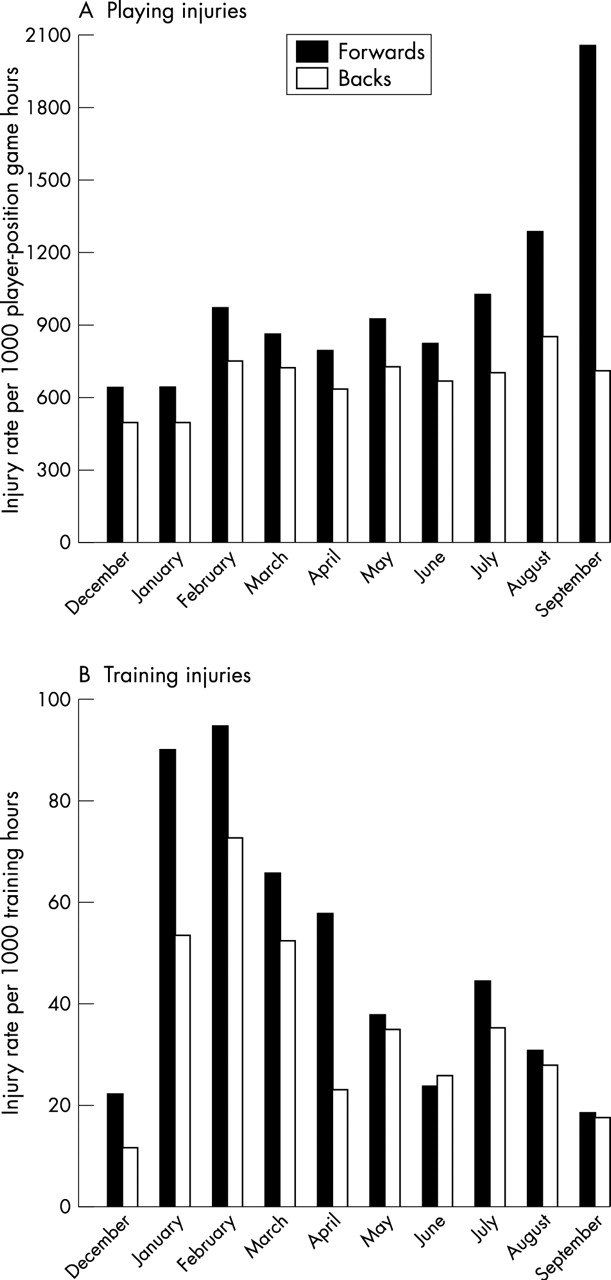
The incidence of playing injuries was significantly different throughout different months of the season (χ2 = 117.3, df = 8, p<0.001) (fig 5). At the beginning of the season (January) the incidence of playing injuries was 561.2 (297.1 to 825.4) per 1000 player-position game hours. Match injury rates progressively increased from January to September. The highest number of playing injuries sustained in a month was 311, recorded in July. Expressed relative to player-position game hours, the highest rate of playing injury was recorded in September, at the end of the season (1338.5 (1058.5 to 1618.5) per 1000). When injuries at the beginning and end of the season were compared (by dividing each season in half),10 it was found that more playing injuries occurred in the second half of the season (χ2 = 46.3, df = 1, p<0.001) (table 2). The majority of playing injuries were sustained in the first half of matches (1013.6 (952.0 to 1075.3) per 1000, 61.5% v 635.8 (587.0 to 684.7) per 1000, 38.5%, χ2 = 88.8, df = 1, p<0.001) (table 3).
Early and late season playing injuries in forwards and backs
First and second half playing injuries in forwards and backs
Month of injury.
Over 90% (757.1 (719.4 to 794.7) per 1000) of all playing injuries sustained were transient, resulting in no loss of playing time. Minor, moderate, and major playing injuries were less common. No significant differences were detected between forwards and backs for severity of playing injuries (table 4).
Severity of playing injury in forwards and backs
The incidence of playing injuries was higher in First Grade players (1055.3 (983.0 to 1127.6) per 1000) than Second Grade (695.5 (634.9 to 756.0) per 1000) and Under 19 players (670.3 (601.8 to 738.8) per 1000). There were no differences among First Grade (55.4 (38.8 to 72.0) per 1000, 30.9%), Second Grade (84.7 (63.5 to 105.9) per 1000, 44.6%), or Under 19 (62.3 (41.4 to 83.2) per 1000, 24.5%) players for matches missed as a result of a playing injury.
Training injuries
A total of 559 training injuries were recorded, with an overall incidence of injury of 45.3 (41.5 to 49.0) per 1000 training hours. Significant differences were found between the 2000 (29.1 (24.7 to 33.5) per 1000) and 2001 (59.7 (53.8 to 65.7) per 1000) seasons for observed and expected training injuries (χ2 = 63.5, df = 1, p<0.001). Over 35% (17.4 (15.1 to 19.7) per 1000) of the training injuries sustained were to the thigh and calf. Injuries to the ankle and foot (9.7 (8.0 to 11.5) per 1000, 21.5%), knee (5.4 (4.1 to 6.7) per 1000, 12.0%), and thorax and abdomen (5.3 (4.1 to 6.6) per 1000, 11.8%) were less common. The incidence of injury was higher in forwards than backs (52.7 (47.0 to 58.5) per 1000 v 38.0 (33.2 to 42.9) per 1000) (fig 2).
The nature of training injuries sustained is shown in figure 3. Muscular injuries were the most common type of training injury (22.0 (19.4 to 24.6) per 1000, 48.7%), while joint injuries (8.7 (7.0 to 10.3) per 1000, 19.1%) and contusions (4.4 (3.2 to 5.6) per 1000, 9.7%) were less common. Compared with backs, forwards had a higher incidence of injury for muscular strains (23.9 (20.0 to 27.8) per 1000 v 15.9 (12.8 to 19.0) per 1000).
The cause of training injuries is shown in figure 4. Overexertion was the most common cause of training injury (15.5 (13.3 to 17.7) per 1000, 34.4%). In contrast, the incidence of training injuries sustained while making direct contact with another player (9.2 (7.5 to 10.8) per 1000, 20.2%) or falling and stumbling (4.7 (3.5 to 5.9) per 1000, 10.4%) were less common. Compared with backs, forwards more commonly sustained overuse (11.7 (9.0 to 14.4) per 1000 v 6.1 (4.1 to 8.0) per 1000) injuries.
The incidence of training injuries was significantly different throughout different months of the season (χ2 = 121.5, df = 9, p<0.001) (fig 5). At the beginning of the season (December) the incidence of training injuries was 16.7 (9.4 to 24.1) per 1000 training hours. Training injury rates progressively increased from December to February, and then declined through to the end of the season. Expressed relative to training hours, the highest rate of training injury was recorded in February (83.9 (68.9 to 98.9) per 1000), at the beginning of the season. When injuries at the beginning and end of the season were compared (by dividing each season in half),10 it was found that more training injuries occurred in the first half of the season (χ2 = 15.5, df = 1, p<0.001) (table 5). Training injuries occurred more frequently in the latter stages of the training session (50.0 (44.4 to 55.6) per 1000, 55.3% v 40.5 (35.5 to 45.5) per 1000, 44.7%, χ2 = 6.3, df = 1, p<0.05) (table 6).
Early and late season training injuries in forwards and backs
Early and late session training injuries in forwards and backs
The majority (44.3 (40.6 to 48.0) per 1000, 97.9%) of training injuries were transient, resulting in no loss of playing time. Minor, moderate, and major training injuries were uncommon. Forwards sustained more transient and moderately severe training injuries than backs (table 7).
Severity of training injuries in forwards and backs
The incidence of training injuries was higher in First Grade players (74.6 (65.8 to 83.5) per 1000) than Second Grade (42.9 (36.8 to 49.1) per 1000) and Under 19 players (22.6 (18.1 to 27.1) per 1000). There were no differences among First Grade (0.3 (−0.3 to 0.8) per 1000, 8.3%), Second Grade (1.6 (0.4 to 2.8) per 1000, 58.3%), or Under 19 (0.9 (0.02 to 1.8) per 1000, 33.3%) players for matches missed as a result of a training injury.
DISCUSSION
The purpose of the present study was to document the incidence of injury in semi-professional rugby league players. The results of this study suggest that changes in training and playing intensity impact significantly upon injury rates in semi-professional rugby league players. Further studies investigating the influence of training and playing intensity on injuries in rugby league are warranted.
The present study of semi-professional rugby league players found an overall playing incidence of injury of 824.7 per 1000 player-position game hours, with First Grade players having the highest incidence of injury (1055.3 per 1000 player-position game hours). These injury rates are higher than previously reported for amateur (160.6 per 1000)8 and professional (346 per 1000)10 rugby league players using an identical definition of injury. In addition, playing injury rates were higher in the present cohort of First Grade, Second Grade, and Under 19 semi-professional players when expressed in terms of missed matches (67.7 per 1000), (when First Grade injuries alone were considered, the injury rate was 55.4 per 1000). Previous studies of Australian amateur2 and professional17 rugby league players that have defined injuries in terms of subsequent missed matches have reported injury rates of 26.8 and 44.9 per 1000 player-position game hours, respectively. Hodgson Phillips et al10 reported an injury incidence of 52.3 per 1000 player-position game hours in a First Grade squad of British professional rugby league players. Collectively, these results demonstrate that the incidence of injury in semi-professional rugby league is alarmingly high and that a considerable number of injuries are severe, resulting in a significant loss of playing time. The higher rates of injury in semi-professional players in comparison to amateur players may be expected given the superior physiological capacities of semi-professional rugby league players.14 Conceivably, the higher physiological capacities of semi-professional players would produce a higher playing intensity, resulting in higher injury rates.9,11,17 However, while player fitness (and subsequent playing intensity) is likely to be higher in semi-professional players, it is unlikely that the skill levels of semi-professional players are equivalent to professional players. The higher playing intensity, combined with an inferior skill level may offer some explanation for the higher injury rate in semi-professional players in comparison to professional players. Alternatively, the greater access to rehabilitation staff2 and the greater pressure to return to sport following injury, may explain the lower incidence of injury in professional players.
The finding that 17.3% of semi-professional rugby league injuries were major, resulting in five or more missed matches, is in agreement with a recent study conducted in Britain, which found that 15.6% of professional rugby league injuries were major.10 However, the severity of injury differs from the findings of Gabbett2 and Gibbs17 who reported a higher proportion of major injuries in Australian amateur (30%) and professional (27.7%) rugby league players, respectively. The definition of injury severity used in the present study is identical to other rugby league injury studies.2,10,17 Therefore, the reason for the marked differences in injury severity between competitions is unclear. However, a number of factors including, but not limited to, contrasting playing or coaching styles and/or playing frequency,19 may explain the differences in injury severity between amateur, semi-professional, and professional rugby league players.
Take home message
This study found a high incidence of injury in semi-professional rugby league players. Training injuries occur more frequently in the earlier stages of the season, while most playing injuries occur in the latter stages of the season. The intensity of training sessions and matches appears to influence injury rates in rugby league.
The present study found an increasing incidence of playing and training injuries over the two competitive seasons. The 2000 and 2001 rugby league seasons were very similar in terms of the length of season, number of matches, and length of off season. The players competing in the 2001 season had a higher estimated maximal aerobic power (50.1 (48.3 to 51.9) ml.kg−1.min−1 v 45.9 (44.1 to 47.7) ml.kg−1.min−1) and faster 10m (2.02 (1.96 to 2.08) s v 2.19 (2.13 to 2.25) s), 20m (3.34 (3.28 to 3.40) s v 3.50 (3.44 to 3.56) s), and 40m (5.78 (5.68 to 5.88) s v 6.04 (5.98 to 6.10) s) speed than players competing in the 2000 season. It is unclear if these differences in physiological capacities influenced the training and playing intensity (and therefore the observed and expected injuries) for the two seasons. However, the recent finding from Australian Rules footballers20 suggesting that the speed of matches may influence the recorded injury rate could offer some explanation for the higher injury rates between seasons.
The thigh and calf were the major sites injured during matches and training sessions. These findings differ from those of amateur8 and professional11 rugby league players that have reported the head and neck to be the most common sites of injury sustained in matches. The reason for the differences in injury sites between the present and previous studies is unclear but may reflect differences in defensive strategies at different levels of competition. Alternatively, the high rates of thigh and calf injuries may reflect changes from the traditional style of play to the modern game of rugby league. While off-season training programmes have typically emphasised aerobic fitness,21 more recently, training programmes have been centred around improving the strength, speed, and power of rugby league players.22,23 These findings do not discount the importance of aerobic fitness to obtaining optimum performance in rugby league players. However, it is possible that the large proportion of thigh and calf injuries in the present study reflects the progression towards a greater strength and power based modern game, with the risk of muscular injury increased as highly explosive power activities are introduced. An alternate explanation for the lower incidence of head and neck injuries in the present cohort of semi-professional rugby league players relative to professional players is that previous professional rugby league injury studies have included facial injuries as a head and neck injury.9,11 In the present study, when facial injuries were included in the head and neck injury classification, the incidence of head and neck injuries was 195.7 per 1000 player-position game hours, a value 16.5% higher than that reported for thigh and calf injuries. However, amateur rugby league injury studies have reported a high incidence of head and neck injuries even when facial injuries were classified separately.8 These results emphasise the need for a standardised method of injury classification for rugby league.
The most common playing injuries were contusions and muscular injuries (haematomas and strains), while joint injuries and muscular strains were more frequently sustained during training. The finding of high contusion and muscular injury rates is to be expected given the large number of physical collisions and tackles involved in a match.5,11,15 Optimum recovery following matches prevents excessive physical contact between players during training sessions. Therefore, the low incidence of contusions and haematomas sustained while training is also to be expected. However, successful rugby league players require the ability to rapidly accelerate, decelerate, and change direction.24 The higher rates of joint injuries and muscular strains sustained while training in the present study may therefore reflect an emphasis on game-specific speed, power, and agility conditioning drills.
Consistent with previous studies of amateur2 and professional9,11,12 rugby league players, the present study found that the majority of playing injuries occurred in tackles. In agreement with results from professional rugby league,9,11,12 the tackled player sustained more injuries than players effecting tackles. However, these results differ from amateur rugby league studies that have shown the defending player to sustain more injuries than attacking players.2 Greater emphasis on dominating the ruck, coupled with the introduction of the 10 m defensive rule (where opposing teams are separated by 10 m following a tackle), may explain the different causes of injury between semi-professional/professional players and amateur players. It is likely that the 10 m distance between teams allows attacking players to generate greater collision speeds, and therefore greater impact forces in tackles. Additionally, increased play-the-ball speed allows players to attack the defensive line before defending players are completely prepared. It is possible that the greater running distances required during match-play under the 10 m defensive rule25 would provide an additional challenge to defending amateur players, thereby reducing the likelihood of effective tackles, and increasing the risk of injury. The present results also highlight overexertion and overuse as the major causes of training injuries. These findings support the need for close monitoring of training intensity and training volume in rugby league players. In addition, better preparatory and recovery strategies and longer rest periods between training sessions and training activities may reduce the incidence of training injuries in semi-professional rugby league players.
The observation of higher injury rates in forwards than backs is consistent with previous findings from amateur8 and professional9,11,17 rugby league studies. In a three year study of amateur rugby league injuries, Gabbett8 reported that the overall incidence of injury was higher in forwards (52.4%) than backs (47.6%). Stephenson et al 11 also found similar differences in injury rates between professional forwards (56.3%) and backs (43.7%). In the present study, the forwards and backs received 54.2% and 45.8% of all injuries, respectively. Given that forwards spend a greater percentage of match play involved in tackling5 and physical collisions11,15 the finding of a lower incidence of injury in backs is to be expected. Additionally, given the importance of specificity in maximising training adaptations, the higher training injury rates in forwards (57.2% v 42.8%) suggests that training sessions were structured to cater for the specific skills and physiological demands of different playing positions.
The present study found higher injury rates in the first half of matches and the latter stages of training sessions. The finding of a higher injury incidence in the first half of matches in semi-professional players is in conflict with previous studies of amateur players that found that the majority of injuries occurred in the second half of matches.8 The lower second half injury rates highlight the importance of aerobic fitness in preventing fatigue related injuries in rugby league. Indeed, the present findings would be expected given the considerably higher aerobic fitness of semi-professional players in comparison to amateur players.14 However, while the higher aerobic fitness of semi-professional players appears to protect against fatigue related playing injuries, it is possible that the increased aerobic fitness may also have produced a higher playing intensity, particularly in the first half of matches. In addition, rugby league teams often integrate skills and conditioning sessions in order to facilitate the development of skills under fatigued conditions.26,27 The use of this training method may suggest that the developed skill levels of the present cohort of semi-professional rugby league players would be less likely to be attenuated under fatigue, leading to improved decision making and performance in the fatigued state. The finding of higher injury rates in the latter stages of training sessions suggest that fatigue may contribute to training injuries. However, given the low severity of training injuries and the benefits provided to players during competition, skills training performed under fatigued conditions appears to be justified.
The present study found higher playing injury rates at the end of the competitive season and higher training injury rates at the beginning of the season. Several studies have found higher injury rates at the beginning10,28 and end29 of a competitive season, suggesting that changes in training or playing intensity contribute to the early and late season injury incidence. The present findings suggest a higher playing intensity towards the end of the season. In addition, the higher training injury rates at the beginning of the season suggest that the physiological training demands imposed on players in the initial phases of the training program were higher than were tolerable for the musculoskeletal system. The volume of work performed during rugby league training sessions typically decreases as the season progresses, with a greater emphasis placed on the maintenance of fitness and skill levels developed during pre-season training.21 These results suggest that the training load imposed may significantly influence training injury rates in rugby league players. Clearly, further research is required to determine the influence of playing and training intensity on injuries in rugby league.
It is possible that the higher injury rates in semi-professional rugby league players in comparison to professional rugby league players is due to subtle variations in rules among seasons, differences in climatic or ground conditions,10 or differences between the Australian and British game.2 These findings suggest the need for a coordinated study that concurrently investigates the injury rates of amateur, semi-professional, and professional rugby league players in the major rugby league playing nations (namely Australia and Great Britain). Based on previous studies of amateur rugby league players,8 it is apparent that fatigue decreases skill levels and increases injury rates. However, given the higher incidence of injury in the present study when playing intensity would be expected to be higher, fatigue could potentially have a protective effect against injury. Conceivably, fatigue may decrease intensity and decrease injury rates. Therefore, future studies of amateur, semi-professional, and professional rugby league players should investigate the interaction of skill, intensity, and fatigue on the incidence of injury in these competitors. While acknowledging the obvious logistical challenges, such a study would provide a detailed analysis of injuries sustained at all levels of senior rugby league.
In summary, the present study documented the incidence of injury in semi-professional rugby league players. Our results suggest that changes in training and playing intensity impact significantly upon injury rates in semi-professional rugby league players. Further studies investigating the influence of training and playing intensity on injuries in rugby league are warranted.
REFERENCES
Commentary
An interesting paper at an opportune time, when sports research is shouting out for more epidemiological studies into incidence rates. Although the article is not original it has a sound experimental design and highlights an incidence rate in semi-professional rugby league that has never been reported before.
Professional rugby league has one of the highest incidences of injury ever reported in team sport and this study implies an even greater incidence for the semi-professional game. Differences in injury statistics exist which usually pertain to the methodology chosen. It is excellent to finally see so many studies produced which adjust for exposure.
This study reports an incidence of 67.7 per 1000 hours for game injuries requiring a game to be missed. Recently published and unpublished work in the professional British game show an incidence of 53.9 and 56.3 per 1000 for summer rugby league.1,2 While the incidence in the semi-professional game is high it is a reflection of three teams (first, second, and U19 grade) while the professional studies currently report injury incidence pertaining to first grade only. Even though adjusted for exposure, studies containing youngsters will produce higher incidence rates as those aged 19 and under have been shown to host the highest frequency of injury.3,4 Therefore there may not be such a huge difference in the games, although professional players should be more skilled at tackling, be aerobically fitter and stronger, and therefore should be at less of a risk of sustaining an injury which may be an explanation. However the conclusion of the authors is valid, more research needs to be conducted to investigate injury incidence in and across sports. So lets keep them coming in!