Article Text

Abstract
Objectives: To compare the safety policies and practices reported to be adopted during training and competition by community sports clubs in northern Sydney, Australia.
Methods: This cross sectional study involved face to face interviews, using an 81 item extensively validated questionnaire, with representatives of 163 community netball, rugby league, rugby union, and soccer clubs (response rate 85%). The study was undertaken during the winter sports season of 2000. Two separate 14 item scales were developed to analyse the level of safety policy adoption and safety practice implementation during training and competition. The statistical analysis comprised descriptive and inferential analysis stratified by sport.
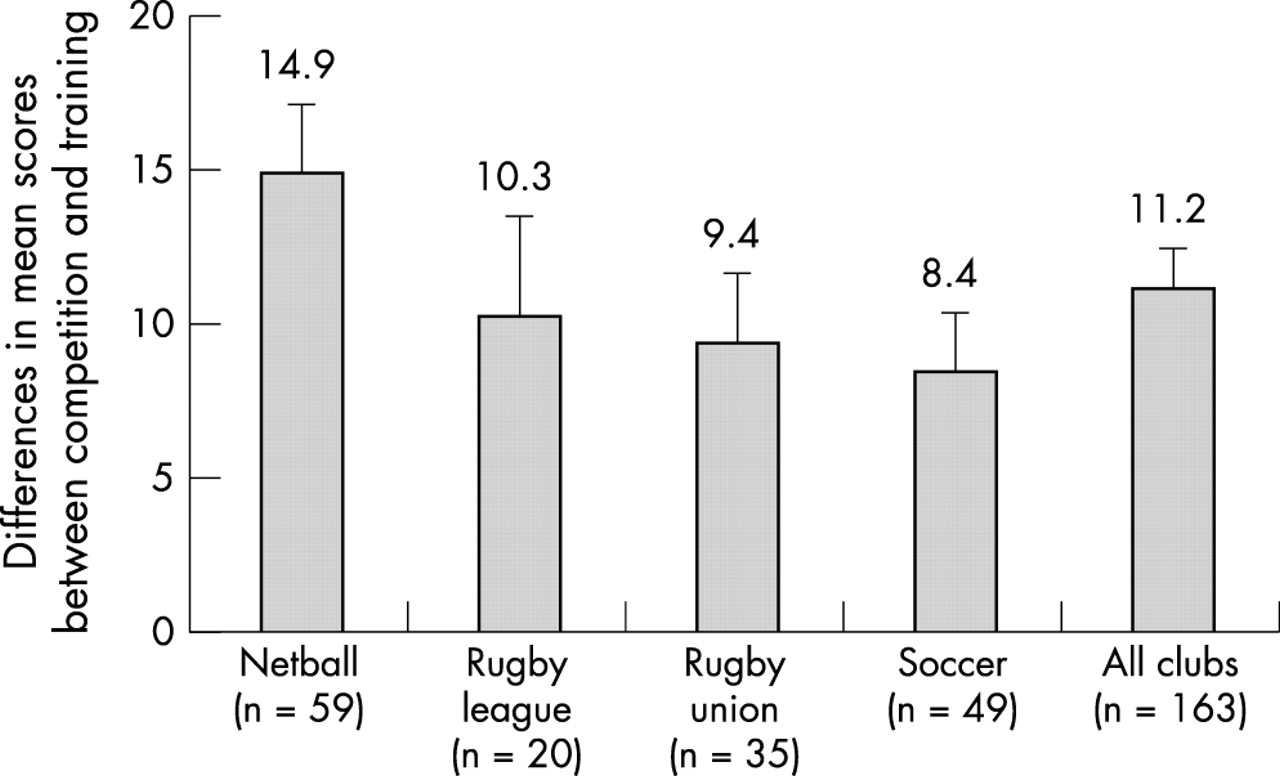
Results: The reliability of the scales was good: Cronbach’s α = 0.70 (competition scale) to 0.81 (training scale). Significant differences were found between the safety scores for training and competition for all clubs (mean difference 11.2; 95% confidence interval (CI) 10.0 to 12.5) and for each of the four sports: netball (mean difference 14.9; 95% CI 12.6 to 17.2); rugby league (mean difference 10.3; 95% CI 7.1 to 13.6); rugby union (mean difference 9.4; 95% CI 7.1 to 11.7); and soccer (mean difference 8.4; 95% CI 6.5 to 10.3).
Conclusions: The differences in the mean competition and training safety scores were significant for all sports. This indicates that safety policies were less often adopted and practices less often implemented during training than during competition. As injuries do occur at training, and sports participants often spend considerably more time training than competing, sporting bodies should consider whether the safety policies and practices adopted and implemented at training are adequate.
- safety
- community sports clubs
- injury prevention
- training
- competition
Statistics from Altmetric.com
Sports injuries are an important public health issue and a key reason for non-participation in physical activity internationally and in Australia.1–7 Sports injuries are a significant cost burden for injured participants and the broader community.2,8 One in 17 Australians experience some form of sports related injury every year, and the costs of those injuries have been estimated at one billion Australian dollars a year.2 It has been estimated that 70% of the participants in popular, winter, community level sports in Australia sustain one or more injuries over a two season period.5
Several sports injury countermeasures have been described and recommended in the Australian National Sports Safety Framework, including the application of risk management concepts to sports safety.6 Manuals and guidelines have been produced to assist sporting organisations to adopt a risk management approach to sports injury prevention.9,10 However, little is known about the extent to which community sports clubs adopt safety policies or implement safety practices.11,12
Injuries occur during both competition/matches and training/practice. However, many studies do not report injury risk during training. Between 46% (elite soccer) and 99% (elite rugby union) of injuries may occur during matches/competition and between 1% (elite rugby union) and 39% (various competition levels of soccer) may occur during training, depending on the sport, the standard of competition, and the definition of injury used in the study.13–15
The rate ratio for injuries in competition versus training has been reported to be as high as 8.3 for club rugby union players in New Zealand16 and as low as 1.3 for elite outdoor soccer players in Finland.17 No information is available in the literature about the rate ratio for injuries in competition versus training for netball players.
The purpose of this paper is to compare the reported safety policies and practices of four community sporting codes in Australia during training and competition. This is the first time such a study has been reported, and it provides an opportunity to consider the safety policies and practices adopted and implemented during training and competition in the context of the risk of injury in each setting.
METHODS
Representative samples of community sports clubs participating in netball (n = 59), rugby league (n = 20), rugby union (n = 35), and soccer (n = 49) were included in this study. A representative, usually a president or secretary, from each club completed an 81 item questionnaire developed specifically for use with community sporting organisations.11 The study was conducted during the 2000 winter sports season.
The questionnaire was based on the National Sports Safety Framework6 and a previously used questionnaire.12 Questionnaires were completed during a face to face interview. Validity and reliability of the questionnaire, including interrater reliability, test-retest reliability, content validity, and face validity, were confirmed using several methods in a pilot study.11
Items in the questionnaire explored whether clubs had adopted specific policies (attendance of qualified first aid personnel; inspection of playing surfaces; wearing or use of protective equipment) and the frequency with which clubs implemented specific safety practices (availability of first aid equipment; attendance of qualified first aid and cardiopulmonary resuscitation personnel; access to a telephone; access for emergency vehicles; inspection of playing surfaces; checking of fixtures and fittings; availability of drinking fluids and encouragement to drink at regular intervals; and warming up and cooling down) at training and competition.
Two separate 14 item scales were created to generate a safety score for training and competition for each club. Scale scores were based on two points for having a written policy, one point for having an unwritten policy, one point for implementing a safety practice sometimes (25%), two points for implementing a safety practice half the time (50%), three points for implementing a safety practice most of the time (75%), and four points for implementing a safety practice all the time (100%). Each scale had a maximum possible score of 50, and a higher score indicates greater attention to safety policies and practices. The interim covariance matrix and Cronbach’s α were used to measure the internal consistency of the scales.18 This is important because this type of reliability analysis estimates the consistency of different questions intended to measure the same construct.18
Statistical analyses included descriptive statistics and t tests for paired samples. Statistical analyses were conducted in Stata version 6.19 The differences between mean safety scores at training and competition were calculated by subtracting the mean training safety score from the mean competition safety score for each sport. To determine if these differences were significantly different from zero, 95% confidence intervals (CI) were calculated.
All subjects gave written informed consent to participate in the study. Ethical approval for the research was obtained from the human research ethics committees of Manly Hospital and Community Health Services, Hornsby, Ryde and Macquarie Hospitals, and Deakin University. Questionnaires were coded to ensure that the identity of individual respondents and the clubs they represented remained confidential.
RESULTS
A total of 163 respondents, representing 85% of the community sports clubs in the four codes located within the geographical boundaries for the study, were included in the sample. The response rate varied by sport: rugby union, 78%; rugby league, 80%; netball, 86%; soccer, 92%.
The mean safety score across all clubs (n = 163) for training was 27.8 (range 0–47) and for competition was 39.0 (range 20–50). Cronbach’s α was 0.81 for the training scale and 0.70 for the competition scale. For applied studies involving comparisons between groups, most researchers agree that reliability scores above 0.70 are quite acceptable.18,19 The difference between the mean competition safety score and the mean training safety score across all clubs was 11.2 (95% CI 10.0 to 12.5), indicating that this was significantly different from zero.
Table 1 gives the mean competition and training safety scores for each item on the two scales for each sport and for all clubs. It also gives the total mean competition and training safety scores for each sport and for all clubs. The 59 netball clubs had a mean competition safety score of 41.4 (95% CI 40.2 to 42.6) and a mean training safety score of 26.5 (95% CI 23.8 to 29.2). The 20 rugby league clubs had a mean competition safety score of 42.6 (95% CI 40.0 to 45.2) and a mean training safety score of 32.3 (95% CI 28.4 to 36.2). The 35 rugby union clubs had a mean competition safety score of 40.2 (95% CI 38.5 to 41.9) and a mean training safety score of 30.8 (95% CI 28.3 to 33.3). The 49 soccer clubs had a mean competition safety score of 34.0 (95% CI 32.5 to 35.5) and a mean training safety score of 25.6 (95% CI 23.1 to 27.9).
Mean safety scores for individual scale items for each sport and for all clubs
Figure 1 shows significant differences between the mean competition safety scores and the mean training safety scores for each sport. Netball clubs had a difference of 14.9 between the mean competition safety score and the mean training safety score; rugby league clubs had a difference of 10.3, rugby union clubs had a difference of 9.4, and soccer clubs had a difference of 8.4.
Difference in mean safety scores between competition and training by sport (with 95% confidence intervals).
DISCUSSION
In contrast with other epidemiological studies which have focused on the proportion and incidence rates of sports injuries sustained in competition and training, this study has compared the safety policies adopted and practices implemented by community sports clubs in these two settings. There is a clear significant difference in the attention given to safety between training and competition. The community sports clubs involved in the four sporting codes included all adopted safety policies and implemented safety practices less often at training than during competitions.
There are a number of reasons why safety receives less attention at training. For instance, the community sports clubs included in this study have probably had less experience of injuries at training, as injuries are less common in this setting.2,13–17,20–26 However, the reported proportion of injuries sustained during training and the relative rates of injury at training compared with competition vary widely.2,13–17,20–26 In some sports, including soccer,20 the risk of injury is three or four times lower during training than during competition. However, in other sports, such as volleyball, martial arts, and club gymnastics, the injury incidence rates during training are higher than during competitions.26 Notwithstanding these variations, injuries do occur during training, and sports bodies should not assume a negligible risk of injury during such activities.
It should be noted that sports participants usually spend anywhere from two to five times as much time training for their sport as they do competing.5,13,15,16,21,27 Therefore, if the injury incidence rate at competition is three times the injury incidence rate at training, as it has been reported to be in soccer,20 and participants train three times as often as they take part in competitions, then the relative risk of injury at training is similar to the relative risk of injury during competition in any given time period—for example, a playing career, season, or week.
The activities undertaken at training are generally different from those undertaken during competition, both in nature and intensity. The objective of training is often to develop fitness, skills, and game strategies, at less than full pace, with little or no opposition and limited body contact. Conversely, competition is usually conducted at full pace, with opposition and body contact allowed within the rules of the game. This is particularly relevant to rugby union, rugby league, and soccer where most injuries are sustained during physical contact.14–16,21,22,26
Another reason why community clubs give less attention to safety at training than at matches may be that the international, national, and regional governing bodies for most sports have mandatory safety policies for governing body sanctioned competitions. It is less common for governing bodies to have safety policies related to training. In this study for example, the mean scores for the items on safety policies at competition (usually the responsibility of governing bodies) were at least twice the score for the corresponding item at training (the responsibility of individual clubs) for all four sports.
It should also be noted that regional associations, either directly or through a proxy such as an umpire or referee, often implement safety practices during competitions, while individual clubs are generally responsible for safety practices at training. For example, netball competitions in Australia are often organised at a central venue, and the relevant regional association ensures that a qualified first aid provider is in attendance, that courts are inspected for hazards before they are used, and that emergency vehicle access is kept clear during competitions. In this study, the mean safety score for the attendance of qualified first aid providers at competition among netball clubs (the responsibility of the regional association) was 3.8 compared with 1.1 for the corresponding item at training (responsibility of individual clubs).
In the case of soccer, the referee usually checks that all players are wearing shin protectors and appropriate footwear, and inspects the playing surface and fixtures (goals, corner flags, etc) before the start of a competition. However, referees do not attend club training sessions, and it is unlikely that such safety practices are as comprehensively implemented at training.
Community sports clubs in Australia rely heavily on volunteers to implement safety procedures. It is likely that clubs would find it more difficult to recruit volunteers to attend training than to attend matches. It is also likely that safety equipment, such as first aid equipment and protective equipment (goal post padding, etc), is less accessible at training. For example, the first aid kit may be kept and maintained by the first aid provider, who only attends matches.
There are a number of limitations to be considered when interpreting the findings of this study. The sample for the survey was drawn from a limited geographical region and a small number of sports. Any generalisation to the broader sporting community cannot be made without considering the possible differences—social, demographic, economic, geographic, organisational, etc—between the sample population and the groups to which these results are generalised. Nonetheless, there is no reason to believe that the clubs included in this study are very different from other community sporting clubs in Australia.
The findings of this study are based on self reporting by representatives of community sports clubs about the sports safety policies and practices at their club. Therefore there is some potential for reporting bias—because of respondents’ interpretations of the questions or desire to report the situation in their club in a certain way—and recall bias—because of inaccuracies of recall. Furthermore, some club representatives were reporting on policies that were developed and implemented at the association level, and their knowledge of the nature of such policies may have been limited. Only one person represented each club that participated in the study. Therefore the information gathered about each club may be limited by that particular person’s knowledge. The club president or secretary was the preferred representative, as the pilot study for this research indicated that this would maximise the potential for obtaining useful information.11
The Cronbach’s α coefficients for the scales reported in this paper indicate good internal consistency (reliability). Correlation coefficients are used to estimate the degree of equivalence between answers.18,19 The lower coefficient for the competition scale suggests that this summary scale is not as good as the training summary scale. In general, the α coefficients were sufficiently high for exploratory research such as that reported in this paper.18,19
The most important finding of this study is that there is a significant difference in the reported safety policies adopted and practices implemented between training and competition in popular, community level, winter sports clubs. It remains to be ascertained why such a difference occurs. What is now required is some debate about the practical significance of such a difference, with serious consideration given to the question of whether the differences in safety polices and practices between training and competition are commensurate with the differences in risk of injury in each context. This is particularly relevant given the fact that most sports participants spend considerably more time involved in training than competition. It is also important that the barriers to adopting safety policies and implementing safety practices during training and competition are further explored and practical solutions developed to overcome them.