Article Text

Abstract
Introduction: In this study we examined the pacing strategy and the end muscle glycogen contents in eight cyclists, once when they were carbohydrate loaded and once when they were non-loaded.
Methods: Cyclists completed 2 hours of cycling at ∼73% of maximum oxygen consumption, which included five sprints at 100% of peak sustained power output every 20 minutes, followed immediately by a 1 hour time trial. Muscle biopsies were performed before and immediately after exercise, while blood samples were taken during the 2 hour steady state rides and immediately after exercise.
Results: Carbohydrate loading improved mean power output during the 1 hour time trial (mean (SEM) 219 (17) v 233 (15) W; p<0.05) and enabled subjects to use significantly more muscle glycogen than during the trial following their normal diet. Significantly, the subjects, kept blind to all feedback except for time, started both time trials at similar workloads (∼30 W), but after 1 minute of cycling, the workload average 14 W higher throughout the loaded compared with the non-loaded time trial. There were no differences in subjects’ plasma glucose and lactate concentrations and heart rates in the carbohydrate loaded versus the non-loaded trial. Of the eight subjects, seven improved their time trial performance after carbohydrate loading. Finishing muscle glycogen concentrations in these seven subjects were remarkably similar in both trials (18 (3) v 20 (3) mmol/kg w/w), despite significantly different starting values and time trial performances (36.55 (1.47) v 38.14 (1.27) km/h; p<0.05). The intra-subject coefficient of variation (CV) for end glycogen content in these seven subjects was 10%, compared with an inter-subject CV of 43%.
Conclusions: As seven subjects completed the time trials with the same end exercise muscle glycogen concentrations, diet induced changes in pacing strategies during the time trials in these subjects may have resulted from integrated feedback from the periphery, perhaps from glycogen content in exercising muscles.
- CLD, carbohydrate loaded diet
- CV, coefficient of variation
- HR, heart rate
- ND, normal diet
- afferent feedback
- time trial
- endpoint muscle glycogen
- CNS
- carbohydrate loading
Statistics from Altmetric.com
Since the original classical studies,1–4 it has been accepted that muscle glycogen depletion explains the fatigue that develops in fed subjects who exercise to exhaustion at moderate to high exercise intensities for prolonged periods. According to this model, the larger the initial muscle glycogen stores, the longer subjects are able to exercise at a specific workload, because those greater stores will sustain more activity until the critically low concentrations at which fatigue develops are reached.
Three other facts have become established by this research. Firstly, there is a large inter-subject variability (30–71%) in muscle glycogen content at exhaustion and secondly, muscle glycogen concentrations never reach zero at exhaustion.1,5–7 Thus there may not be a single critical muscle glycogen concentration, equal for all individuals, at which fatigue develops. Thirdly, the pre-exercise muscle glycogen content is a local regulator of glycogenolysis so that the greater the initial muscle glycogen content, the greater the glycogenolytic rate.4,8,9,10 Indeed, the metabolic response to exercise appears to be determined largely by the starting muscle glycogen concentration. For example, Weltan et al11,12 showed that human subjects with low muscle glycogen concentrations at the start of exercise have increased rates of fat oxidation, even during experimentally induced hyperglycaemia. In contrast, the rate of fat metabolism by isolated perfused muscle is independent of the muscle glycogen concentration.13 Thus Weltan et al11 concluded that neural or hormonal factors distant from muscle determine the rate of skeletal muscle lipid oxidation in response to changing skeletal muscle glycogen concentrations during exercise. Furthermore, owing to the strikingly similar metabolic and hormonal responses during exercise in normal subjects with low muscle glycogen concentrations and in patients with glycogen phosphorylase deficiency (McArdle’s syndrome),14,15 Weltan et al11 postulated the existence of a direct metabolic signal from exercising muscle, the effect of which is to increase circulating norepinephrine (noradrenaline) and free fatty acid concentrations, and to decrease circulating insulin concentrations, thereby stimulating lipid oxidation when muscle glycogen concentrations fall.
Therefore, in this paper, we report additional evidence in support of the metabolic signal from exercising muscle proposed by Weltan et al11. In a re-analysis of our previously published study,16 in which subjects completed two laboratory based cycling time trials in random order, once while carbohydrate loaded, the other after eating a normal diet, so that they began exercise with different muscle glycogen concentrations, we found that seven of the eight subjects ended both their exercise bouts with remarkably similar muscle glycogen concentrations. Based on these findings, we hypothesise that muscle glycogen may also have a signalling function that influences the pacing strategy adopted during prolonged exercise on a continual basis. Furthermore, we show that the muscle glycogen concentration that activates or initiates the putative “endpoint” signal, and which subjects paced themselves to reach at the end of the TT, is remarkably consistent within individual subjects.
METHODS
Subjects and preliminary testing
Eight well trained male endurance cyclists participated in this study the details of which have been reported previously.16 This study was approved by the research and ethics committee of the Faculty of Health Sciences, University of Cape Town. In brief, the subject characteristics (mean (SEM)) were: age 22.4 (0.6) years; mass 71.3 (1.4) kg; VO2peak 4.72 (0.15) l/min or 66.3 (1.3) ml/kg/min; peak sustained power output (Wpeak) 376 (12) W and peak heart rates (HR) of 191 (2) beats/min. The Wpeak, VO2peak and peak HR values were determined during an incremental cycle to exhaustion on an electronically braked cyclergometer (Lode, Gronigen, the Netherlands), according to our standard protocol.17
Experimental trials
All subjects completed two experimental trials in random order, separated by a minimum of 4 days, during which they either ingested their normal diet (ND) or a carbohydrate loaded diet (CLD) for 3 days prior to exercise testing. On the morning of the trials, subjects came to the laboratory 3 hours after a standardised breakfast that was similar in content and composition to that which they would normally ingest before competition (70–80 g of carbohydrate). The experimental trials consisted of a 2 hour cycle at 65% of Wpeak (244 (8) W; ∼73% of VO2peak), interspersed with five 60 second sprints at the subjects’ Wpeak (376 (12) W), after 20, 40, 60, 80, and 100 minutes (fig 1). Subjects were allowed a recovery spin for 1 minute at 0 W after each sprint. Immediately after this ride, the subjects transferred (within 60 seconds) from the Lode ergometer to their own bicycles attached to a Kingcycle cycle simulator (KingCycle Ltd, High Wycombe, Buckinghamshire, UK) and maintained as high an exercise intensity as possible for 1 hour. During the time trial subjects were informed only of the elapsed time; they received no information about the distance covered, speed attained, or heart rate achieved during the ride.

Subject power output values during the full 3 hours of exercise (○, ND trial; •, CLD trial).
In order to prevent the development of hypoglycaemia or dehydration, subjects ingested 600 ml of a 10% glucose polymer solution (60 g carbohydrate/hour) during the first 2 hours of both trials, but only water, ad libitum, during the 1 hour time trials.
Muscle biopsies of the vastus lataralis were taken before the start of exercise and again on completion of the time trial, and these muscle samples were immediately frozen in liquid nitrogen.
Sample analysis
Venous blood samples were collected into ice cold tubes containing potassium oxalate and sodium fluoride at rest, at 30 minute intervals during the 2 hour ride and at the end of the time trial. After the trial, the blood samples were centrifuged for 10 minutes at 390 g in a refrigerated centrifuge (0°C), and the supernatant was stored at −20°C for subsequent analyses of plasma glucose and lactate concentrations. Plasma glucose concentrations were measured with an automated glucose analyser (Beckman Glucose Analyzer 2, Fullerton, CA, USA), using the glucose oxidase assay.18 Plasma lactate concentrations were measured with a standard enzymatic spectrophotometric technique.19 Muscle glycogen content in the frozen muscle samples was determined in duplicate by the method of Passoneau and Lauderdale.20 The coefficient of variation was 6% for duplicate glycogen assays of a single piece of muscle and <9% for assays of the glycogen content of three separate pieces of the same muscle biopsy.
Statistical analysis
All results are expressed as means (SEM). The statistical differences between pre-trial and post-trial muscle glycogen concentrations, power output, and distance achieved during the 1 hour performance ride were assessed with a paired Student’s t test. Plasma glucose and lactate concentrations were analysed with a two way analysis of variance with repeated measures. A post hoc test was not necessary as there were no significant differences. An alpha level of <0.05 was regarded as significant.
RESULTS
Figs 1 and 2 display all eight subjects’ average power outputs and heart rates achieved throughout the two 3 hour exercise trials, while fig 3 shows only the average power outputs maintained during the 60 min time trials. The mean (SEM) power output (219 (17) v 233 (15) W, p<0.05; fig 3) and speed (36.74 (1.29) v 38.02 (1.10) km/h, p<0.05; data not shown) attained during the time trials were significantly higher in the CLD trial than in the ND trial.

Percentage of peak heart rate of subjects during the full 3 hours of exercise (○, ND trial; •, CLD trial).
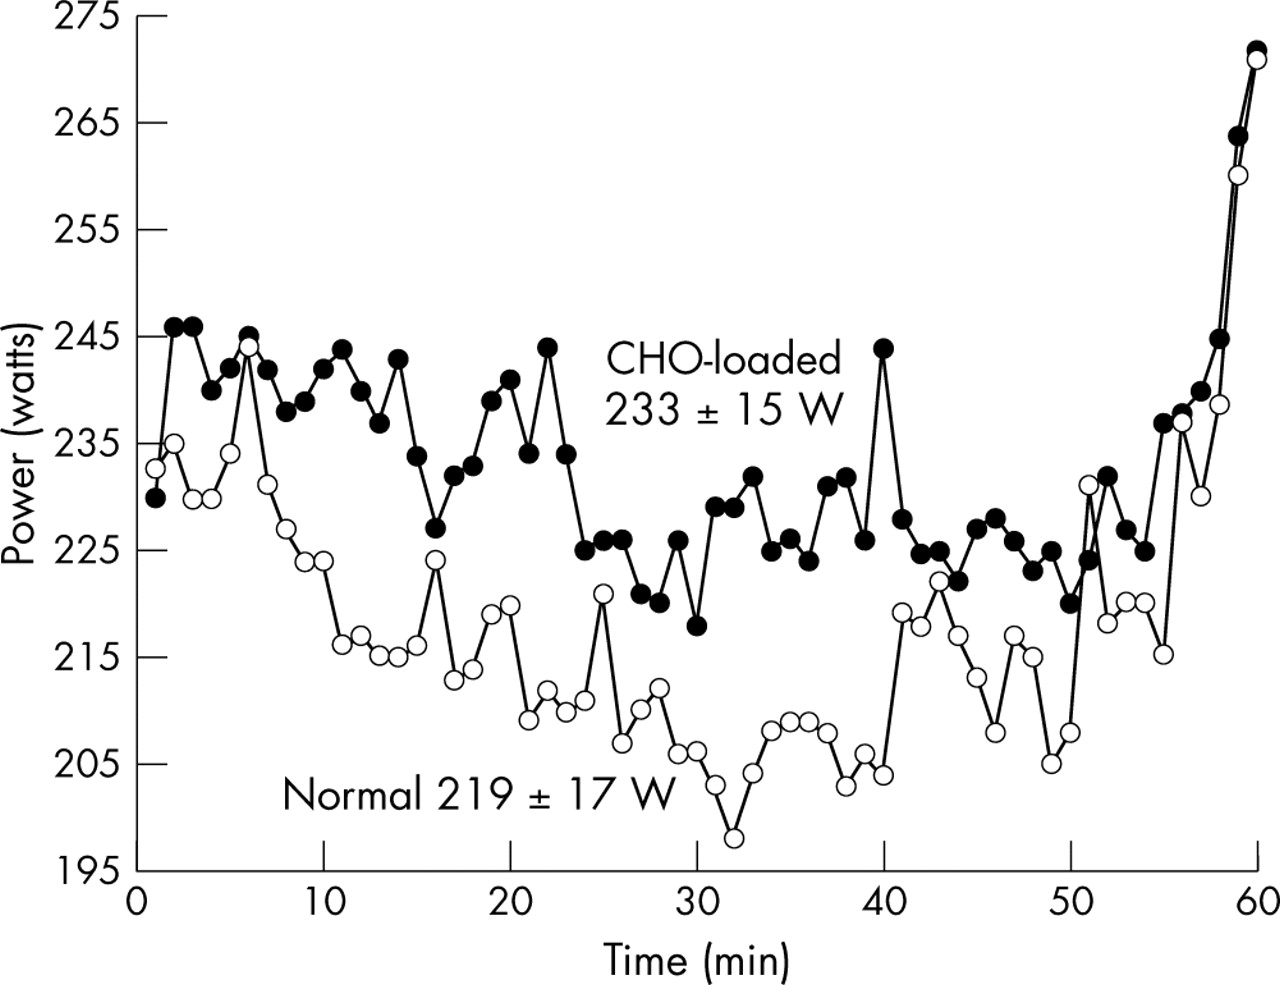
Average power output for subjects during the 1 hour time trials. The power output during the CLD time trial was significantly greater than the power output during the ND time trial (p<0.05; ○, ND trial; •, CLD trial).
A closer inspection of fig 3 revealed the following findings. Whereas the average power output was higher during the CLD time trial, this pattern was already set within the first 120 seconds of starting the 1 hour time trial. After 5–10 minutes of the time trial, heart rate (fig 2) remained relatively constant, whereas power output fell, progressively reaching the lowest value during the different trials at 32 minutes in the ND, and at 35 minutes in the CLD time trial. Thereafter power output oscillated at increasingly high values until 56 minutes into the ND and 55 minutes into the CLD time trial, whereafter they increased steeply, reaching the highest power outputs between minutes 58 and 60, at the end of the time trial.
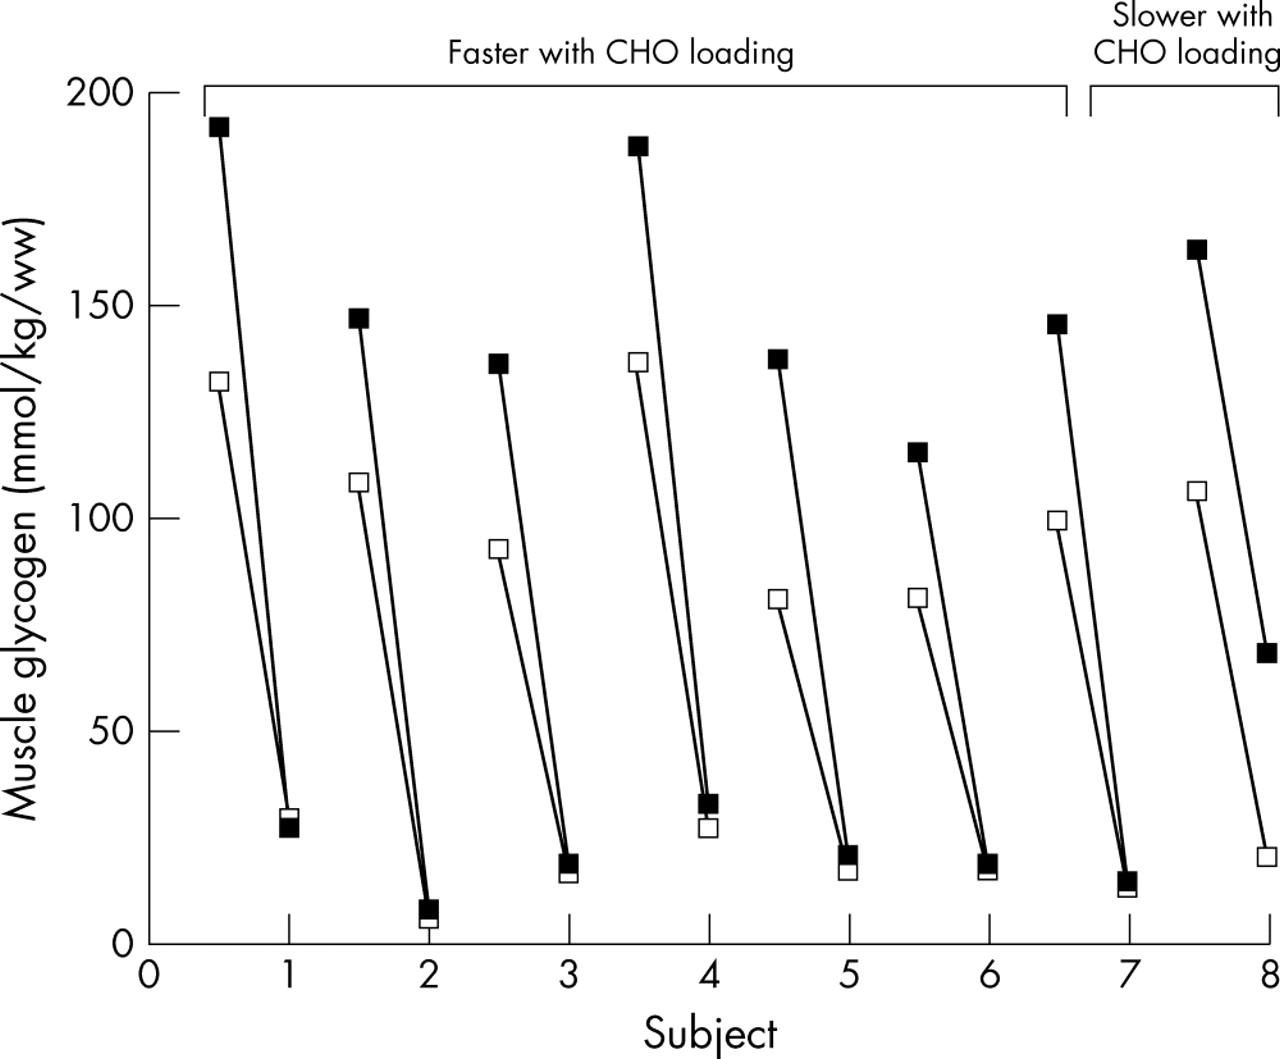
Seven of the eight subjects rode faster in the time trial after carbohydrate loading. The CLD increased the muscle glycogen contents of these seven subjects from 104 (11) to 151 (9) mmol/kg w/w, p<0.05 (fig 4). During the CLD trial, these seven subjects used all the additional muscle glycogen stored during the previous 3 days’ carbohydrate loading and finished the CLD trial with muscle glycogen contents remarkably similar to those at the end of their ND trial (20 (3) v 18 (3) mmol/kg w/w).
Separate pre-exercise and post-exercise muscle glycogen concentrations of all eight subjects over the 3 hours of exercise (open block, ND trial; filled block, CLD trial).
The similarity in the end muscle glycogen concentrations in individual subjects is striking (fig 4); the greatest difference in the end glycogen concentrations in the seven high performing subjects was only 6 mmol/kg w/w (subject 4; fig 4). In two subjects this difference was 1 mmol/kg; in two others it was 2 mmol/kg; and in a further two it was 3 mmol/kg.
The intra-subject coefficient of variability of these seven subjects was only 10%, compared with an inter-subject coefficient of variation of 43%. Furthermore, the coefficient of variation for assays of the glycogen content of three separate pieces of the same muscle biopsy was 9%, showing that the differences in end muscle glycogen contents between trials fell within the accuracy of our analyses techniques.
The one subject who did not improve his performance had similar pre-exercise muscle glycogen concentrations to those of the other seven subjects during both his trials (106 v 104 (11) and 163 v 151 (9) mmol/kg w/w). However, he used only 9 mmol/kg of his additional 57 mmol/kg starting muscle glycogen concentration during the CLD trial (fig 4). This subject finished the CLD trial with a much higher muscle glycogen concentration than after the ND trial (68 v 20 mmol/kg w/w; fig 4).
There were no significant differences between the plasma glucose and lactate concentrations during the CLD and ND trials. The plasma glucose concentrations for the ND and CLD trials at the end of the submaximal rides were 5.4 (0.3) and 5.5 (0.4) mmol/l, respectively, and the plasma lactate concentrations were 2.5 (0.4) and 2.8 (0.4) mmol/l, respectively (data not shown). Resting plasma lactate concentrations were 2.2 (0.4) and 2.1 (0.2) mmol/l for the ND and CLD trials respectively.
DISCUSSION
The first novel finding of the data analysed here was that seven out of eight subjects who started two performance based exercise bouts of the same duration, but with significantly different initial muscle glycogen concentrations, used all their additional muscle glycogen from carbohydrate loading and ended the exercise bouts with essentially identical muscle glycogen concentrations (18 (3) v 20 (3) mmol/kg w/w). The sole exception was one subject, who not only was unable to use more than 9 mmol/kg of his additional 57 mmol/kg starting muscle glycogen, but was also unable to improve his exercise performance after carbohydrate loading, suggesting that his performance may not have been maximum. These findings suggest that there is a critical muscle glycogen concentration that subjects paced themselves to reach at the termination of a self paced exercise bout, and that this critical concentration is different in each individual.
The second relevant finding was that subjects paced themselves at a lower workload throughout the ND than during the CLD time trial (average power 219 (17) v 233 (15) W, p<0.05; fig 1). Interestingly, the subjects started both time trials at almost the same workload (∼230 W), but after 1 minute of cycling the workload was ∼10 W higher and averaged 14 W higher throughout the CLD compared with the ND time trial. As the subjects had no visual feedback apart from the elapsed time, this suggests that they may have paced themselves according to internal physiological feedback, informing them of the maximum workrate that they would be able to sustain for 1 hour without developing premature fatigue. Remarkably, their initial change in pacing strategy was made between minutes 1 and 2 of the time trial.
Fig 3 also shows that subjects were continually adjusting their pacing strategies, dropping their power outputs slightly but noticeably during the first 30–35 minutes, and then maintaining or slightly increasing their power output until the last 5 minutes, when they significantly further increased their power outputs. Importantly, subjects were cycling at lower workloads during both time trials (219 (17) and 233 (15) W) compared with the workload they were instructed to cycle at during the initial 2 hours of exercise (244 (8) W), suggesting that the pacing strategy adopted during the final hour had been updated from novel information (or feedback) received after the first 2 hours of exercise. They may either have dropped their power outputs due to peripheral fatigue or they must somehow have ‘sensed’ that workrates of 244 (8) W could not be sustained for the whole 60 minutes. If their power outputs had decreased due to peripheral fatigue, this dropping off in power would have continued until exhaustion set in.
A number of metabolic and physiological variables, including heart rate, which remained relatively constant throughout the time trial (fig 2), might provide the information necessary to determine the pacing strategy during time trial exercise. In this regard, the subjects had similar plasma glucose (5.5 (0.4) and 5.4 (0.3) mmol/l) and lactate (2.5 (0.4) and 2.8 (0.4) mmol/l) concentrations at the end of the submaximal ride during the ND and CLD trials, respectively. As this trial specifically manipulated the muscle glycogen content, it is perhaps logical first to evaluate the possible role played by muscle glycogen in establishing the different pacing strategies.
The finding that muscle glycogen concentrations were essentially the same at the termination of exercise, regardless of the pre-exercise muscle glycogen concentrations, suggests that one goal of the pacing strategy adopted during prolonged exercise is to finish exercise with a specific muscle glycogen concentration. While the peripheral fatigue model interprets that this “critically low” muscle glycogen concentration directly causes a peripheral, metabolite induced fatigue resulting from the inability to generate ATP derived from glucose/glycogen sufficiently rapidly,21 our data disprove this theory. The finding that subjects decreased their power outputs after the 2 hour submaximal rides when they had ample muscle glycogen reserves, reaching the lowest recorded values between 30 and 32 minutes, and then increased their power outputs, reaching the highest recorded values during the final 1–2 minutes of the time trial (fig 3) when muscle glycogen concentrations must have been “critically low”, indicates that muscle power output was “constrained” for the first 58 minutes of the time trial by a centrally determined pacing strategy22–24 and not by a limiting muscle glycogen concentration, according to the more usual theory.
Therefore, if our theory is correct, it predicts that the higher power outputs sustained for the duration of the CLD time trial occurred because the brain was able to anticipate the rate of muscle glycogen utilisation, according to a continually updated metabolic calculation based on each individual’s own “critical” level of end point muscle glycogen; and could thus ‘afford’ an increase in skeletal muscle recruitment, thereby sustaining a higher workrate. In this regard, it has been shown by Conley et al25 that glycolytic flux is independent of oxygenation state and metabolic feedback (Pi and ADP), but proportional to muscle activation showing a key role for muscle activation (that is, central regulation) in the activation and maintenance of the rate of glycolysis/glycogenolysis.
One weakness to our argument is that the muscle glycogen concentrations were measured at the start of exercise, but not again immediately before the start of the time trial. Hence we can only assume that the concentrations were different at the start of the time trials following the different dietary interventions. Our previous studies performed at similar workrates (70% of VO2max) found that muscle glycogen concentrations were higher by about 50 mmol/kg w/w after 120 minutes of exercise in carbohydrate loaded subjects who began with higher muscle glycogen concentrations than those who had eaten a normal diet.8 Thus we have no reason to believe that the higher pre-exercise muscle glycogen concentrations in the CLD trial were not still higher than in the ND trial, also at the start of the 1 hour time trial.
What is already known on this topic
-
It has been accepted that muscle glycogen depletion explains the fatigue that develops in fed subjects who exercise to exhaustion
-
The existence of a metabolic signal, which stimulates lipid oxdiation when muscle glycogen concentrations fall, has been postulated
What this study adds
-
We have produced further evidence to support the idea of a metabolic signal from exercising muscle
-
We propose that a chemoreceptor in muscle is used by the CNS to calculate the optimum pacing strategy, and we have provisionally named this the “glycostat”
What is also remarkable is that end glycogen concentrations had as much as threefold difference between subjects, whereas intra-subject end glycogen concentrations showed very little variability, irrespective of whether subjects were loaded or non-loaded. This is suggestive of a metabolic signal that informs the individual at what point they should slow down or stop exercise to prevent the development of absolute substrate depletion.
In this regard, it is well known that group III and IV muscle afferents invoke circulatory and ventilatory reflexes during exercise26 and provide feedback from metabolic disturbances such as lactic acid production, hypoxia, and pain,27,28,30 and from mechanoreception.26,29 Craig31 has recently proposed that homeostatic feedback from type III and IV afferents synapse predominantly in spinal dorsal horn lamina I cells, from where it reaches the brainstem homeostatic nuclei via the spinothalamic tract. From brainstem nuclei, predominantly the parabrachial nucleus, the afferent information is relayed via the thalamus to the insular cortex. The combined interoceptive afferent information from the whole body is represented topographically in the insular cortex. Neural connections between the insular and prefrontal cortices31 allow decisionmaking processes regarding the viability of maintaining the intensity of the effort to be continuously upgraded.
Accordingly we propose the possibility that a chemoreceptor in muscle, perhaps nociceptors or lactic acid receptors,28 are also used by the central nervous system to calculate the optimum pacing strategy, based on the sensory awareness from the leg musculature, which will allow humans to complete exercise with a specific end exercise muscle glycogen concentration.
We have provisionally named this intramuscular monitor of the prevailing glycogen concentration and its rate of decline as the “glycostat”. Furthermore, the data presented here suggest that the individual muscle glycogen level is not absolute and is determined by very different prevailing glycogen concentrations. This variability in the end exercise muscle glycogen concentrations is probably due, in part, to differences in metabolic phenotype.32 Further research is needed to evaluate the veracity of this new hypothesis.
Acknowledgments
We acknowledge the excellent technical assistance of G Wilson and J Belonje in their analyses of the muscle and blood samples. We further acknowledge I Rodger for his help in recruiting cyclists of the right calibre for this study.
REFERENCES
Footnotes
-
Conflict of interests: none declared
-
We declare that these experiments comply with the current laws of the Republic of South Africa.