Article Text

Abstract
Objective To report sex- and age-specific physical fitness levels in European adolescents.
Methods A sample of 3428 adolescents (1845 girls) aged 12.5–17.49 years from 10 European cities in Austria, Belgium, France, Germany, Greece (an inland city and an island city), Hungary, Italy, Spain and Sweden was assessed in the Healthy Lifestyle in Europe by Nutrition in Adolescence study between 2006 and 2008. The authors assessed muscular fitness, speed/agility, flexibility and cardiorespiratory fitness using nine different fitness tests: handgrip, bent arm hang, standing long jump, Bosco jumps (squat jump, counter movement jump and Abalakov jump), 4×10-m shuttle run, back-saver sit and reach and 20-m shuttle run tests.
Results The authors derived sex- and age-specific normative values for physical fitness in the European adolescents using the LMS statistical method and expressed as tabulated percentiles from 10 to 100 and as smoothed centile curves (P5, P25, P50, P75 and P95). The figures showed greater physical fitness in the boys, except for the flexibility test, and a trend towards increased physical fitness in the boys as their age increased, whereas the fitness levels in the girls were more stable across ages.
Conclusions The normative values hereby provided will enable evaluation and correct interpretation of European adolescents' fitness status.
Statistics from Altmetric.com
A high physical fitness level in childhood and adolescence is associated with more favourable health-related outcomes, concerning present and future risk for obesity, cardiovascular disease, skeletal health and mental health,1 2 which highlights the need to include physical fitness testing in health and/or educational monitoring systems.
Cardiorespiratory fitness (CRF) levels for American,3,–,5 Australian,6 7 Asian,8 9 African5 and European10,–,15 adolescents were reported. In fact, more than 100 studies from 40 countries focused on CRF in young people.5 Available literature suggests that other physical fitness components such as muscular fitness and speed/agility are strongly related with health in young people and should also be considered in future studies.1 16 In this context, we reported the levels of different physical fitness components in Spanish adolescents.17 Other authors did so in other European countries18; yet, methodological differences observed among the studies make comparisons difficult and hard to interpret. Harmonised measurements of physical fitness at a European level in adolescent population are needed. The Healthy Lifestyle in Europe by Nutrition in Adolescence (HELENA) study19 20 provides the opportunity to establish normative values of a wide set of physical fitness components in adolescents from nine different European countries using a common and well-standardised method of measurement.
The main objective of the current study was to report sex- and age-specific physical fitness levels in European adolescents.
Methods
Study design
The HELENA study (http://www.helenastudy.com) is a multi-centre study on lifestyle and nutrition among adolescents from 10 European cities: Athens (inland city) and Heraklion (Mediterranean island city) in Greece, Dortmund in Germany, Gent in Belgium, Lille in France, Pecs in Hungary, Rome in Italy, Stockholm in Sweden, Vienna in Austria and Zaragoza in Spain.20 Data collection took place from 2006 to 2008. Detailed descriptions of the HELENA sampling and recruitment approaches, standardisation and harmonisation processes, data collection, analysis strategies, quality control activities and inclusion criteria were published elsewhere.21 The study was approved by the Research Ethics Committees of each city involved. Written informed consent was obtained from the parents of the adolescents and the adolescents themselves.22
Study sample
Ten European cities of more than 100 000 inhabitants located in separated geographical points in Europe were selected for the study. The geographical distribution was not random and not represented by the strata, but it was decided according to the following criteria: representation of territorial units (countries) of Europe according to geographical location (N/S/E/W), cultural reference and socioeconomic situation and selection of a territorial unit (city) in the country, which is representative of the average level of demography, cultural, social and economic markers. The age range considered valid for the HELENA study was 12.5–17.49 years. All the analyses conducted on the HELENA data are adjusted by a weighing factor to balance the sample according to the theoretical estimation of the HELENA sample concerning age and sex distribution.
A total of 3528 adolescents, 1683 boys and 1845 girls, were considered eligible for the HELENA analyses. To make maximum use of the data, all valid data on physical fitness tests were included in this report. Consequently, sample sizes vary for the different physical fitness tests (see online table S1).
Physical examination
Weight was measured in underwear and without shoes with an electronic scale (Type SECA 861) to the nearest 0.1 kg, and height was measured barefoot in the Frankfort horizontal plane with a telescopic height measuring instrument (Type SECA 225) to the nearest 0.1 cm. Body mass index was calculated as body weight in kilograms divided by the square of height in meters. Identification of sexual maturation (stages I–V) was assessed by direct observation of a medical doctor according to Tanner and Whitehouse.23
Physical fitness assessment
An extended and detailed manual of operations was designed for and thoroughly read by every researcher involved in field work before the data collection started. In addition, a workshop training week was carried out in Zaragoza (Spain) in January 2006, in order to standardise and harmonise the assessment of the physical fitness tests. The field workers were strongly advised to always perform the same fitness test in order to minimise the potential inter-rater variability within each centre. The instructions given to the participants in every test were standardised for all the cities and were translated into the local language to ensure that the same verbal information was given to all participants in the HELENA study.
We assessed the following physical fitness components: muscular fitness, speed/agility, flexibility and aerobic capacity (also called CRF). The scientific rationale for the selection of all of these tests, as well as their reliability in young people, were previously published.24 25 A detailed description of the protocols used for fitness testing is included online in the supplementary material. Briefly, we assessed upper-body muscular strength by handgrip and bent arm hang tests; lower-body muscular strength by standing long jump, squat jump, counter-movement jump and Abalakov jump tests; speed-agility by the 4×10-m shuttle run test; flexibility by the back-saver sit and reach test and CRF by the 20-m shuttle run test. All the tests were performed twice, and the best score was retained, except the bent arm hang and the 20-m shuttle run test, which were performed only once.
Statistical analysis
Anthropometric and physical fitness characteristics of the study sample are presented as means (SD), unless otherwise indicated. We analysed sex- and age-group differences in the anthropometric and physical fitness variables by two-way analysis of variance, unless otherwise stated.
To provide percentile values for European adolescents, we analysed physical fitness data by maximum penalised likelihood using the LMS statistical method for boys and girls separately.26 27 We derived smoothed centile charts using the LMS method. This estimates the measurement centiles in terms of three age–sex-specific cubic spline curves: the L curve (Box–Cox power to remove skewness), M curve (median) and S curve (coefficient of variation). For the construction of the percentile curves, data were imported into the LmsChartMaker software (V. 2.3; by Tim Cole and Huiqi Pan) and the L, M and S curves estimated. The LMS method, specifically the Box–Cox transformation does not work with 0 values. Since a number of adolescents scored 0 in the bent arm hang test, we estimated centile values for this test using standard procedures instead of the LMS method. Except for the LMS method calculations, we used SPSS V. 17.0 software for Windows (SPSS, Chicago, Illinois, USA), and the significance level was set at 5%.
Results
Anthropometric characteristics and physical fitness parameters of the study sample are shown by sex in table 1. Overall, physical fitness performance was better in boys, except for back-saver sit and reach test, in which girls performed better. Overall, anthropometric and physical fitness performance increased with age. The prevalence of boys and girls with a healthy CRF level were 61 and 58, respectively. Four per cent of the boys (N=53) and 12% of the girls (N=185) scored 0 in the bent arm hang test (data not shown).
Characteristics of the study sample by sex
Tables 2–10 show the normative values for physical fitness in the European adolescents, classified according to sex and age and expressed in percentiles from 10 to 100. Centile values were estimated for the closest age; therefore, if a person wants to compare his/her fitness level with the normative values hereby provided, he/she should look at the age closer to his/her current age (eg, if 14 years and 5 months, look at 14 years, and if 14 years and 8 months, look at 15 years).
Tabulated physical fitness centile values by sex and age in European adolescents. Upper-limb maximal strength: handgrip strength test (kg)*
Tabulated physical fitness centile values by sex and age groups* in European adolescents. Upper-limb endurance strength: bent arm hang test (s)
Tabulated physical fitness centile values by sex and age in European adolescents. Lower-limb explosive strength: standing long jump test (cm)
Tabulated physical fitness centile values by sex and age in European adolescents. Lower-limb explosive strength: squat jump (cm)
Tabulated physical fitness centile values by sex and age in European adolescents. Lower-limb explosive strength: counter-movement jump (cm)
Tabulated physical fitness centile values by sex and age in European adolescents. Lower-limb explosive strength: Abalakov jump (cm)
Tabulated physical fitness centile values by sex and age in European adolescents. Speed/agility: 4×10-m shuttle run test (s)
Tabulated physical fitness centile values by sex and age in European adolescents. Flexibility: back saver sit and reach test (cm)*
Tabulated physical fitness centile values by sex and age in European adolescents. Cardiorespiratory fitness: 20-m shuttle run test (stages)
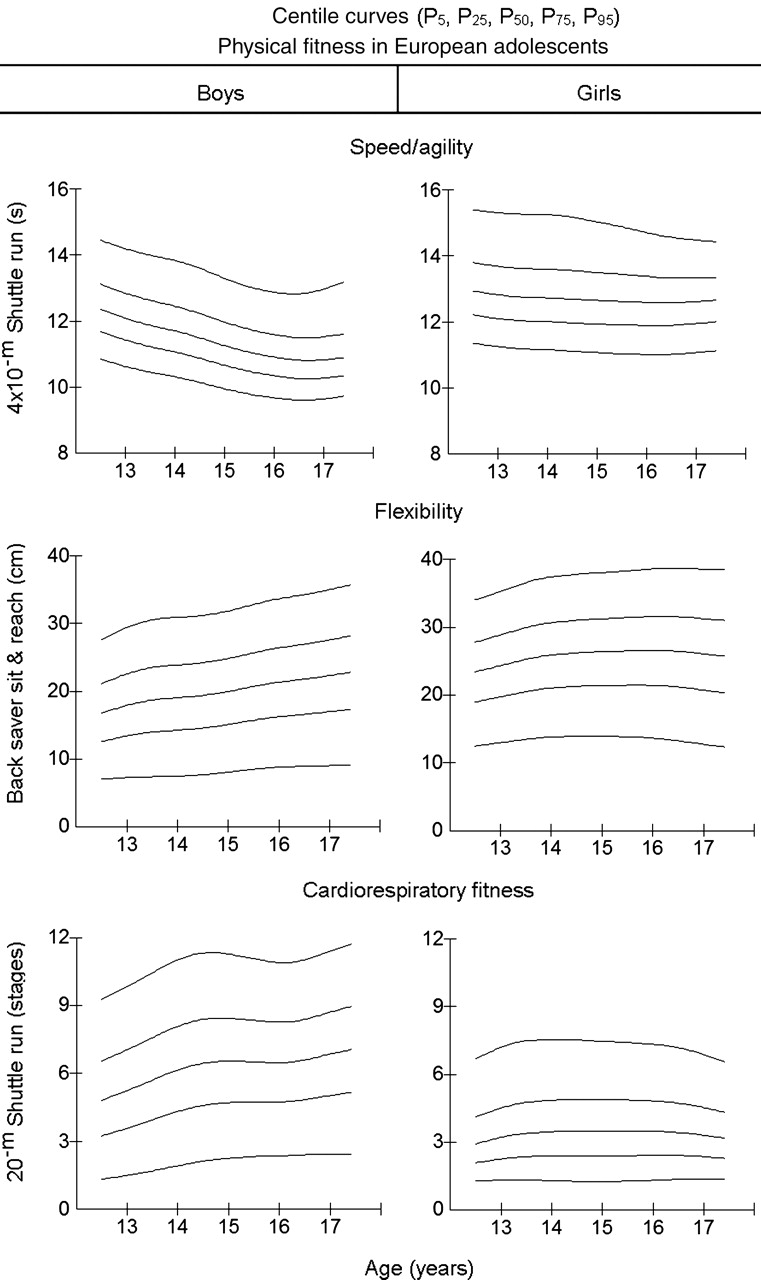
Figures 1–3 show smoothed centile curves (P5, P25, P50, P75, P95) for the physical fitness tests studied by sex and age. The figures clearly show greater physical fitness in boys, except for the flexibility test, in which girls performed slightly better. From the figures, it can be seen that the results for the girls were generally more homogeneous than for the boys. There was also a trend towards incrementally higher physical fitness in the boys across age groups, whereas the girls showed stability or a slight increase across ages in physical fitness.
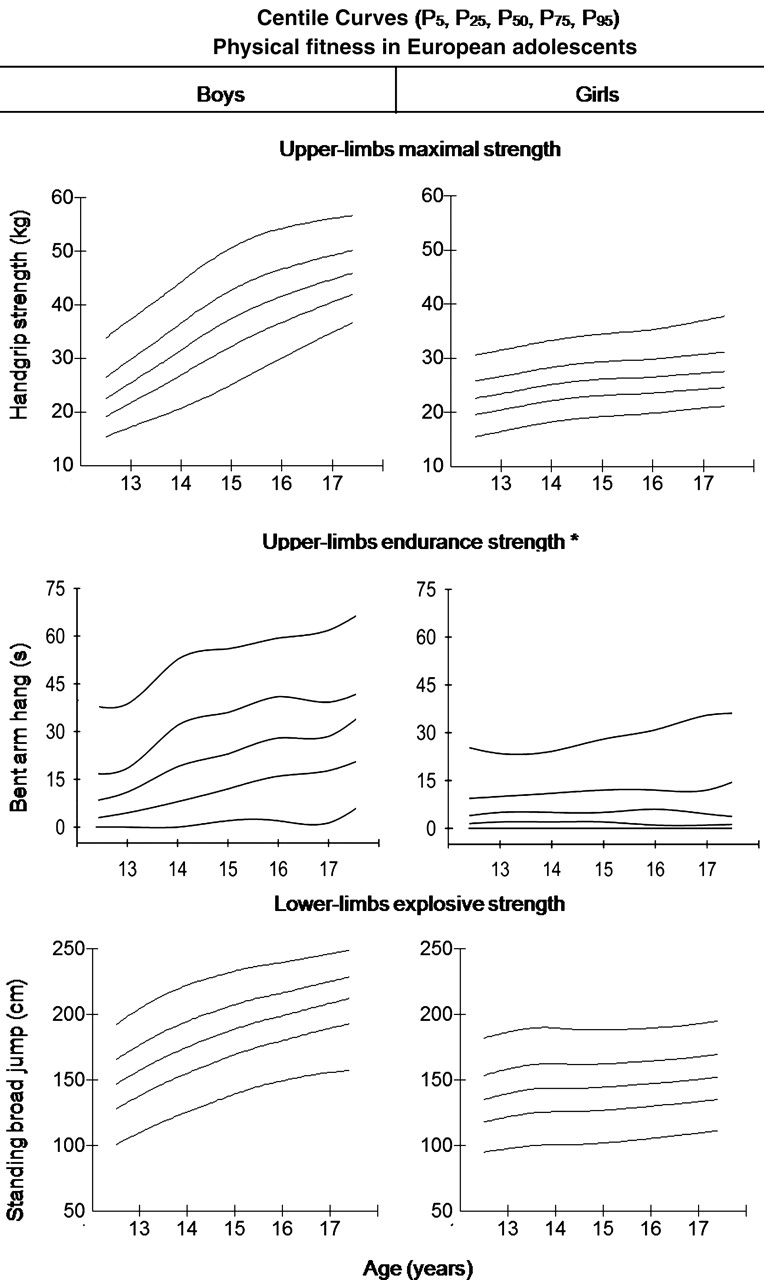
Smoothed (LMS method) centile curves (from the bottom to the top: P5, P25, P50, P75, P95) of three physical fitness tests assessing upper-limb maximal strength, upper-limb endurance strength and lower-limb explosive strength. Asterisk represents centile curves were estimated using standard procedures for bent arm hang test.

Smoothed (LMS method) centile curves (from the bottom to the top: P5, P25, P50, P75, P95) of Bosco jumps assessing different components of the lower-limb explosive strength. Asterisk represents counter-movement jump assesses lower-limb explosive strength and muscle elastic component. Double asterisks represent Abalakov jump assesses lower-limb explosive strength, elastic component and inter-muscular coordination capacity.
Smoothed (LMS method) centile curves (from the bottom to the top: P5, P25, P50, P75, P95, except for speed/agility that is the opposite order; in this test, lower scores indicate better performance) of three physical fitness tests assessing speed/agility, flexibility and cardiorespiratory fitness.
Discussion
The recently published literature indicates that physical fitness is an important health marker already in youth,1 2 highlighting the need of meaningful and accurate physical fitness assessment in young people. Correct interpretation of physical fitness assessment requires comparing the score obtained in a particular person with normative values for the general population with the same sex and age. In this context, the HELENA data presented in this study provide sex- and age-specific normative values for a complete set of physical fitness components in European adolescents from nine different European countries. The main strength of the HELENA study, and in turns of the normative values hereby provided, is the strict standardisation of the fieldwork among the countries involved in the study, which precludes to a great extent the kind of confounding bias due to inconsistent measurements protocols that often interferes when comparing results from isolated studies.
In this study, we measured performance on fitness tests, and the output can be influenced by several factors, such as a potential “learning” effect (positive systematic bias) when the test would have been performed a second time. We previously tested this question in 100 adolescents from the same cities involved in the HELENA study.25 Our data showed that the bias for repeated physical fitness tests included in the HELENA study was mostly close to 0. The results suggest that neither learning nor fatigue (negative systematic bias) effects occurred when physical fitness is assessed, on a test–retest basis, in adolescents. The tests can, therefore, be considered reliable in this population. Regarding validity, we have just systematically reviewed the literature on that issue28 and concluded that the 20-m shuttle run test is a valid test to assess CRF, that the handgrip strength test is a valid test to assess upper-body muscular strength and that the standing long jump is a valid test to assess lower-body muscular strength. A large number of other field-based fitness tests present limited evidence, mainly due to a limited number of studies available (one for each test).
We observed that a substantial number of the adolescents studied, particularly girls, scored 0 in the bent arm hang test. Castro-Piñero et al observed even higher percentages of youths (age 6–18 years) scoring 0 in this test (28% of the boys and 39% of the girls).29 Surely, there are differences in upper-body endurance muscular fitness among the adolescents that performed 0 in the bent arm hang test, but the test is not able to discriminate them. Because of the lack of sensitivity observed in this test, its usefulness and future use in European adolescents is questionable.
Given the importance of CRF as a powerful marker of health in childhood and adolescence, scientists and worldwide-recognised organisations proposed sex-specific cut-offs for a healthy CRF level in these ages.30,–,33 The cut-off values proposed by FITNESSGRAM were used in this study.30 31 These cut-off points were extrapolated from the thresholds for adult populations related with a higher risk of morbidity and mortality established by Blair et al.34 In addition, they recently showed to be valid for discriminating between adolescents with a more favourable cardiovascular profile and those with a less favourable profile.35 The prevalence of European adolescents with a healthy CRF level shown in this study (61% of boys and 57% of girls) is substantially lower than those observed in previous studies conducted on European adolescents from Spain (81% of boys and 83% of girls)17 or Sweden (91% of boys and 80% of girls).36 However, the figures observed in this study are similar to those reported for US adolescents (two thirds of both boys and girls).4 Although all the studies used the same cut-off points to define healthy CRF level, methodological differences in the assessment of CRF make comparison among studies difficult.
Comprehensive studies examining secular changes in CRF levels in European adolescents indicate a consistent decline in this physical fitness component over the last decades.37 According to these findings, current prevalence of European adolescents with a healthy CRF level are expected to be lower than those from less recent studies. In addition, a meta-analysis reviewing more than 100 studies using the 20-m shuttle run test in 37 countries concluded that Italian and Greek adolescents, both involved in this study, along with Portuguese, US, Brazilian and Singaporean adolescents have the worst CRF level from a worldwide perspective.5 In order to test whether the low prevalence of healthy CRF adolescents observed could be due to the equation used to estimate VO2max, we additionally estimated the prevalence of adolescents with a healthy CRF level using a new equation to predict VO2max developed for the HELENA study38 instead of the classic Léger's equation. The percentage for the whole sample was similar (60%), but the prevalence of healthy CRF for boys was substantially higher (80%) and the prevalence for girls lower (41%), compared with the figures observed using Léger's equation. Nevertheless, since both equations have shown to be highly reliable, any underlying changes in VO2max are likely to be detected by changes in 20-m shuttle run test performance, and so long as a consistent method of estimating VO2max is used, then prevalence estimates should not be systematically biased over time (as the bias is always constant).
In agreement with previous literature,17 our data suggest that the girls' fitness levels are generally more homogeneous than boys' fitness level and a trend towards incrementally higher physical fitness in the boys across age groups, whereas the girls showed stability or a slight increase across ages in physical fitness.
The main limitation of this study is related to its design. Physical fitness normative values in growing children and adolescents should be obtained from longitudinal studies that give the possibility to assess natural changes in individual growth and development. Nevertheless, in the absence of those longitudinal data in European adolescents, cross-sectional information accurately assessed by harmonised and standardised procedures, and properly analysed by means of appropriate statistical methods (ie, LMS method, instead of raw centiles), is valuable and should be used.
Clinical and public health implications
The reported normative values can be used for different purposes. In population terms, the lowest percentiles provided here, for example, the 5th and 10th percentiles, can be used as a “warning signal,” and further testing should be initiated in adolescents under the lowest percentiles to investigate the presence of co-morbidities. A number of participants under this percentile might also carry genetic mutations that do not cause disease phenotypes per se but do cause exercise intolerance (eg, deficit of muscle AMP deaminase due to the C34T mutation in the AMPD1 gene).39
The normative values have also been shown as 10th to 100th percentiles, so the adolescents can score their individual fitness levels—for example, on a scale from 1 to 10. This also enables intuitive classification of the individual level of physical fitness by using a Likert-type scale: very poor (X<P20), poor (P20≤X<P40), medium (P40≤X<P60), good (P60≤X<P80) and very good (X≥P80). This is especially interesting when the evaluation is done in the healthcare or educational setting, essential areas for the early problems detection. Thus, the precision and influence of the particular intervention on the level of physical fitness of an individual or a group can be observed by following a student's tracking in the percentile categories. Such individual changes must be rewarded by the instructor or physical education teacher in order to increase the likelihood of fostering a sense of competence and self-mastery in all adolescents.40
What is known on this topic
▶ Muscular fitness and speed/agility are important physical fitness components related with youth health status; however, they have been understudied in the literature, in comparison with CRF.
▶ Physical fitness levels have been reported in USA, Spain and some other single European countries. Harmonised measurements of physical fitness at a European level in adolescent population are needed.
What this study adds
▶ The HELENA study provides the opportunity to establish updated normative values of a wide set of physical fitness components in adolescents from nine different European countries using harmonised and well-standardised methods of measurement.
Conclusions
Sex- and age-specific physical fitness normative values for European adolescents have been established. The normative values hereby provided will enable evaluation and correct interpretation of European adolescents' fitness status. Since CRF, muscular fitness and speed/agility in adolescents have shown to be strongly related with the current and future health status, the fifth centile curves obtained in this study can be used as a biological indicator below which the level of physical fitness can be considered pathological. This “tool” is especially interesting in healthcare and educational setting. For practical reasons related to the fitness testing facilities and equipment required, and for the training and background of physical education teachers, we believe that school should play a major role in helping to identify adolescents with low physical fitness. The reported normative values should not be used to foster competition among the adolescents. Rather, they provide a unique opportunity to accurately detect individual improvements, relative to the adolescent's own performance (eg, from centile 40th to 60th). Additional work is needed to more fully characterise and identify cut-points related to health outcomes for all fitness components.
Acknowledgments
The authors gratefully acknowledge all participating children and adolescents and their parents and teachers for their collaboration. The authors also acknowledge all the members involved in field work for their efforts and great enthusiasm.
References
Footnotes
FBO and EGA contributed equally.
-
Funding The HELENA study takes place with the financial support of the European Community Sixth RTD Framework Programme (Contract FOOD-CT-2005-007034). This study is also being supported by grants from the Spanish Ministry of Education (EX-2007-1124, EX-2008-0641, AP-2005-3827, AP2005-4358, DEP2007-29933-E), Swedish Council for Working Life and Social Research, and the ALPHA study, a European Union-funded study, in the framework of the Public Health Programme (Ref: 2006120). The content of this article reflects only the authors' views, and the European Community is not liable for any use that may be made of the information contained therein.
-
Competing interests None.
-
Ethics approval The study was approved by the Research Ethics Committees of each city involved. For further information about ethical issues in the HELENA study see reference 22.
-
Provenance and peer review Not commissioned; externally peer reviewed.
-
Patient consent Obtained.
↵ϕ HELENA Study Group
-
Disclosure The content of this paper reflect only the authors' views and the rest of HELENA study members are not responsible for it.
-
Co-ordinator Luis A. Moreno.
-
Core Group members Luis A. Moreno, Fréderic Gottrand, Stefaan De Henauw, Marcela González-Gross, Chantal Gilbert.
-
Steering Committee Anthony Kafatos (President), Luis A. Moreno, Christian Libersa, Stefaan De Henauw, Jackie Sánchez, Fréderic Gottrand, Mathilde Kersting, Michael Sjöstrom, Dénes Molnár, Marcela González-Gross, Jean Dallongeville, Chantal Gilbert, Gunnar Hall, Lea Maes, Luca Scalfi.
-
Project Manager Pilar Meléndez.
Universidad de Zaragoza (Spain) Luis A. Moreno, Jesús Fleta, José A. Casajús, Gerardo Rodríguez, Concepción Tomás, María I. Mesana, Germán Vicente-Rodríguez, Adoración Villarroya, Carlos M. Gil, Ignacio Ara, Juan Revenga, Carmen Lachen, Juan Fernández Alvira, Gloria Bueno, Aurora Lázaro, Olga Bueno, Juan F. León, Jesús Mª Garagorri, Manuel Bueno, Juan Pablo Rey López, Iris Iglesia, Paula Velasco, Silvia Bel.
Consejo Superior de Investigaciones Científicas (Spain) Ascensión Marcos, Julia Wärnberg, Esther Nova, Sonia Gómez, Esperanza Ligia Díaz, Javier Romeo, Ana Veses, Mari Angeles Puertollano, Belén Zapatera, Tamara Pozo.
Université de Lille 2 (France) Laurent Beghin, Christian Libersa, Frédéric Gottrand, Catalina Iliescu, Juliana Von Berlepsch.
Research Institute of Child Nutrition Dortmund, Rheinische Friedrich–Wilhelms Universität Bonn (Germany) Mathilde Kersting, Wolfgang Sichert-Hellert, Ellen Koeppen.
Pécsi Tudományegyetem (University of Pécs) (Hungary) Dénes Molnar, Eva Erhardt, Katalin Csernus, Katalin Török, Szilvia Bokor, Mrs. Angster, Enikö Nagy, Orsolya Kovács, Judit Repásy.
University of Crete School of Medicine (Greece) Anthony Kafatos, Caroline Codrington, María Plada, Angeliki Papadaki, Katerina Sarri, Anna Viskadourou, Christos Hatzis, Michael Kiriakakis, George Tsibinos, Constantine Vardavas Manolis Sbokos, Eva Protoyeraki, Maria Fasoulaki.
Institut für Ernährungs- und Lebensmittelwissenschaften – Ernährungphysiologie. Rheinische Friedrich Wilhelms Universität (Germany) Peter Stehle, Klaus Pietrzik, Marcela González-Gross, Christina Breidenassel, Andre Spinneker, Jasmin Al-Tahan, Miriam Segoviano, Anke Berchtold, Christine Bierschbach, Erika Blatzheim, Adelheid Schuch, Petra Pickert.
University of Granada (Spain) Manuel J. Castillo, Ángel Gutiérrez, Francisco B. Ortega, Jonatan R Ruiz, Enrique G. Artero, Vanesa España-Romero, David Jiménez-Pavón, Palma Chillón.
Istituto Nazionale di Ricerca per gli Alimenti e la Nutrizione (Italy) Davide Arcella, Elena Azzini, Emma Barrison, Noemi Bevilacqua, Pasquale Buonocore, Giovina Catasta, Laura Censi, Donatella Ciarapica, Paola D'Acapito, Marika Ferrari, Myriam Galfo, Cinzia Le Donne, Catherine Leclercq, Giuseppe Maiani, Beatrice Mauro, Lorenza Mistura, Antonella Pasquali, Raffaela Piccinelli, Angela Polito, Raffaella Spada, Stefania Sette, Maria Zaccaria.
University of Napoli “Federico II” Dept of Food Science (Italy) Luca Scalfi, Paola Vitaglione, Concetta Montagnese.
Ghent University (Belgium) Ilse De Bourdeaudhuij, Stefaan De Henauw, Tineke De Vriendt, Lea Maes, Christophe Matthys, Carine Vereecken, Mieke de Maeyer, Charlene Ottevaere
Medical University of Vienna (Austria) Kurt Widhalm, Katharina Phillipp, Sabine Dietrich, Birgit Kubelka Marion Boriss-Riedl.
Harokopio University (Greece) Yannis Manios, Eva Grammatikaki, Zoi Bouloubasi, Tina Louisa Cook, Sofia Eleutheriou, Orsalia Consta, George Moschonis, Ioanna Katsaroli, George Kraniou, Stalo Papoutsou, Despoina Keke, Ioanna Petraki, Elena Bellou, Sofia Tanagra, Kostalenia Kallianoti, Dionysia Argyropoulou, Katerina Kondaki, Stamatoula Tsikrika, Christos Karaiskos.
Institut Pasteur de Lille (France) Jean Dallongeville, Aline Meirhaeghe.
Karolinska Institutet (Sweden) Michael Sjöstrom, Patrick Bergman, María Hagströmer, Lena Hallström, Mårten Hallberg, Eric Poortvliet, Julia Wärnberg, Nico Rizzo, Linda Beckman, Anita Hurtig Wennlöf, Emma Patterson, Lydia Kwak, Lars Cernerud, Per Tillgren, Stefaan Sörensen.
Asociación de Investigación de la Industria Agroalimentaria (Spain) Jackie Sánchez-Molero, Elena Picó, Maite Navarro, Blanca Viadel, José Enrique Carreres, Gema Merino, Rosa Sanjuán, María Lorente, María José Sánchez, Sara Castelló.
Campden & Chorleywood Food Research Association (United Kingdom) Chantal Gilbert, Sarah Thomas, Elaine Allchurch, Peter Burguess.
SIK - Institutet foer Livsmedel och Bioteknik (Sweden) Gunnar Hall, Annika Astrom, Anna Sverkén, Agneta Broberg.
Meurice Recherche & Development asbl (Belgium) Annick Masson, Claire Lehoux, Pascal Brabant, Philippe Pate, Laurence Fontaine.
Campden & Chorleywood Food Development Institute (Hungary) Andras Sebok, Tunde Kuti, Adrienn Hegyi.
Productos Aditivos SA (Spain) Cristina Maldonado, Ana Llorente.
Cárnicas Serrano SL (Spain) Emilio García.
Cederroth International AB (Sweden) Holger von Fircks, Marianne Lilja Hallberg, Maria Messerer.
Lantmännen Food R&D (Sweden) Mats Larsson, Helena Fredriksson, Viola Adamsson, Ingmar Börjesson.
European Food Information Council (Belgium) Laura Fernández, Laura Smillie, Josephine Wills.
Universidad Politécnica de Madrid (Spain) Marcela González-Gross, Agustín Meléndez, Pedro J. Benito, Javier Calderón, David Jiménez-Pavón, Jara Valtueña, Paloma Navarro, Alejandro Urzanqui, Ulrike Albers, Raquel Pedrero, Juan José Gómez Lorente.