Article Text

Abstract
Background This study used a novel protocol to test the hypothesis that a plateau in oxygen consumption (VO2max) during incremental exercise testing to exhaustion represents the maximal capacity of the cardiovascular system to transport oxygen.
Methods Twenty-six subjects were randomly divided into two groups matched by their initial VO2max. On separate days, the reverse group performed (i) an incremental uphill running test on a treadmill (INC1) plus verification test (VER) at a constant workload 1 km h−1 higher than the last completed stage in INC1; (ii) a decremental test (DEC) in which speed started as same as the VER but was reduced progressively and (iii) a final incremental test (INCF). The control group performed only INC on the same days that the reverse group was tested.
Results VO2max remained within 0.6 ml kg−1 min−1 across the three trials for the control group (p=0.93) but was 4.4% higher during DEC compared with INC1 (63.9±3.8 vs 61.2±4.8 ml kg−1 min−1, respectively, p=0.004) in the reverse group, even though speed at VO2max was lower (14.3±1.1 vs 16.2±0.7 km h−1 for DEC and INC1, respectively, p=0.0001). VO2max remained significantly higher during INCF (63.6±3.68 ml kg−1 min−1, p=0.01), despite an unchanged exercise time between INC1 and INCF.
Conclusion These findings go against the concept that a plateau in oxygen consumption measured during the classically described INC and VER represents a systemic limitation to oxygen use. The reasons for a higher VO2 during INCF following the DEC test are unclear.
Statistics from Altmetric.com
Introduction
In 1923, Nobel laureate Archibald Hill and his colleagues1 2 proposed that the body has a limited capacity to consume oxygen during intense exercise. Subsequent studies3,–,5 refined the original testing methods and honed the theory that the occurrence of a plateau in oxygen intake (VO2) despite an increasing workload represents the maximal capacity of the cardiovascular system to transport oxygen to the exercising muscles.6 Thus in 1971 Mitchell and Blomqvist proposed that ‘there is a linear relationship between workload and oxygen uptake until the maximal oxygen uptake is reached. Heavier workloads can usually be achieved, but oxygen uptake levels off or may even decline’5 (p 1018).
Considering that the human body is a closed system, there must be a finite capacity for extracting oxygen from the atmosphere and using it in the exercising muscles. The debate, however, is whether the plateau seen during incremental tests to exhaustion actually represents that ceiling and, if so, what are the biological implications of this finding. In the past 80 years, no study has yet convincingly challenged the original conclusion that a plateau in VO2 (VO2max) measured with the conventional incremental exercise testing protocol (INC) represents the absolute true maximal capacity of the cardiovascular system to transport oxygen.7,–,11 This finding is therefore interpreted in favour of the original (Hill) theory. The most recent scholarly review of the topic concludes: ‘athletes stop exercising at VO2max (…) due to what is ultimately a limitation in convective oxygen transport’12 (p 31).
However, a few studies have indeed shown that higher VO2max values can occasionally be achieved either when different incremental exercise protocols are used,13,–,15 or during testing in the heat,16 or when subjects exercise at progressively increasing rates of perceived exertion (RPE).17 Conversely, some argue that a plateau in VO2 is an inconstant phenomenon, consistently difficult to demonstrate and which may also occur during submaximal exercise.18 19 Despite these contradictory findings, it is currently accepted that a true VO2max is always achieved during uphill treadmill running tests as confirmed by the same or lower VO2max during subsequent exercise at workloads higher than that achieved at VO2max during the traditional INC.7 10
Although it is reasonably clear in the current state of scientific knowledge that using higher-than-maximal, constant speed tests do not produce higher VO2max values,9 20 it is somewhat surprising that submaximal decremental exercise protocols produce higher-than-expected VO2 when compared with a similar power output during an incremental protocol.21 One possible explanation for this finding is that the body starts paying the so-called ‘oxygen deficit’ as it moves towards more aerobic work rates,22 thus increasing oxygen consumption beyond predicted levels.
In light of the investigations that have attempted unsuccessfully to elicit higher-than-maximal VO2max values during exercise at (supramaximal) workloads greater than that at which the VO2max was measured,7 10 we decided to evaluate the effects of a novel ‘reverse’ testing protocol in which the exercise began at a high running speed and then slowed progressively. We reasoned that if subjects knew beforehand that the test would become progressively easier the longer it continued, the possibility was that any biological controls directing the termination of exercise23 24 might be relaxed, thus allowing the achievement of a VO2max higher than that achieved with conventional INC. Here we report the results of VO2max testing using this novel protocol.
Methods
Subjects
Twenty-six participants involved in regular running or cross-country skiing training (23 men and 3 women, age 29.0±10.0 years (range 17–47 years), body mass 73.7±9.8 kg, height 177±6 cm) were recruited. All participants were injury-free for the duration of the trials and gave their written informed consent to take part in this investigation, which was approved by the Research and Ethics Committee of the University of Cape Town and all other institutions where trials were performed. The trials were conducted in three different laboratories: Sogn og Fjordane University College (Norway, n=18), University of Bedfordshire (UK, n=6) and Charles Sturt University (Australia, n=2). Collecting the data from three different institutions partially prevented our data from possible experimenter or equipment bias.
Study design
The participants visited the laboratory on five occasions (figure 1), each separated by at least 48 h. After performing a maximal INC during the first two visits, the participants were matched for their VO2max and randomly divided into two groups. While visit 1 served for familiarisation purposes only, visit 2 was used to establish the VO2max of the participants during an uphill running incremental test (INC1). The control group performed incremental tests to fatigue on the next three visits, while the reverse group performed a familiarisation decremental test on visit 3, a tailored decremental test on their fourth visit (DEC) and a repeat incremental test on their fifth visit (INCF) (figure 1).
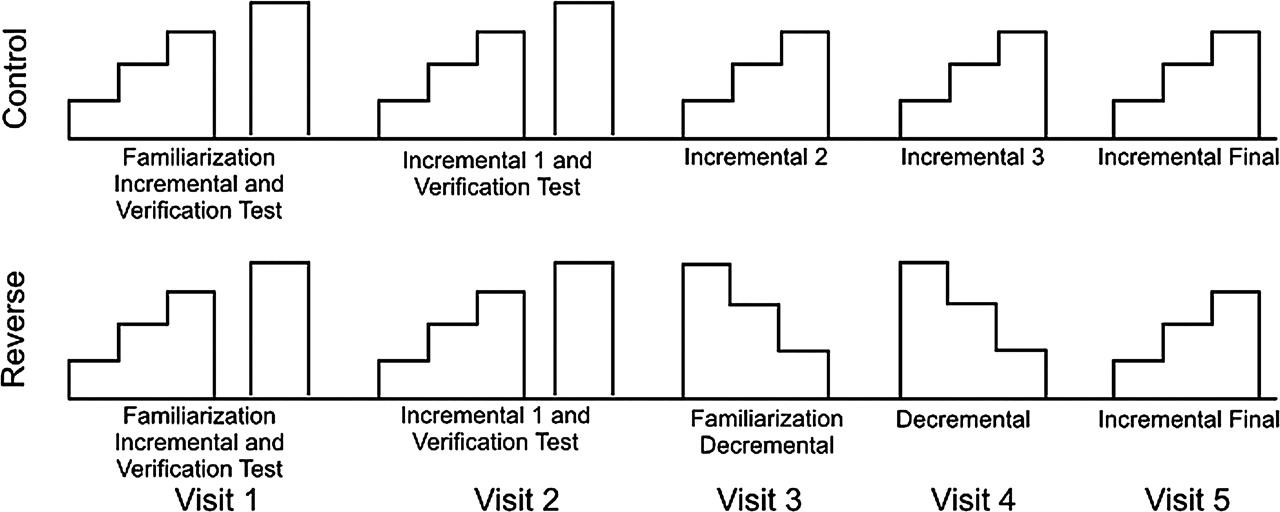
Diagram showing the timing of the different testing sessions. Sessions were separated by at least 48 h.
The participants were instructed to avoid hard training sessions for the 24 h preceding each visit and not to ingest caffeine for 6 h before the tests. Tests were scheduled at the same time of the day and laboratory conditions were stable (temperature 20±0.5°C, humidity 46±3%) for the duration of the study. All tests were performed on a motor-driven treadmill, with a constant inclination of 5%. All trials were completed within 3 weeks by each participant.
Incremental test
All INC were preceded by a 10-min warm-up (5 min at 10 km h−1 and 5 min at 12 km h−1, 0% grade). The tests started at 9 km h−1 for men and 7 km h−1 for women, and the speed was increased by 1 km h−1 every minute (therefore 1 min is equivalent to one stage) until subjects were unable to continue the test. On the first (familiarisation) and second visits, a verification test (VER) was performed 15 min after the end of the incremental test. In between the two tests the participants were allowed to walk, jog or rest as each chose. The VER began at 10 km h−1 and 5% inclination for 1 min. The speed was then increased to 1 km h−1 higher than the last stage completed by the participant during INC. Participants were instructed to run at that speed for as long as each could.
Decremental test
The protocol for the decremental (DEC) tests was established as a function of the result from INC. Following the same warm-up, the test started with a 1-min run at 10 km h−1 and 5% inclination. Thereafter the treadmill speed was increased to that used during VER. Subjects who ran at that speed for 60% of the time each had managed during the VER. After the initial stage which usually lasted around 1 min, the treadmill speed was decreased by 1 km h−1 and maintained for 30 s. This was followed by consecutive decrements of 0.5 km h−1 that were maintained for 30 s, 45 s, 60 s, 90 s and 120 s, respectively. This standard approach was used on visit 3 (familiarisation with DEC). Depending on the reaction of the participant to the familiarisation DEC protocol, the durations of the stages on visit 4 were modified by either shortening or lengthening so that each subject would require at least 5 min before becoming exhausted (figure 3). An extra 30-s warm-up stage (12–13 km h−1) was also included on visit 4 before the treadmill speed was increased to the starting speed for the test in order to diminish the gap in speed between the warm-up and the high-intensity start of the test.

Mean±SD for maximal oxygen consumption (VO2max) during the different trials for the Control (White) and Reverse (Grey) group. INC 1, incremental test 1; INC 3, incremental test 3; INC Final, final incremental test; DEC, decremental test. *Indicates significant difference from respective INC 1 (p<0.05).
Instruments and data handling
All respiratory variables were measured using automated gas analyser systems (MOXUS Modular Metabolic System, AEI Technologies, IL, USA; n=18; ParvoMedics, True2400, East Sandy, Utah, USA; n=2; Cortex Metalyser 11R, Cortex GmbH, Leipzig, Germany; n=6). Prior to the trials, the analysers and their respective software (only the Moxus requires this step) were calibrated strictly according to the manufacturers' recommendations. Ventilation measurements were calibrated using a 3-litre calibration syringe (Hans-Rudolph,Kansas City, MO, USA).
Samples of expired air were continuously drawn into the analysers to calculate the fractions of O2 and CO2. The data were fed into a PC that calculated the results by programs developed by the manufacturers. Heart rate data were monitored continuously using a Polar S410 heart rate monitor (Polar Electro OY, Kempele, Finland), synchronised with the gas analyser software.
All physiological data were collected breath by breath, exported from the analyser software into Excel spreadsheets and calculated as consecutive 30-s intervals. During INC, data were considered until the end of the final completed stage. Data collected during VER and DEC were considered up to the time that a final complete 30-s sample had been collected. This was done to ensure that the comparison between INC and VER was done at two different workloads, as required to define a plateau in VO2. Further calculations revealed that this procedure had no impact on the VO2max values for INC. A plateau in VO2 during INC was accepted if the change in VO2 during the highest 30-s interval of the two final stages of the test was less than half of the normal stage-to-stage change in VO2 during the initial (linear) parts of the tests for each subject. The average stage-to-stage difference in VO2 for all participants was calculated as 246±37 ml min−1, so that a plateau phenomenon was defined as a change in VO2 < 123±18 ml min−1 (or an average of 1.7 ml kg−1 min−1, considering the average body mass of the participants) between the two final stages of the test. The same criterion was used to define a plateau in VO2 between the peak VO2 values measured during INC and VER, since VER was performed at one stage higher than the maximal stage completed during INC.
Statistics
All data are expressed as mean±SD. The initial VO2 and time to fatigue values for control and reverse groups during INC1 were compared using Student's t test for independent samples. To investigate possible differences in the physiological variables during the trials, repeated measures ANOVA was performed, and a Tukey post hoc was used when a main effect was found. All calculations were performed using Statistica 10 (StatSoft Inc., Tulsa, OK, USA). The typical error in the day-to-day changes in VO2 for the control group was calculated using an Excel spreadsheet.25
Results
There were no differences in VO2max between the reverse and control groups (61.2±4.9 vs 61.3±7.8 ml kg−1 min−1, respectively, p=1.000) during INC1, indicating a similar level of aerobic fitness between the groups. Although there was a small difference in time to exhaustion for INC1 (8.71±0.62 vs 8.58±1.52 min respectively, p=0.004), this represented only 7.8 s of exercise and is likely of little or no biological significance. Four participants in each group did not develop a plateau in VO2 during INC1. However, all but one subject in each group, both of whom displayed a plateau during INC1, showed the plateau phenomenon in VER. VO2max during VER was 0.1±2.3 ml kg−1 min−1 lower for the control group and 0.3±1.2 ml kg−1 min−1 higher for the reverse group compared with values measured in their respective INC1.
All physiological variables are listed in table 1. VO2max remained constant for the control group over the different testing days, as did time to fatigue. The typical error for VO2max in the control group over the four INC was 1.6 ml kg−1 min−1 (95% CI 1.3–2.1 ml kg−1 min−1). On the other hand, VO2max for the reverse group was 4.4% higher during DEC compared with INC1 (63.9±3.8 vs 61.2±4.8 ml kg−1 min−1, respectively, p=0.004) (table 1, figure 2). The difference in VO2max between INC1 and DEC was on average 2.7±3.1 ml kg−1 min−1 (∼200 ml min−1), which is 60% higher than the threshold for a VO2 plateau during INC1 (1.7 ml kg−1 min−1, 123 ml min−1), even though the subjects were running at about 1.9 km h−1 slower during DEC compared with INC1 (table 1). VO2max remained significantly higher during INCF than during INC1 for the reverse group (63.6±3.8 vs 61.2±4.8 ml kg−1 min−1, p=0.015), despite similar values for time to fatigue and speed at VO2max during both trials. There were no differences for ventilation, heart rate, breathing frequency and respiratory exchange ratio between the trials for any of the groups, except for ventilation for the control group between INC1 and INCF (157.0±25.6 vs 146.5±24.0 l min−1, p=0.013). A graphical illustration of the relationship between VO2 and speed in the different trials for one illustrative subject is presented in figure 3.

Oxygen consumption and treadmill speed during different trials for the participant with the second highest VO2max difference between INC1 and DEC. The four trials presented are: INC1, VER, DEC and INCF. For this particular subject, VO2 was 70 ml min−1 (1,5%) higher during VER, 683 ml min−1 (15.1%) higher during DEC and 640 ml min−1 (14.2%) higher during INCF in comparison with INC1. VO2 is represented by solid lines, and dotted lines represent speed.
Physiological variables for control and reverse groups during the different trials
Discussion
After its original conception in 1923,1 2 the theory that a plateau in VO2 at the end of an incremental exercise test to exhaustion indicates an ultimate physiological ceiling in cardiovascular function was rapidly adopted.3,–,6 Only more recently this view has been challenged23 26,–,29 and vigorously defended.7 12 30,–,33 To counter some of these criticisms, the so-called verification test (VER) emerged.7,–,9 11 20 34,–,37 This requires the participant to exercise for as long as possible at a higher power output than that achieved during the conventional INC. If the peak VO2 measured during VER is no higher than that achieved during INC testing despite the increased workload, it is assumed that a true plateau in oxygen consumption had developed during INC and VER.10 32 The adoption of the VER method substantially increased the frequency with which a plateau in VO2 was detected and further strengthened the original theory on which the plateau concept is founded.16 20 36 38
Accordingly, the first important finding of this study was that the VO2max measured with the conventional INC is not the highest value of which each individual is capable, even when VER ensured that the original INC did indeed produce a ‘maximal’ result. Instead a novel ‘reverse’ protocol produced VO2max values that were about 4.4% higher than those achieved with the conventional INC.
While studies using DEC have demonstrated an excess VO2 consumption during submaximal exercise compared with values measured during INC,39,–,43 our study is the first to show this phenomenon during maximal exercise. The increase in VO2 measured during DEC (2.7 ml kg−1 min−1 in this study) was substantially greater than the value (1.7 ml kg−1 min−1) which defined the plateau threshold during INC and which was present in all but one subject in each group during the INC1.7 9 In fact, the increase in VO2 measured in this study is almost of a magnitude that should have allowed the runners to perform an additional stage during INC (assuming that the increase in VO2 during that stage was a linear function of the increase in work rate during the submaximal portion of the test).4 29 In addition, the 2.7 ml kg−1 min−1 increase in VO2 was greater than the 2.1 ml kg−1 min−1 upper limit of the 95% CI of the typical error of measurement calculated for the participants in the control group. It was also greater than the 2% difference suggested as a minimal significant change for VO2 between trials.36 44 Similar changes in VO2max are accepted in the literature as indicators of improved aerobic capacity in elite alpine skiers,45 elite runners after altitude training46 and well-trained runners after ‘live high-train low’ training.47
This finding, therefore, convincingly shows that subjects terminated the conventional INC, appropriately conducted according to all required protocols (including the use of VER), with cardiorespiratory reserve and therefore before an absolute limitation in either oxygen delivery to, or its use by the exercising muscles had been reached.27 28 48 Also, it goes against the conventional belief12 49 50 and confirms our initial hypothesis that a plateau in VO2 during an uphill running INC does not provide the final proof that the body has reached an absolute limit in its capacity to consume oxygen.
Other studies have shown that the VO2max measured during conventional INC may be less than that achieved when subjects are either free to choose their power outputs in free-range exercise51 52 or according to an incremental increase in their ratings of perceived exertion.17 Our study, however, differs from previous attempts in that we used subjects with high levels of aerobic capacity,30 employed a VER to confirm the attainment of VO2max during INC1,9 20 34 and chose a graded treadmill running INC test that produces the higher VO2max values.7 10 53 More importantly, our subjects did not exercise at higher power outputs during the DEC than during INC or VER. This satisfies the issue of different muscle masses required to complete the different tests.54,–,57
Indeed our second unexpected finding was that during the reverse protocol subjects reached their VO2max when running at about 90% of the speed associated with VO2max during INC. Several studies58,–,62 have investigated the physiological effects of running to exhaustion at constant speeds corresponding to ∼90–105% of the speed associated with VO2max. None found a higher VO2max during these constant load trials compared with INC, even when a bout of intense exercise was performed prior to the constant load test.63 This establishes that the higher VO2max found during the reverse protocol is not an effect of the lower speed per se, but rather an effect of the protocol design.
The body's capacity to deliver oxygen to the muscles is usually thought to be the factor ‘limiting’ the VO2max,50 64,–,66 since there is metabolic reserve in the mitochondrial capacity to use oxygen during maximal exercise67 and the fact that simply requiring more work to be done by increasing the workload does not increase the VO2max.7 10 11 The finding that heart rate, breathing rate and ventilation at VO2max were not different between protocols (table 1) excludes the possibility that the excess VO2 is the result simply of extra mechanical work done by the heart or respiratory muscles.
To tests the hypothesis of an O2 delivery limited VO2max, several attempts using different techniques to increase the VO2max by increasing oxygen delivery to the muscles have already been performed, with mixed results. Exposure to hyperoxia increases leg muscle oxygen uptake during knee extension exercise in patients with chronic heart failure66 and in well-trained athletes68 but not in healthy sedentary individuals.66 Infusion of adenosine and ATP to increase vasodilatation during maximal exercise increases blood flow and oxygen delivery to the lower limbs, however this occurs without concomitant changes in VO2max.69 70 On the other hand, treatment with recombinant human erythropoietin increases VO2max without augmenting skeletal muscle blood flow.71
Acutely exposing skeletal muscles to hypoxic episodes is thought to facilitate redistribution of blood flow from inactive to active muscle fibres,72 therefore improving O2 delivery. Acute72 and prolonged73 ischaemic conditioning of the lower limbs through blood flow occlusion increases VO2max to the same magnitude as found in this study. While preconditioning for 2 weeks is likely to produce more meaningful physiological changes,73 an acute bout of 30 min of blood flow occlusion may alter blood flow distribution during subsequent exercise72 and in response to acute hypoxia.74 Conceivably, this mechanism might also have occurred during DEC in this study.
Emotional stress can affect blood flow during exercise75,–,77 and stimulation of sympathetic cholinergic fibres are thought to promote arteriolar vasodilatation and to induce changes in metabolism, producing a switch from aerobic metabolism to increased oxygen-independent glycolytic pathways.75 The type of stress faced during INC in which the participant knows that the load will become progressively more difficult with each stage of an open-ended test is likely different from the stress of DEC, in which the load is perceived as becoming progressively easier, especially during the stage changes. It has been shown that aerobic and anaerobic exercises produce markedly different acute responses in the levels of several hormones, which may impact on energy utilisation.78 We propose the interesting possibility that an anticipatory difference in perception of the future workload might impact the sympathetic or parasympathetic drives and lead to differences in the metabolic response during exercise.
A final intriguing finding was that higher VO2max values achieved with the ‘reverse’ protocol were retained during INCF, despite time to exhaustion did not change and subjects reached VO2max at the same speeds during INC1 and INCF. This finding was unexpected. One possible speculation is that the body retained the adaptation that caused it to use more oxygen during DEC, possibly an altered recruitment of different skeletal muscle fibre types, during the INCF.79 Indeed, a recent study80 showed that a progressive increase in VO2, the so-called slow-component phase, can occur during an all-out 3-min cycling protocol despite decreasing levels of muscle electromyographic activity and power output throughout the trial.
It is important to stress that all our trials were conducted in the space of no more than 3 weeks per participant, and VO2max is known to be reproducible over this period in highly trained subjects.81 Moreover, data from the control group show that no training effect was produced by repetitive INC testing. This is also confirmed by the lack of improvement in the time to fatigue for the reverse group in INCF despite a persistently higher VO2max. The protocol used in our study (incremental uphill running) as the standard INC has also been shown to elicit the highest VO2 responses in trained7 10 82 and untrained subjects.9 34 35 53 This protocol also fulfilled other criteria required to consider a test ‘maximal’, such as optimal duration13 and the use of participants with high levels of fitness and motivation.30 In so, the novel reverse protocol evaluated in this study produces significantly higher VO2 values that cannot be explained by measurement error or a training effect.
In conclusion, this study therefore is in direct conflict with the belief, firmly held and passionately defended12 30 83 84 for more than 80 years, that the plateau detected by conventional INC ‘beyond which, no further increase in oxygen intake can occur’(p 156)2 can be explained only by the development of a ‘limiting’ oxygen use by the exercising muscles.12 83 This finding has important implications for the interpretation of factors that might limit maximal exercise performance in diseased, in healthy and in athletic populations. In particular it establishes that subjects terminate the conventional INC with cardiorespiratory reserve.
What this study adds
▶ This study shows that oxygen consumption is higher during a decremental running test in healthy athletes than during an incremental running test, previously thought to produce the higher levels of oxygen consumption.
▶ It also shows that the plateau in oxygen consumption found during incremental tests does not represent the ceiling of cardiovascular capacity.
▶ After performing the decremental protocol, subjects apparently retained the gains in oxygen consumption during a subsequent incremental test, despite no changes in performance.
We understand that there must be an absolute VO2max for all individuals. However, our study shows that this limiting condition is not reached during the conventional INC. We further conclude that a plateau in VO2 cannot be used as an indicator that a limiting condition has been reached. The reasons why the conventional INC terminates at a submaximal ‘VO2max’ and at submaximal levels of skeletal muscle recruitment are however unclear. But our findings support the interpretation that maximal exercise during the conventional INC is terminated at the VO2max by a complex regulated process24 85 before there is a loss of homoeostasis in one of more physiological systems.48
Acknowledgments
The authors thank the contribution of Morten Tveit for his assistance during the trials.
References
Footnotes
-
Competing interests None.
-
Provenance and peer review Not commissioned; externally peer reviewed.