Article Text

Abstract
Background There is a paucity of literature examining injury and illness rates in men's professional ice hockey. This study aimed to determine injury and illness rates in the NHL over six seasons, and identify predictors of injury-related time loss in this population.
Methods This study involved an inclusive cohort of hockey players from all NHL teams competing in the 2006–2007 through 2011–2012 seasons. A standardised electronic injury surveillance system was used to report injury and illness events. The primary outcome was regular season and postseason time-loss injury/illness. The secondary outcome was man-games lost from the competition.
Results On the basis of the estimated athlete exposures (AEs), the overall regular season incidence density was 15.6 injuries/1000 AEs and 0.7 illnesses/1000 AEs. Based on recorded time on ice, the injury rates were roughly threefold higher at 49.4 injuries/1000 player game-hours and 2.4 illnesses/1000 player game-hours. There was a reduction in injury rates over the 6-year period, with the greatest reduction between the 2007–2008 and 2008–2009 seasons. Multivariate predictors of time loss greater than 10 days were being a goalie (OR=1.68, 95% CI 1.18 to 2.38), being injured in a road game (OR=1.43, 95% CI 1.25 to 1.63) and the mechanism of injury being a body check (OR=2.21, 95% CI 1.86 to 2.62).
Conclusions There was an overall reduction in the time-loss injury and illness rates over six seasons. Being a goaltender, being injured on the road and being injured by a body check were the risk factors for time loss greater than five ‘man games’.
- Ice hockey
- Epidemiology
- Sporting injuries
Statistics from Altmetric.com
Background
Ice hockey is a collision sport where knowledge of injury patterns is important for the provision of appropriate medical care. Injury rates in collegiate and professional men's leagues have reportedly ranged from 2.3 to 79.2 injuries/1000 player-hours,1–9 but there have been large discrepancies in the injury definitions and surveillance techniques used in the previous studies. Time loss following injury has been reported descriptively or has been used as an indicator of injury severity, but predictors of injury time loss have not yet been identified for elite level players.1–9
In addition, little is known about the rate of illness in this population. Engebretsen et al10 reported that 3% of the athletes who had competed in the men's ice hockey during the 2010 Winter Olympic Games reported an illness, but no other study has been published with an epidemiological approach to determining illness incidence in elite hockey leagues.
The purpose of this study was to determine the rates of injury and illness in the NHL over six seasons. The secondary aim was to identify the predictors of injury time loss in this population.
Methods
Study design and participants
This was a prospective case series examining the injury and illness incidence in an inclusive cohort of the male professional ice hockey players from all teams competing in the NHL during the 2006–2007 through 2011–2012 seasons.
In 2006, an electronic medical record (the ‘Athlete Health Management System’ (AHMS)) was implemented, which has an injury surveillance component. NHL Athletic Team Trainers/Therapists and Team Physicians documented all injuries using a standardised ‘injury/illness event’ (IIE) form for each event causing a player to miss one or more games. Medical staff were also instructed to create an IIE for each event needing medical assessment and treatment, regardless of time loss.
Team Athletic Trainers/Therapists and Physicians were present at all regular season and postseason games, and documented the date, time and period of play in which the injuries occurred. All injury/illness diagnoses were coded using the University of Calgary (UofC) Sport Medicine Diagnostic Coding System.11 They also recorded the date on which the players were medically cleared to return to an unrestricted competition. The AHMS uses the interval between these dates, cross-referenced to the team's competitive calendar, to calculate the number of games missed for each injury or illness (one ‘man game’ = one player missing one game).
Data were downloaded at the end of the season using the AHMS extraction feature that generates a Microsoft Excel spreadsheet (Microsoft Excel 2011, Redmond, Washington, USA). A simple descriptive analysis was conducted in the Excel whereas the regression analysis was performed in Stata V.13 (StataCorp 2013, College Station, Texas, USA). The extraction of data and analysis was approved by the Office of Medical Bioethics at the UofC (Ethics ID # 18969).
Outcome measures
The primary outcome variables were injury and illness, defined as any event captured by the IIE form, and restricted to those designated as practice-related or game-related, resulting in one or more man-games lost (MGL). Injuries were defined as practice-related or game-related based on the activity at the time of injury, and illnesses were defined as such based on whether they were reported by the player to have occurred at either in a game or in a practice session. Only regular season and postseason events were included. The secondary outcome was time loss, as measured in MGL from a competition.
The independent variables of interest, all extracted from the AHMS, were age, position played, mechanism of injury, affected body region, home versus away game, period of the game and part of the season (ie, regular season vs postseason).
Analysis
Descriptive statistics are presented as frequencies and proportions. An overall incidence of a game-related and practice-related injury and illness is presented, but the subsequent analyses were restricted to those designated as game-related only, due to the unavailability of practice exposure time. Athlete game exposure time was calculated using two different methods:
-
Athlete exposures (AEs) based on all NHL teams playing 82 regular season games per season, with 18 skaters and one goaltender playing for each team in each game.12 Postseason exposures were estimated based on the number of playoff games that occurred in each season, with a reduction in the number of active players as teams were eliminated from playoff contention. Because each game consisted of three 20 min stop-time periods (ie, 1 h exposure per game, per player), the number of AEs was equivalent to player-hours, with no adjustment for games that contained overtime minutes.
-
Using actual time on ice (TOI) from the http://www.NHL.com player statistics page, where the minutes and seconds played by each player were summed across each season to calculate the actual hours on the ice.
The incidence density of game-related injury was calculated as the number of injury events divided by the sum of individual AE time, allowing for re-entry into exposure for players who had returned to an unrestricted competition.
It was not possible to offset analyses for individual exposure time, as the AHMS data set does not include a record of ice time. The http://www.NHL.com statistics page only lists exposure by player name, and therefore this information could not be linked to the de-identified AHMS data. Therefore, logistic regression, adjusting for diagnostic code, affected body region and cluster by team were used to identify the OR associated with the potential predictors of MGL. For OR calculations, a five MGL cut-point, which corresponded to an average 10 days of time loss, was established because 10 or more days of time loss would constitute a ‘moderate’ or ‘severe’ injury using the classifications previously used in ice hockey.7 ,9 ,12 Risk factors (age, playing position, mechanism of injury, home vs away game and the period of play) were included in a multivariable model in a stepwise fashion to determine the effect of potential predictors on injury risk.
Results
Player characteristics
A total of 1685 individual players were included in the dataset (n=840, 843, 837, 838, 891 and 895 in each season, respectively). The sample included 1025 forwards, 566 defensemen and 94 goalies. The mean age of those reporting an injury or an illness was 31.4 years (SD=5.1; range 19–50; IQR 28–36).
Injury and illness incidence
Overall, there were 5184 on-ice time-loss injuries and 376 game or practice-related time-loss illnesses reported over the 6 years of this study. Of these, 163 (3.1%) injuries were recorded by the medical staff as reinjuries. The majority of injuries occurred during the games (88.7%), compared with the practice sessions (11.3%). A total of 40 943 man-games were lost due to injury and illness during the study period (table 1).
Man-games lost by season
On the basis of the estimated AE, the overall regular season game-related injury incidence density during the study period was 15.6 injuries/1000 AEs and 0.7 illnesses/1000 AEs, but there were differences between seasons (table 2). The incidence density of injury (incidence density ratio (IDR)=1.34; 95% CI 1.17 to 1.53) and illness (IDR=2.11; 95% CI 1.01 to 5.31) were significantly greater during the regular season than the postseason.
Game-related injury incidence density per 1000 athlete exposures (AEs) and 1000 recorded player-hours
When examined by recorded TOI, regular season game-related injury incidence density was significantly higher (49.4/1000 player game-hours) than using AE (table 3). However, compared to the estimated AE values, distributions of injuries and illnesses in the regular season and postseason were unchanged using recorded TOI.
Game-related illness incidence density per 1000 athlete exposures (AEs) and 1000 recorded player-hours
On the basis of the injury incidence values presented in table 2, the injury density during the first 2 years of this study appeared to be much larger than that in the final 4 years. There was a significant reduction in incidence during the regular season (IDR=1.66; 95% CI 0.56 to 1.76) and postseason (IDR=2.10; 95% CI 1.60 to 2.73), comparing the first two to the last 4 years. A similar pattern was seen for illness in the regular season (IDR=1.53; 95% CI 1.15 to 2.03), but not the postseason (IDR=1.54; 95% CI 0.22 to 9.10).
Injury mechanisms
The most commonly injured body regions were the head (16.8%), thigh (14.0%) and knee (13.0%; figure 1). Together these body regions also accounted for the greatest number of MGL, resulting in 16.7%, 10.5% and 15.5% of total MGL, respectively (supplementary online figures 1 and 2). The mechanism of injury categories were added to the AHMS in 2009, and were coded for 1877 (90%) injuries that occurred between 2009 and 2012. Of the cases where the mechanism was reported, body checking accounted for the largest proportion of injuries (28.2%) as well as the most MGL (29.8%; table 4).
Mechanism of injury reported during regular season and postseason games between 2009 and 2012
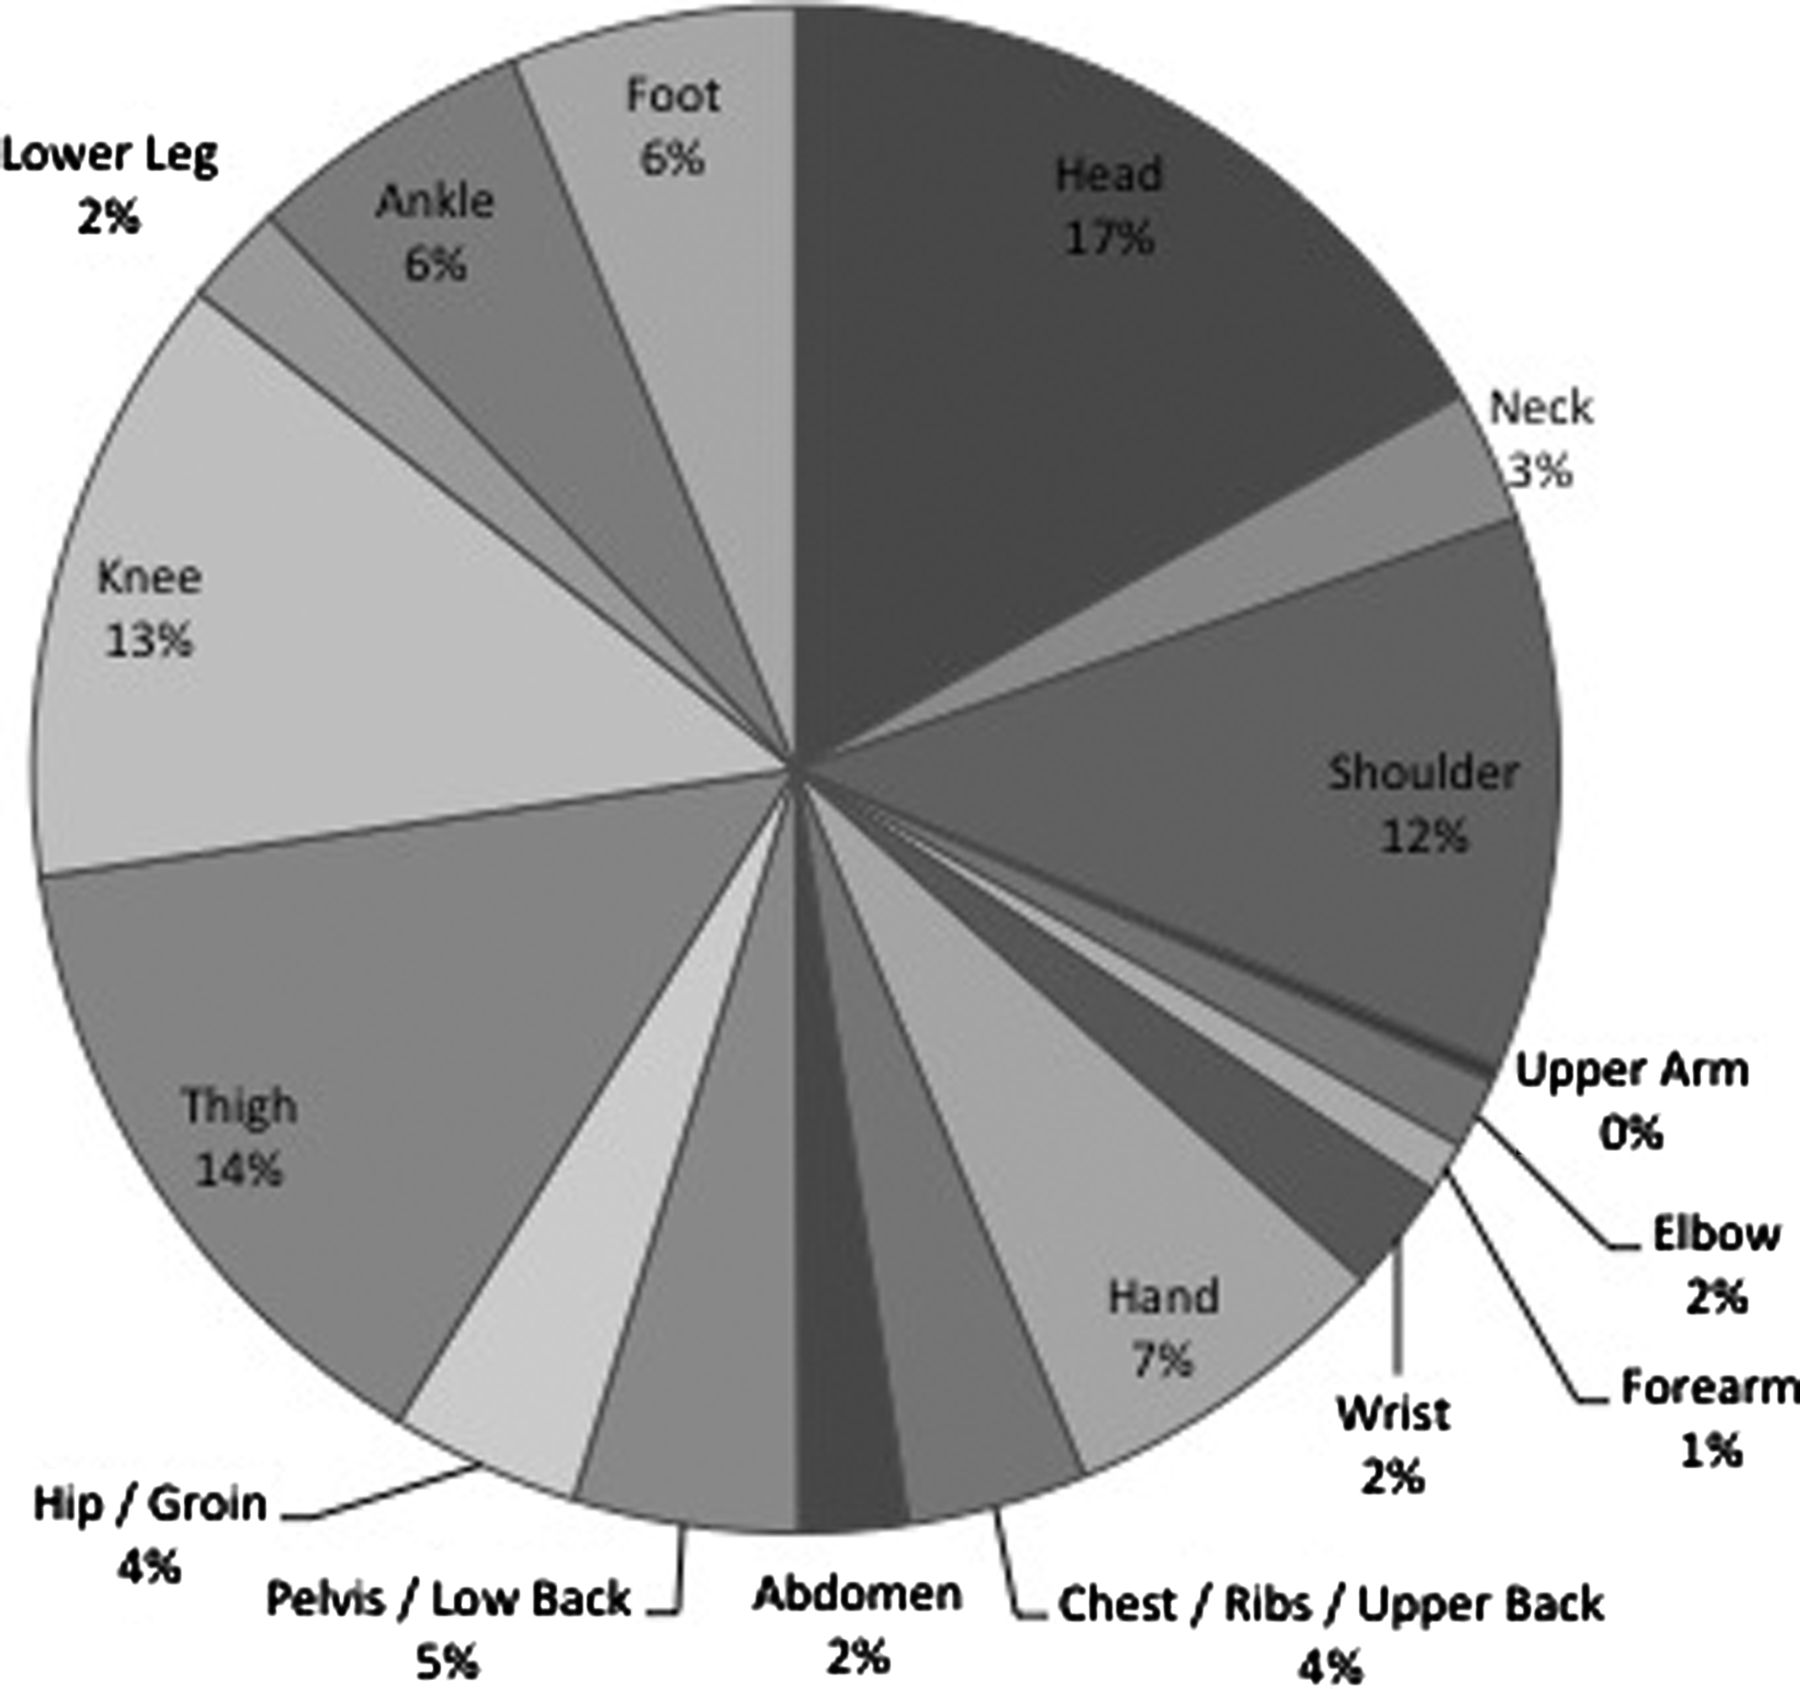
Game-related injuries by body part.
Injury risk factors
Compared with the forwards, the defensemen were more likely to report a game-related time-loss injury (IDR=1.21; 95% CI 1.14 to 1.28). There was no difference between defensemen and goalies (IDR=1.06; 95% CI 0.94 to 1.21) or forwards and goalies (IDR=0.88; 95% CI 0.78 to 1.00). There was no significant difference in the reported illness by position. These ratios were identical for estimated AE and recorded TOI.
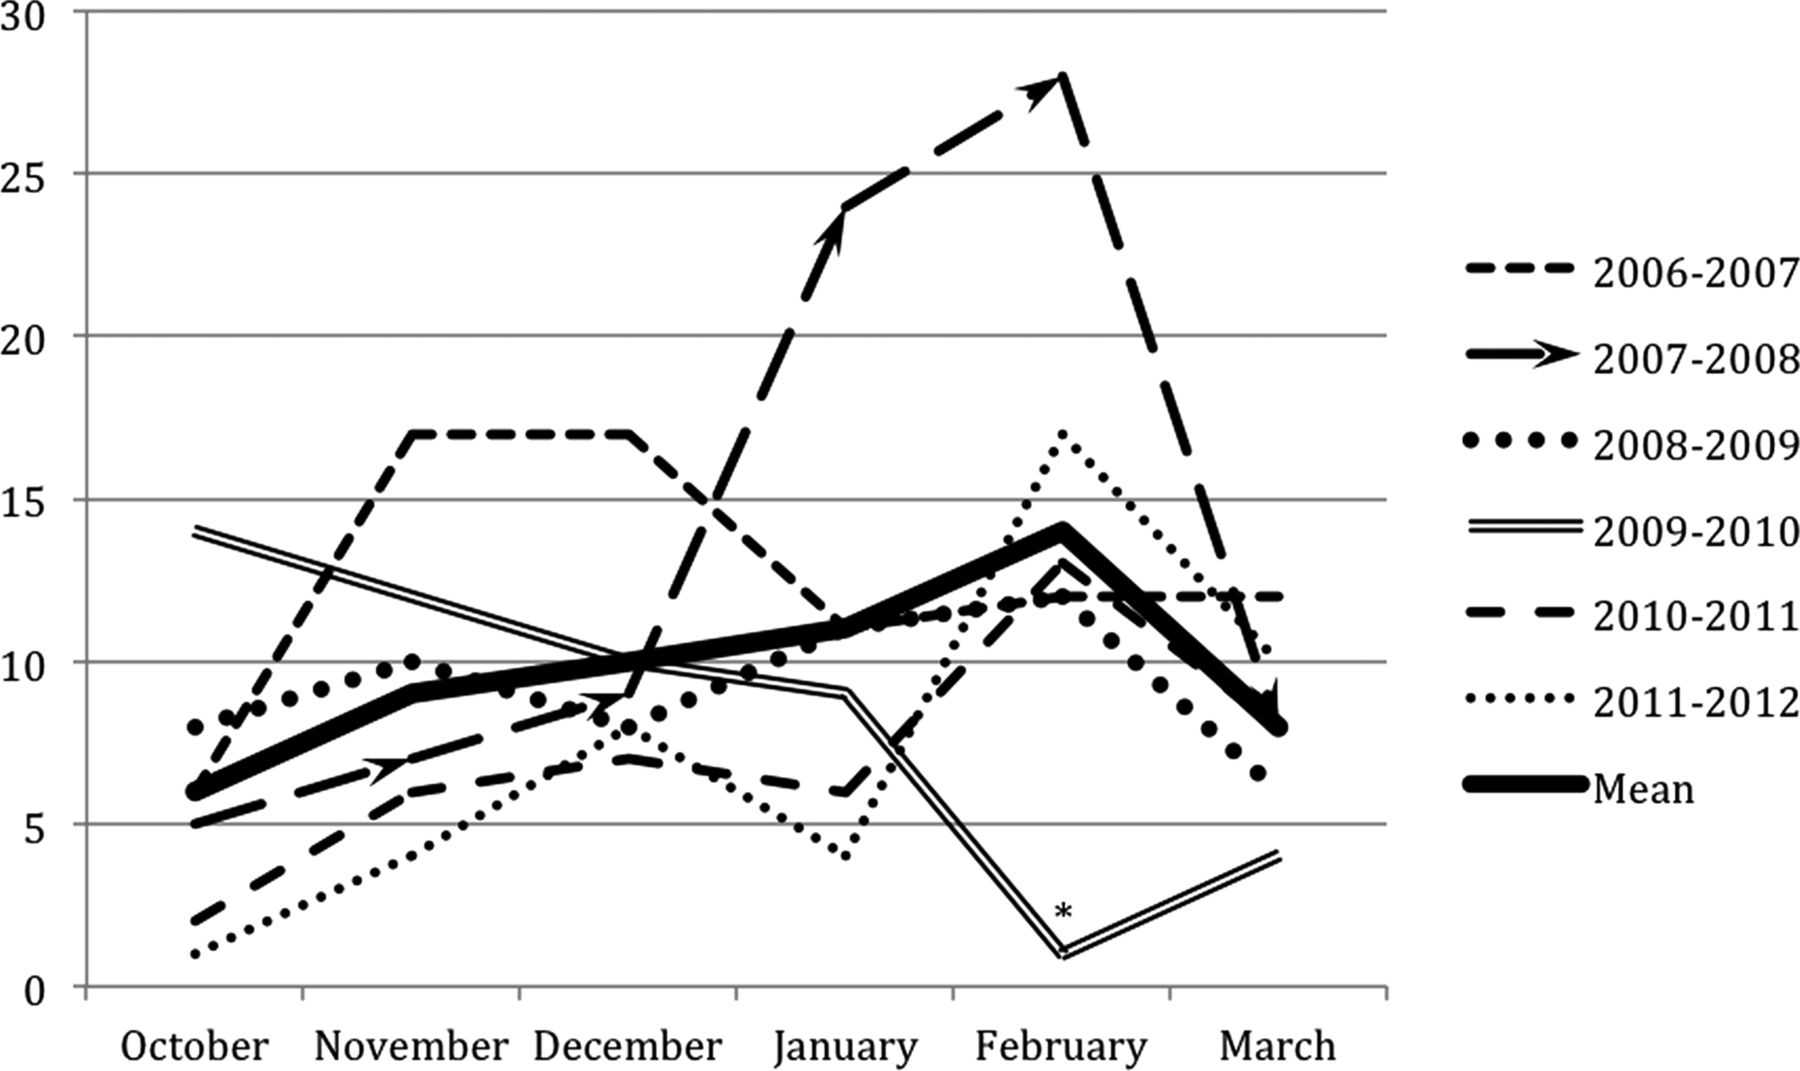
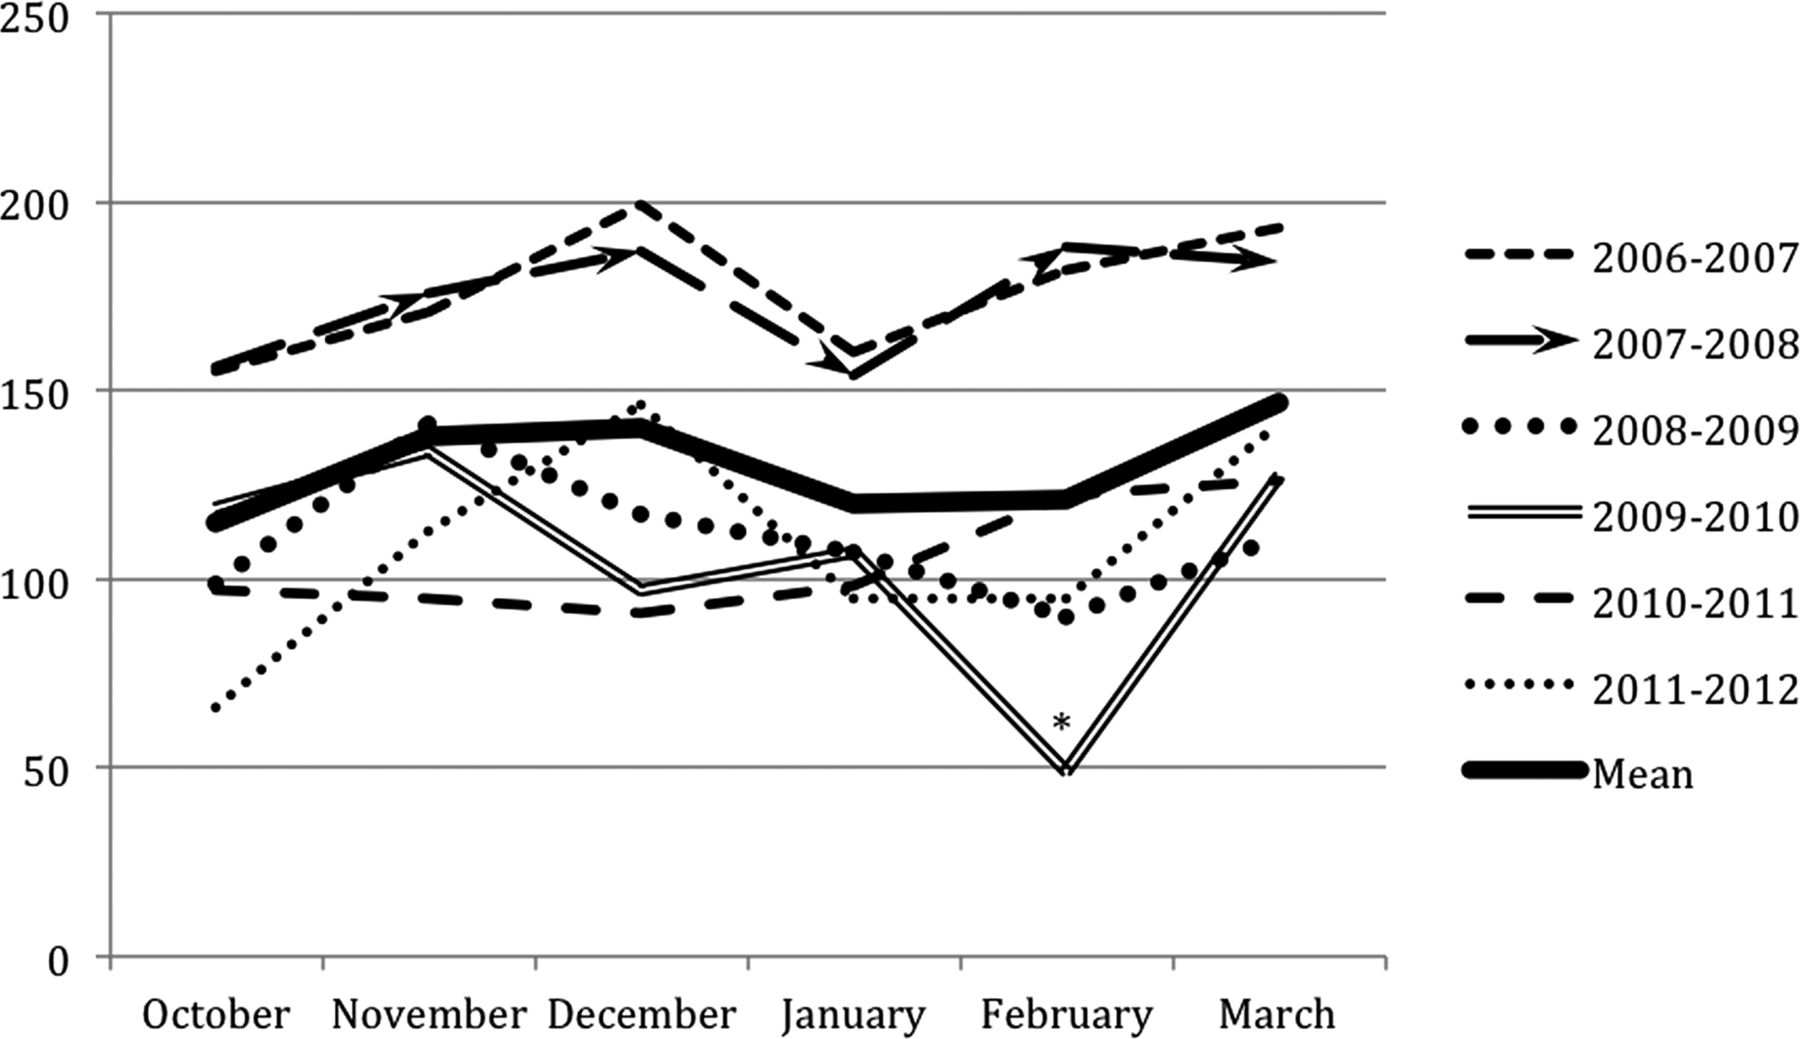
A significantly more game injuries were reported at home (2368; 51.5%) than on the road (2229; 48.5%) (IDR 1.06; 95% CI 1.01 to 1.13). The period in which the injury occurred was reported in 4529 cases (98.5%). Injuries were significantly more frequent in the first period (2177; 48.1%) than the second (1152; 25.4%; IDR 1.89; 95% CI 1.76 to 2.03) or third (1104; 24.4%; IDR 1.97; 95% CI 1.84 to 2.12) periods. Sixty-one (1.3%) injuries occurred during the pregame warm-up, and 35 (0.8%) injuries occurred in overtime. Game-related injuries and illnesses were also unequally distributed over the course of each season (figures 2 and 3). Specifically, injuries trend towards an increase nearing the end of the regular season, compared with the beginning.

Game-related injury frequency by month of the regular season. *NHL hiatus for Olympic Winter Games.
Game-related illness frequency by month of the regular season. * NHL hiatus for Olympic Winter Games.
Adjusting for diagnostic code, affected body region and cluster by team, multivariate predictors of the time loss following a game-related injury greater than 5 MGL were being a goalie (OR=1.68, 95% CI 1.18 to 2.38), being injured in a road game (OR=1.43, 95% CI 1.25 to 1.63) and mechanism of injury being a body check (OR=2.21, 95% CI 1.86 to 2.62). Age had no association with the time loss. These relationships remained unchanged when examined for time loss of 2 and 10 MGL.
Discussion
The purpose of this study was to report the rates of injury and illness in the NHL over six seasons and to identify the predictors of associated time loss. We have demonstrated that the time-loss injury rate obtained using estimated exposure is significantly lower than the rate obtained using recorded TOI. The differences in the calculations are due to the fact that the game is played in shifts, with varying participation by each player. Over a typical game with three periods of 20 min stop-time, it is uncommon for a player to be on the ice for more than 30 min in total, with the exception of goaltenders who often play the entire game.
The roughly threefold difference in incidence between the two methods reflects the mathematical effect of players, on average, accumulating 20 of 60 min of a possible playing time. This difference in the reporting of injury rates has implications for comparing the NHL injury rates with the rates from other leagues. To illustrate, the injury rate calculated using estimated AE (15.6/1000 AEs) is consistent with the rates reported for North American collegiate players (13.8–18.7 injuries/1000 AEs)1 ,2 ,13 whereas the rate derived from recorded TOI (49.4/1000 player game-hours) is more similar to the reported injury rates from the elite European leagues (66–79.2/1000 estimated player game-hours).4–7 ,9 Interestingly, published injury rates for the elite European leagues are based on the data collected prior to 2009, and these are consistent with the rates seen in the NHL in the first 2 years of our study (67.3–68/1000 player game-hours).
Also of note, many previously published studies have not differentiated between time-loss and non-time-loss injuries when estimating the injury rates, which might contribute to some differences in our results. This would not, however, account for a significantly lower injury rate in the NHL based on the recorded exposure time compared with the rates based on estimated exposure in other studies. It may be that the rate of injury in the NHL is in fact much lower than in other professional leagues, but this requires further investigation.
Most of the studies conducted in ice hockey have accounted for individual exposure time using attendance records at games and practices, but recorded TOI is not feasible to collect in many settings despite being the gold standard for exposure registration. To facilitate the between-study comparisons, researchers are advised to standardise the estimates to rates per 1000 AEs, acknowledging that in ice hockey 1 AE=1 exposure hour. There have been recent advancements in alternative registration methods, including SMS,14 ,15 which may allow more accurate exposure estimates across the age and skill levels. This may be a promising technique for future studies, although recording exposure by the minute is likely impractical in almost all settings.
Overall, there was a significant reduction in injury and illness over the last 4 years of data collection compared with the first two. Despite this overall reduction, within-season trends remained reasonably constant during the 6 years of the study. Specifically, injuries appear to occur with a greater frequency towards the end of the regular season, which contradicts the findings of Pinto et al,16 who found that the injury frequency in Junior A hockey decreased in the latter half of the season. However, given that the Junior A season consisted of only 48 games and the NHL season is of 82 games, our results are not directly comparable. In the NHL season there may be an influence of fatigue and increased playing intensity as teams attempt to qualify for the postseason, which would differ in timing from leagues with a different length of season. There was also a noticeable increase in illness during the month of February, which coincides with common influenza outbreak peaks in North America.17
Consistent with the previous studies, we found that the injury rate was significantly higher in games than in practice or training.7 ,12 ,16 ,18 We also found that the most commonly reported mechanism of injury was body checking, which is supported by the literature.2 ,7 ,9 ,13 ,18 The previous studies have found that more injuries occur in the third period of games,7 ,16 ,18 whereas our results suggest that the injuries are more frequent in the first period. Because players are not fatigued at the beginning of a game, the speed of play is likely higher and the players may be more physical, which may contribute to a greater risk of injury, but this is a speculative explanation. An alternate explanation is that, due to their high skill and fitness levels, the NHL players might not be fatigue as quickly as players in other leagues, and therefore could be at a lower relative risk of injury during the third period than participants in other studies.
Although the previous studies have consistently found that goalies are at a lower risk of injury than other skaters, there has been conflicting evidence suggesting that either forwards4 ,5 ,7 ,8 or defensemen6 ,9 ,16 are injured more frequently. In the present study, defensemen may have been at a higher risk of injury due to the physical style of play associated with that position. This is supported by our finding that incidence density ratios between defensemen and forwards are identical using both AE and TOI, suggesting that the difference is not the result of playing time differences between the two positions, but a product of the playing position itself. Additionally, we found that time-loss injuries were more frequently reported during home games than road games, possibly due to the immediate accessibility of the home team physicians in home arenas.
The predictors of time loss greater than 5 MGL were being a goalie, being injured by a body check and being injured during a road game. Other factors that were associated with injury incidence (ie, time of season, age and game period) did not predict time loss when included in our multivariable model. Owing to the physical demands of the goaltending position and the importance of goaltending to team performance, additional caution may be taken when clearing these athletes to return to play following injury. This would account for the greater time loss reported for goaltenders, even after adjusting for injury type and location. Body checking is an important factor in time-loss injuries, particularly because it is the most frequent mechanism of injury in the NHL. Finally, time loss may be elevated for injuries sustained on the road due to the reduced accessibility of team physicians and immediate referred services away from home.
Limitations
The data included in these analyses were collected through Team Trainer/Therapist and Physician reports, and the extent to which injuries were under-reported could not be measured. It is also unknown whether different reporting and return-to-play practices existed between the physicians of different teams. However, the utilisation of the AHMS is mandatory within the NHL, and the injury surveillance occurs seamlessly in the background, so the potential under-reporting is likely to be of a minimal bias. One of the strengths of the study is that the AHMS system has enabled a consistent data collection to occur over six seasons, which is often a challenge in other cohort studies due to a diminishing compliance over time.
The mechanism of injury categories were only coded for a portion of injuries occurring between 2009 and 2012, so the accuracy and completeness of these data are limited. Consequently, there was a reduced sensitivity to account for changes in mechanism of injury trends over the duration of our study. The generalisability of our results is limited to the adult male professional ice hockey players.
Conclusions
This study provides evidence that there was an overall reduction in the time-loss injury and illness rates between the 2007–2008 and 2008–2009 NHL seasons. Being a goaltender, being injured on the road and being injured by a body check were the risk factors for time loss greater than five man games.
Because different conclusions about injury and illness risk may be drawn based on the denominator used in rate estimates, it is recommended that the future studies be consistent in documenting and reporting their method of calculating exposure.
What are the new findings?
-
Injury rate estimates were approximately three times greater when using recorded time on ice instead of estimated exposure hours as the denominator.
-
There was a significant reduction in the time-loss injury and illness rates over the 6-year period of the study.
-
Being a goalie, being injured in a road game and being injured by a body check were the significant predictors of time loss greater than 5 man games.
How might it impact on clinical practice in the near future?
-
Injury rate estimates should be standardised to injuries/1000 athlete exposures to enable the between-study comparisons.
-
Medical management of injuries sustained in the road games should reflect the increased risk of time loss greater than 10 days associated with injuries sustained away from the home arena.
-
Injury prevention efforts should focus on the head, thigh and knee injuries.
Acknowledgments
The authors would like to thank the Athletic Trainers/Therapists, as members of the Professional Hockey Athletic Trainers' Society (PHATS), and the Physicians, as members of the National Hockey League (NHL) Team Physicians' Society (NHLTPS), for their consistent effort and time to record injuries and illnesses in this group of athletes. The authors also thank the National Hockey League for their leadership in establishing the electronic injury surveillance system in conjunction with the National Hockey League Players Association (NHLPA). The final manuscript was reviewed and approved by the NHL and NHLPA.
References
Supplementary materials
Supplementary Data
This web only file has been produced by the BMJ Publishing Group from an electronic file supplied by the author(s) and has not been edited for content.
Files in this Data Supplement:
- Data supplement 1 - Online figures
Footnotes
-
Contributors WHM designed the study and is responsible for the overall content. CDM, RJT and BS prepared the manuscript.
-
Competing interests None.
-
Ethics approval Office of Medical Bioethics at the University of Calgary (Ethics ID # 18969).
-
Provenance and peer review Not commissioned; externally peer reviewed.
-
▸ References to this paper are available online at http://bjsm.bmj.com