Article Text

Abstract
Objectives—To determine in Australian football (a) the influence of ground hardness and playing grade (level) on game speed and structure, and (b) player movement patterns throughout the game and across levels.
Methods—The design consisted of several studies. Seventeen games played on grounds of different hardness in 2000 were used to determine game speed and structure. Four first grade and four second grade grand final games (1994, 1996, 1997, 1999) were used to determine the game speed and structure on the same ground but at different levels. Fifty one players (44 first grade and seven second grade) were used to measure movement patterns within games and across levels during the 2000 season.
Results—There was a significant relation between ground hardness and game speed, which could lead to higher injury rates when the ground is harder. There was a 6.7% difference in game speed between the first and second grade levels reflecting differences in injury incidence. The first grade games were also characterised by a greater number of shorter, high intensity play periods and longer stop periods than the second grade games. Midfield players in the first grade games covered about 24% greater distance than their second grade counterparts, and there was a significant difference in their playing speeds.
Conclusions—Over the past 40 years, the game speed in the top level of Australian football has approximately doubled. Over the same time, the number of collisions and the estimated injury incidence have also doubled. This study provides additional support to the suggestion that these variables are strongly linked. Factors such as ground hardness, playing level, and time during the game influence game speed and are therefore important in injury development in Australian football.
- aetiology
- injuries
- Australian football
Take home message
Injury patterns in elite Australian football are associated with the game speed. Game speed is influenced by player fitness and fatigue, competition level, rules, and ground hardness.
Statistics from Altmetric.com
The earliest surviving record of the rules of Australian football are those produced in 1859 by the Melbourne Football Club and now housed at the Melbourne Cricket Ground museum. The first recorded game was in 1858 at interschool level in Melbourne. It is thought that Australian football developed from a combination of football games played throughout the early Australian colonies at this time, including the British rugby codes, Gaelic football, and a “football” game played by Australian Aborigines.1 Australian football is played as four 20 minute quarters with a five minute break between quarters and a 15 minute break at half time. The game has evolved over the decades resulting in the formation of the national Australian Football League (AFL) in 1990. This “first grade” national competition involves professional athletes playing in 16 teams based in five of the six states of Australia. There are also state based leagues, which are referred to in this paper as “second grade” levels. The oval shaped grounds can vary from 135 to 185 m in length and from 110 to 155 m in width at the centre line.
Over the past decade, elite Australian football has changed considerably in terms of player preparation, speed of the game, skill level, and financial incentives offered.2 Australian football currently has the largest adult spectatorship and one of the highest participation rates of any children's sport in Australia.3 However, it is a collision sport and the injury rates are among the highest for any sport played in Australia.4–,8 The high injury toll at the elite level has an effect on the players' potential career earnings and their personal well being. Australian football may also impact on long term health as it has been shown to be associated with chronic injuries and incapacitation in retired players.9
The high level of injury poses a considerable threat to the viability of the game over the longer term because many potential players may be turned away from it for fear of incurring injuries during their playing careers. It has been estimated that nearly a quarter of a million Australians in 1995 had a sports related injury that led to them discontinuing a sporting activity.3 Sports injuries in general are costly to the community, influencing the Commonwealth Department of Health to list injury prevention and treatment as one of the four national health priority areas in 1998.10 It has also led to the AFL establishing a database of injuries at the elite level.6
Several studies have investigated a range of factors that may affect injury incidence.2,6,7,11,12 Although it is unlikely that any factor acts in isolation, two main factors have been proposed: the hardness of the ground surface11 and the general speed and “structure” of the game.2 Some convincing evidence has been presented to support both hypotheses,2,11 but no attempt has been made to link these, or other, factors in the aetiology of injuries in Australian football.
The specific aims of this study were to:
evaluate the interplay between ground hardness and game speed and structure in the AFL;
measure the differences in game speed and structure between the Australian football first and second grade levels of competition;
measure player movements continuously throughout the first and second grade games to determine the instantaneous and mean player speed at any time in the game;
combine the results of this study and those of our other studies (evolution of collisions and game speed) with what is known of injury epidemiology in Australian football to propose a model of injury development.
Methods
GROUND HARDNESS
Ground hardness measures (using a penetrometer) for 173 AFL games played in 2000 were obtained from the database of the AFL medical Officers.6,13 Of these, 17 (non-rain-affected) games were selected from seven grounds to represent the range of ground hardness conditions that the players are exposed to during the season. The matches were randomly chosen from within each of three “bands” of ground hardness conditions: five games played when the grounds were “hard” (penetrometer ≤3.2 cm), four played on grounds that were “soft” (penetrometer >6.5 cm), and eight games played on grounds of “intermediate” hardness (penetrometer 3.5–5.3 cm).
VIDEO ANALYSIS FOR GAME SPEED
Each of the 17 games was reviewed for game speed using a computer based tracking system that we have used previously.2 This system allows the ball to be followed on a calibrated scaled version of the specific ground as a recorder views the video. We use the ball speed during the play periods as a surrogate for game speed.2 The distance the ball travels and the time taken are automatically recorded. Repeated trials of eight quarters of tracking the football in this study produced a reliability measure (intratester technical error of measurement (TEM)) of 4.7% for distance travelled and 0.1% for time taken. We previously reported reliability levels at 6.5% for distance travelled,2 but our system has been improved over time by software modifications, the use of drawing pens and tablets to track the movements, and greater experience of our trackers.
Our validity checks involved 97 trials of a player running over a range of marked courses set up on the football field. The actual distances (18.1–180 m) were unknown to either the player or tracker. There was a relative TEM of 9.1%. We also recorded the time of play and stop periods as we have previously described,2 which allowed us to evaluate the game structure.
VIDEO ANALYSIS FOR GAME SPEED AND STRUCTURE BETWEEN COMPETITION LEVELS
Eight additional (non-rain-affected) games were used for this study. The first and second grade grand final games in the years 1994, 1996, 1997, and 1999 were chosen because they were all played on the same ground (Melbourne Cricket Ground). Although ground hardness measures were not recorded, this approach allowed comparisons across levels while maintaining consistent ground hardness (within years). It also represented the best chance to standardise the degree of player motivation and fitness. Game speed and structure were measured as described above.
MEASUREMENT OF PLAYER MOVEMENTS DURING THE GAME
Player movements during the game were measured in real time using the computer based tracking system described above. A total of 44 players were measured in 16 first grade (AFL) games conducted at three AFL grounds. We also recorded seven players from three second grade matches. We tracked these players continuously from elevated midfield positions in the stadia and recorded their movements and mean speed at 1.0 second intervals. We also recorded total distances travelled and a breakdown of their speed categories. These data are to be presented more fully in a separate paper but are summarised here to lend support to our model of injury development.
STATISTICAL ANALYSIS
Linear regression was used to assess the relation between game speed and surface hardness. Unpaired t tests were used to determine differences between first and second grade game speeds. Game structure (play and stop periods) between competition levels and between the extremes of ground hardness conditions were compared using Mann-Whitney U tests. TEM was determined by the methods of Pederson and Gore.14 Two tailed levels of significance were set at p<0.05 unless otherwise stated.
Results
GROUND HARDNESS AND GAME SPEED
Figure 1⇓ illustrates the relation between game speed and ground hardness. There was a significant relation between ground conditions and speed of the game (r = 0.63, p<0.01).
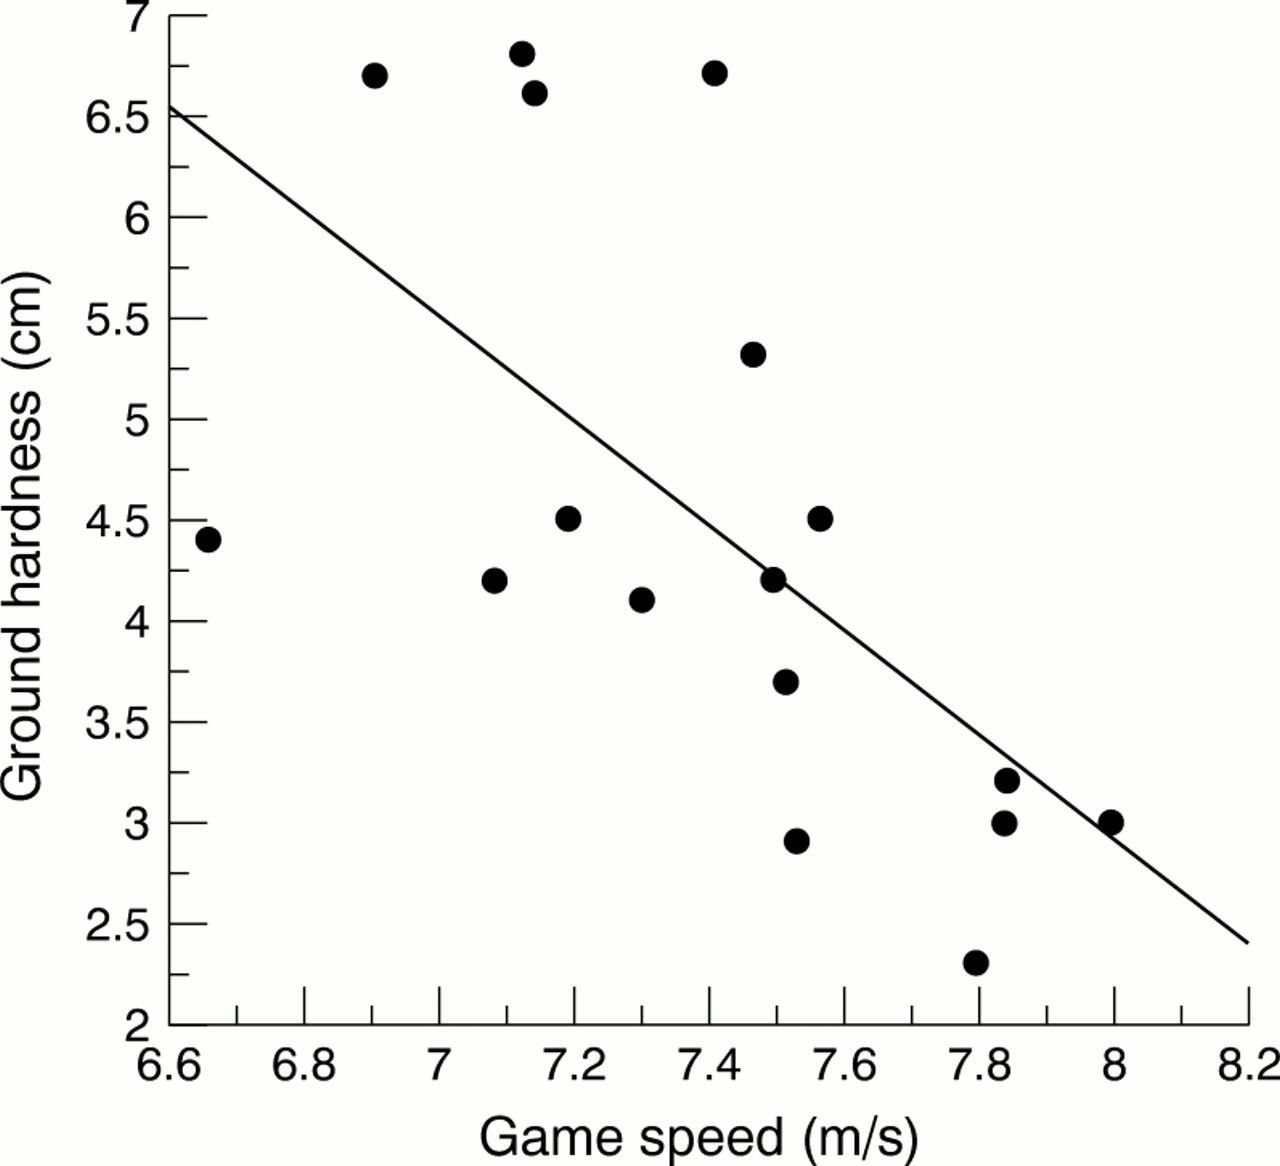
Relation between ground hardness (penetrometer readings in cm; low values represent harder ground and high values softer ground) and game speed (m/s). Softer playing surfaces are associated with slower game speeds and harder surfaces are associated with faster game speeds (r = 0.63, p<0.01).
Games played on the four softest and five hardest grounds were combined and analysed for game structure. There were significant differences in the length of play periods and stop periods (p<0.05) such that the games on the soft grounds were slower and also involved longer play periods and shorter stop periods. Conversely, the games played on the hard surfaces were faster and involved more shorter play periods and longer stop periods. There was also a significant relation between game speed and total scoring shots during the game (r = 0.69, p<0.01).
GAME SPEED IN FIRST VERSUS SECOND GRADES
The game speeds for the first and second grades averaged across all games were 28.7 and 26.9 km/h respectively (t = 3.2, p<0.05). Therefore the first grade games were about 6.7% faster than the second grade when played on the same ground hardness. Figure 2⇓ shows the frequency distributions of play periods for the Australian football first and second grades. The structure of the first grade game consists of a greater number of shorter play periods (conducted at a higher intensity).
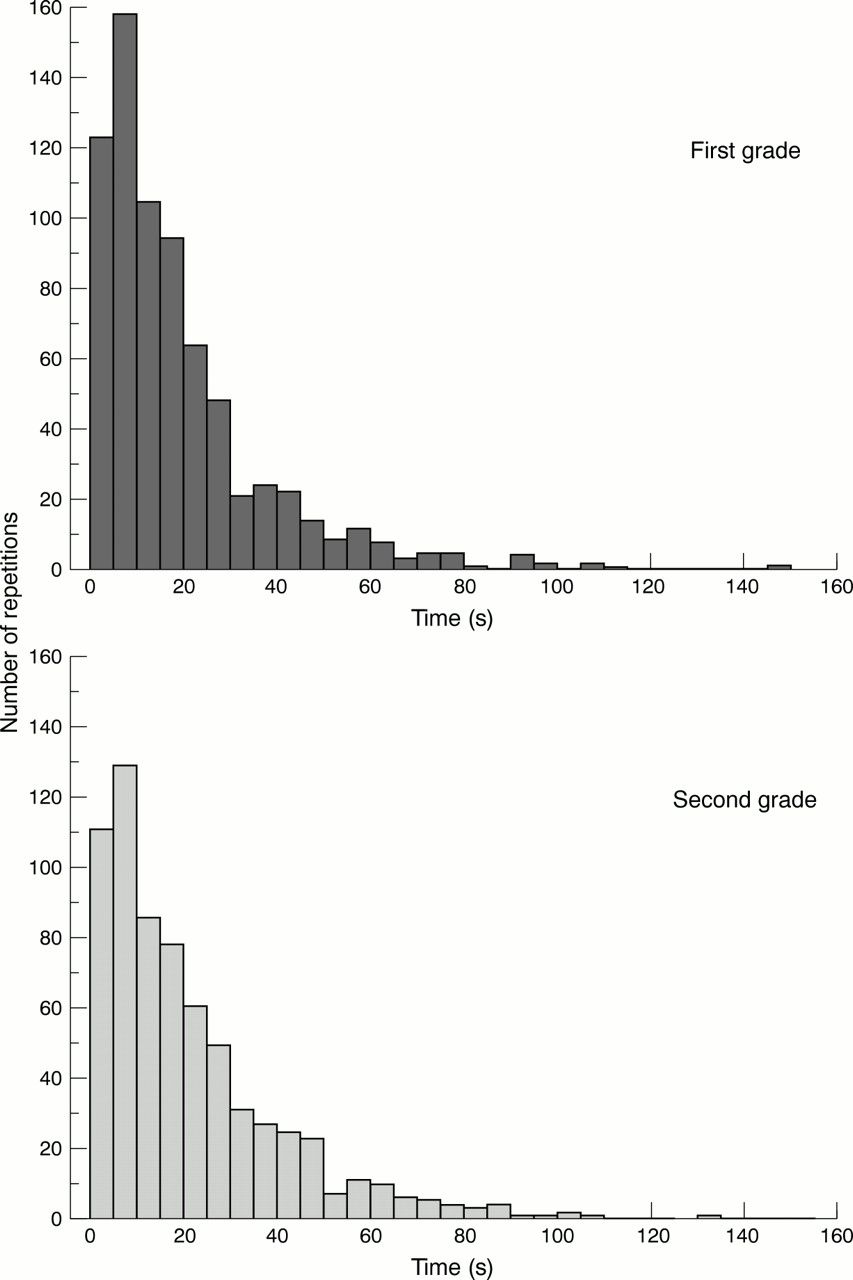
Frequency distributions of the play periods for the first grade (mean (SD) and median times were 19 (19) and 13.6 seconds respectively) and second grade (reserves level) games (21 (18) and 15.2 seconds respectively). The average velocities were 7.96 and 7.46 m/s for the first grade and second grade games respectively. Therefore the first grade game is about 6.7% faster than the second grade. Mann-Whitney U test for differences in play time periods between the two levels was significant (p<0.05), indicating that the first grade play periods were significantly shorter than in the second grade games.
MEASUREMENT OF PLAYER MOVEMENTS DURING THE GAME
Figure 3⇓ illustrates the overall mean speed curve when all first grade players have been combined across all quarters of the game. It is evident (and consistent) that players begin each quarter at a high intensity and then, as the game settles down and a play pattern emerges, they adjust to a relatively constant mean speed. The mean speed differed considerably among the players, reflecting differences in fitness and involvement in the game. The general “power curve” pattern shown in this graph is consistent across almost all players. An analysis of player movements also showed that first grade midfield players averaged about 24% greater distance in a game than their second grade counterparts (16.8 v 13.6 km). There was also a significant difference in mean player speed between the two midfield groups (8.86 (1.2) v 8.24 (0.9) km/h; t = 1.86, p<0.01).

Mean movement speed when all players are combined during each quarter of the first grade games analysed. Each quarter has a similar shape in that it begins at a relatively high mean speed and then decreases slowly across the quarter. Note the fact that the players are generally moving faster in the 1st and 3rd quarters and slower in the 2nd and 4th quarters. All quarters are significantly different from one another (p<0.01).
Discussion
This study brought together a number of elements influencing the patterns of game speed and structure of Australian football that may also provide insight into the causes of injury. Previous work has suggested that playing surface conditions, competition level, game speed and game structure, and collisions are associated with injury patterns in the AFL. The nature of these interactions is unknown. Therefore this study investigated these variables in Australian football games. An analysis of collision patterns in Australian football is presented in a separate paper but is also used here to support the model of injury development in Australian football.
INJURY PATTERNS
Australian football is one of the most dangerous sports with regard to both acute and long term injury potential. It is a high speed contact sport in which very few players wear any form of protective clothing such as padding or helmets. Finch and Ozanne-Smith15 found that between 1989 and 1993 14% of adults and 17% of children in all the emergency room cases in Melbourne hospitals had sports related injuries. They also reported that Australian football had the highest proportion of sports related presentations for adults (21.6%) and second highest for children (11.3% of cases; second to cycling).16 Baquie and Brukner17 found that Australian football was the leading cause of injuries (13.3%) presented at a Melbourne based sports medicine clinic over a 12 month period. Grimmer et al4 reported injury patterns in 3538 primary and high school students (boys and girls) in the three weeks preceding the questionnaire. Australian football ranked third highest (behind martial sports and hockey) for the rate of all injuries sustained playing sports. The percentage of participants injured playing Australian football during the survey period was 58.4. The most common mechanism of injuries in Australian football was “bumped into” (21.9% of all injuries), followed by “landed badly” (15.9%), “fell” (10.2%), and “tripped” (9.8%). As the intensity of playing/competition increases, there is increasing injury rates in Australian football.4,5 This was also shown by Orchard et al6,18 in studies in which injury incidence was significantly higher in the AFL than lower grade competitions. Importantly, these authors also reported a 25% lower incidence of injury in second grade than first grade competition.6
LINK BETWEEN GROUND HARDNESS AND GAME SPEED
Orchard and colleagues19–,22 indicated that ground hardness is an important factor in injury statistics in Australian football. Ground hardness was assessed immediately before each game at 20 positions on the playing surface using a penetrometer.6,13 Orchard's data show that injury rates were higher when grounds were drier (harder).20 Furthermore, they reported a significant relation between knee injuries and the rainfall in capital cities over the past few years.11
Our analyses show that increased ground hardness is associated with increased game speed. Figure 1⇑ shows that game speed increases as the ground hardness increases. It is also likely that faster games promote increased mean player speeds. For example, our previous work showed a relation between game speed and player speed when analysed over four decades.2 The present study further supports this observation, as the first grade game speed was about 6.7% faster than the second grade and there were also correspondingly higher player speeds in the first grade. Therefore, all other things being equal, collision impact forces among players will be significantly increased in the first grade. Combined with the lower surface cushioning properties and the reduced traction when changing direction or decelerating, these factors may contribute to the increased injury patterns on harder grounds.
In a similar pattern to the first and second grade game structures, the games on hard ground are characterised by faster play and more frequent and significantly longer stop periods. There are also significantly more scoring shots in the faster games (on harder grounds) than in slower games (on softer grounds). It is difficult to know exactly why, because it is a somewhat circular argument. The faster game may lead to more rapid fatigue which requires more frequent and longer stops. It may be that the umpires find it difficult to keep up with a faster game, and, when they take control in a stop period (a ball up or boundary throw in), they take a little extra time to recover themselves and in the process allow the players extra recovery time. They may also deliberately wait for players to recover because umpires took 67% longer to restart the game in 1997 than in 1961.2 In this previous paper, we also showed that higher scores lead to more frequent and longer stops. This allows more complete recovery and a higher game tempo and so on. Consequently, it is easy to see how there is a “circular” feature to this play pattern.
LINK BETWEEN GAME SPEED AND COLLISIONS
This study shows that variables such as player level, modern football, ground hardness, the quarter, and the time in the quarter are all associated with game speed. These variables also modify the structure of the game, which in a fast game leads to more, shorter, higher intensity play periods and longer and more frequent stop periods. But what evidence is there that fast games result in more (or more serious) collisions? Cause and effect is impossible to show, but results from our study on collisions in Australian football show significantly more collisions early in the quarter when game speed is high (Schwerdt and Norton, unpublished data). Players are averaging a greater mean speed at this time of the quarter (fig 3⇑). As the player speed falls across the quarter, and changes from quarter to quarter, the corresponding collision rates change (probably as a result of fatigue and recovery). Finally, game speed over the past 40 years has approximately doubled.2 Notwithstanding the difficulties in comparing data across long periods of time, it has been estimated that injury incidence (injuries per 1000 player hours) at the elite level in Australian football has risen almost twofold since 1947–1965.8 At the same time, today's players can expect about twice as many significant collisions during each game compared with games of the 1960s and 1970s (Schwerdt and Norton, unpublished data). Previous studies, although varying in definitions of “collisions” and/or “contact”, indicate that 44–72.5% of all injuries in the first grade are due to collisions (most of these were player-player contact6,23).
Overall, injury incidence in Australian football is high, and increases as game speed increases both across competition levels (independent of ground hardness) and in association with hard grounds. Furthermore, our research shows that patterns of collisions during a game (which are predictors of injury rates) mirror game speed, lending further support to the thesis that game speed is the central element in the aetiology of injury.
PUTTING IT ALL TOGETHER: INJURY MODEL
Figure 4⇓ presents our model of injury development. This shows the possible interactions of variables that we know or suspect are associated with the main correlates of injury: game speed and collisions. This creates a dilemma: on the one hand, the media and spectators want to see a fast game with rapidly changing fortunes and yet, on the other hand, this increases the likelihood of collisions and injuries.

Theoretical model showing the possible inter-relations among a number of variables known to be, or suspected of being, involved in Australian football injury patterns. The key element is game speed, which may impact directly on injury rates (smaller contribution) and player collisions. Collisions, in turn, are associated with most injuries. Variables known to be related to game speed include competition level, time in the game, and ground hardness. Many other variables may influence game speed, including: rules—for example, time wasting, penalties, blood rules; rule modifications, such as the increase in interchange players, umpire numbers and style; ground conditions (size, turf type); player fitness; coaching/player game plans. There are also direct links from “ground characteristics” to injuries. This reflects the fact that contact with a hard ground is more often likely to result in injury than contact with a soft ground, independent of collisions. Also the relation between “physical demands on players” and injuries, although speculative, probably involves more injuries when players are not fully recovered, are not receiving adequate rehabilitation, or are playing too many games over a short period of time. Acute injuries will be influenced by player protective clothing (for example, helmets, thigh and shin pads, and shoulder pads), their age, body size, and strength development. There is also a possible link between injury statistics and player position and anthropometry.6
The nature of contemporary Australian football with its high (and rising) level of physical contact, the increasing speed of larger and fitter players, and the growth of professionalism (media and spectator support and rules that promote this—for example, the mandatory 30 second commercial break after a goal—and player payments and expectations) interact in ways that lead to increased injury statistics and games missed. It is unlikely that injury rates will decrease significantly unless either game speed is reduced through rule changes and/or it is made mandatory to wear protective clothing (both likely to be unpopular as the spectacle of the game may be appreciably altered). The best outcome would be to mould the game into a slower one yet create the perception that it is actually played at a faster speed. The hybrid international rules game against Ireland is a good example of this tactic.
Acknowledgments
We thank the Australian Football League for their financial support allowing us to undertake much of this work, and Dr John Orchard for the data on ground hardness.
Linked Articles
- Original article