Article Text

Abstract
Objectives: To assess injury patterns and incidence in the Australian Wallabies rugby union players from 1994 to 2000. To compare these patterns and rates with those seen at other levels of play, and to see how they have changed since the beginning of the professional era.
Methods: Prospective data were recorded from 1994 to 2000. All injuries to Australian Wallabies rugby union players were recorded by the team doctor. An injury was defined as one that forced a player to either leave the field or miss a subsequent game.
Results: A total of 143 injuries were recorded from 91 matches. The overall injury rate was 69/1000 player hours of game play. The injury rates in the periods before (1994–1995) and after (1996–2000) the start of the professional era were 47/1000 player hours and 74/1000 player hours respectively. The lock was the most injured forward, and the number 10 the most injured back. Most injuries were soft tissue, closed injuries (55%), with the head being the most commonly injured region (25.1%). The phase of play responsible for most injuries was the tackle (58.7%). Injuries were more likely to occur in the second half of the game, specifically the third quarter (40%). The vast majority of injuries were acute (90%), with the remainder being either chronic or recurrent.
Conclusions: Injury rate increases at higher levels of play in rugby union. Injury rates have increased in the professional era. Most injuries are now seen in the third quarter of the game, a finding that may reflect new substitution laws. There is a need for standardised collection of injury data in rugby union.
- rugby union
- injury
- international
- professionalism
Statistics from Altmetric.com
Rugby Union is an international sport ranking second in participation only to soccer as a football code.1 The sport’s governing body is the International Rugby Board (IRB), and there are currently 92 member unions.2 Each member union generally represents one country. In the last 15 years, there has been a considerable increase in participation and interest in the sport in Australia, particularly in schoolboy and junior teams.3 This is due in part to the success of the Australian national side, the Wallabies. Every four years, the IRB administers an international tournament, the Rugby World Cup. The Wallabies’ successes include two Rugby World Cup victories (1991 and 1999).
Increased participation in the sport may also be linked to the onset of full professionalism in October 1995. There are now considerable financial rewards to be gained from involvement and success at an elite level. In Australia, there are over 100 professional rugby players. These players are drawn from the three provincial teams (NSW, QLD, and ACT), for which squads of 30–40 contracted players exist. Recent contractual changes have led to salary increases, making the average salary the highest of any of the football codes in Australia.4 Many Australian players who do not receive contracts with the three provincial teams are now playing for wealthy professional club teams in Europe or the United Kingdom. As yet, Australian clubs are not as well financed.
The objective of this study was to assess injury patterns and incidence in the Australian Wallabies rugby union players from 1994 to 2000. These injury patterns and rates were compared with those seen at other levels of play, and also before and after the start of the professional era.
METHODS
During 1994–2000, detailed medical records were kept on all Australian Wallabies players. All injuries were recorded. An injury was defined as an event that forced the player to either leave the field or miss a subsequent game. Players were actively managed with professional medical care during the injury period. If the subsequent game was not played the following week, medical staff reviewed the injured player until it was felt that he was able to return to play. This time frame was recorded. The severity of the injury was arbitrarily classified as mild, moderate, or severe. Mild injuries resulted in the player missing up to one game only (up to one week), moderate injuries resulted in the player missing two or three games (one to three weeks), and severe injuries resulted in the player missing more than three games (more than three weeks). Injuries were further subdivided into those that occurred before (1994 and 1995) and after (1996–2000) the start of the professional era.
A standardised Australian rugby union injury data form was used to collate injury data for each match and training session. All training sessions were monitored. A sports doctor recorded details of injuries. Injuries were further classified according to a number of variables: site of injury, position of player, mechanism of injury, type of injury, time and place of injury, whether the injury was acute or chronic, and the severity of injury.
In the collation of injuries per position, the final injury toll was halved for those positions for which two players were represented (such as flankers and props) to allow valid comparison with those positions represented once only.
RESULTS
Prospective data were recorded from 1994 to 2000. During this time the Australian rugby union team played 73 Test matches and 13 non-Test matches. In addition, five Australia “A” matches were played. Therefore, 91 matches in total were played by elite Australian rugby players.
The 91 games from 1994 to 2000 were studied. This equated to 1820.3 player hours of game time (this figure includes 20 minutes of extra time played in the 1999 World Cup semifinal). Practice time varied greatly during the study period, and so has not been estimated. Eighty two players participated through the seven seasons of the study. In total, 148 injury events were recorded over the study time frame. Five of these were medical conditions and were excluded from the final injury total. Therefore, 143 injuries were recorded for analysis; 126 occurred during a game, and 17 during training. This equated to 69 injuries/1000 player hours of game play, or 0.09 injuries per player per game. The injury rate before the start of professionalism in 1995 was 47 injuries/1000 player hours of game play, and after (1996–2000) it was 74 injuries/1000 player hours of game play.
Position injured
Table 1⇓ shows the year by year breakdown of injuries by position. Positions represented twice, such as wingers, had their total injury toll halved to allow valid comparison with positions represented once. The locks were the most injured players, followed by the number 8. The number 10 was the most injured back. By far the least injured position was the halfback (number 9). Backs, who comprise 46.7% of the players, received 40.8% of the injuries. Forwards comprise 53.3% of the players, but experienced 59.4% of injuries. The tight five (props, hooker, and locks), who comprise 33% of the team, were slightly disproportionately represented, with 39% of the injuries.
Numbers of injuries to elite Australian rugby union players by position
Site of injury
The head was the most commonly injured body site, with 25.1% of total injuries (table 2⇓). Of these, 75% were lacerations requiring suturing, 19.4% concussions, and 5.6% were fractures (one orbital blow-out fracture and one nasal fracture). Concussions were not graded, rather injured players were regularly monitored and decisions on return to play based on symptoms. Using such a system, most players with minor head injuries either did not leave the field or recovered fully before the subsequent game, and so did not meet our injury definition. The next most injured body sites were the knee (14.0%) and the thigh (13.6%), with the ankle comprising 10.5% of injuries. The knee accounted for 25% of the severe injuries, and 40% of injuries to the knee were severe; 50% of these severe knee injuries were medial collateral ligament tears. Of the thigh injuries, 53% were hamstring strains or tears, 37% contusions/“corks”, and 10% quadriceps strains/tears.
Numbers of injuries to elite Australian rugby union players by anatomical site
Both the hand/finger and the shoulder were disproportionately represented by severe injuries, with 62.5% of the hand/finger, and 55.6% of the shoulder injuries being severe. Together they accounted for 31.2% of the severe injuries. Some 80% of the severe injuries to the hand and fingers were fractures (two Bennett’s fractures, one 3rd metacarpal and one fracture/dislocation of a proximal interphalangeal joint). Eighty percent of severe injuries to the shoulder were dislocations, all requiring open shoulder surgery (stabilisations and rotator cuff repairs); 50% of those requiring stabilisations also required rotator cuff repairs. All players made a full recovery.
There were only two severe injuries to the neck during the study time frame. One was a C5 neurapraxia, which resulted in the player missing four months of play. The other was a brachial plexopathy, which required three months off play. Both players made a full recovery.
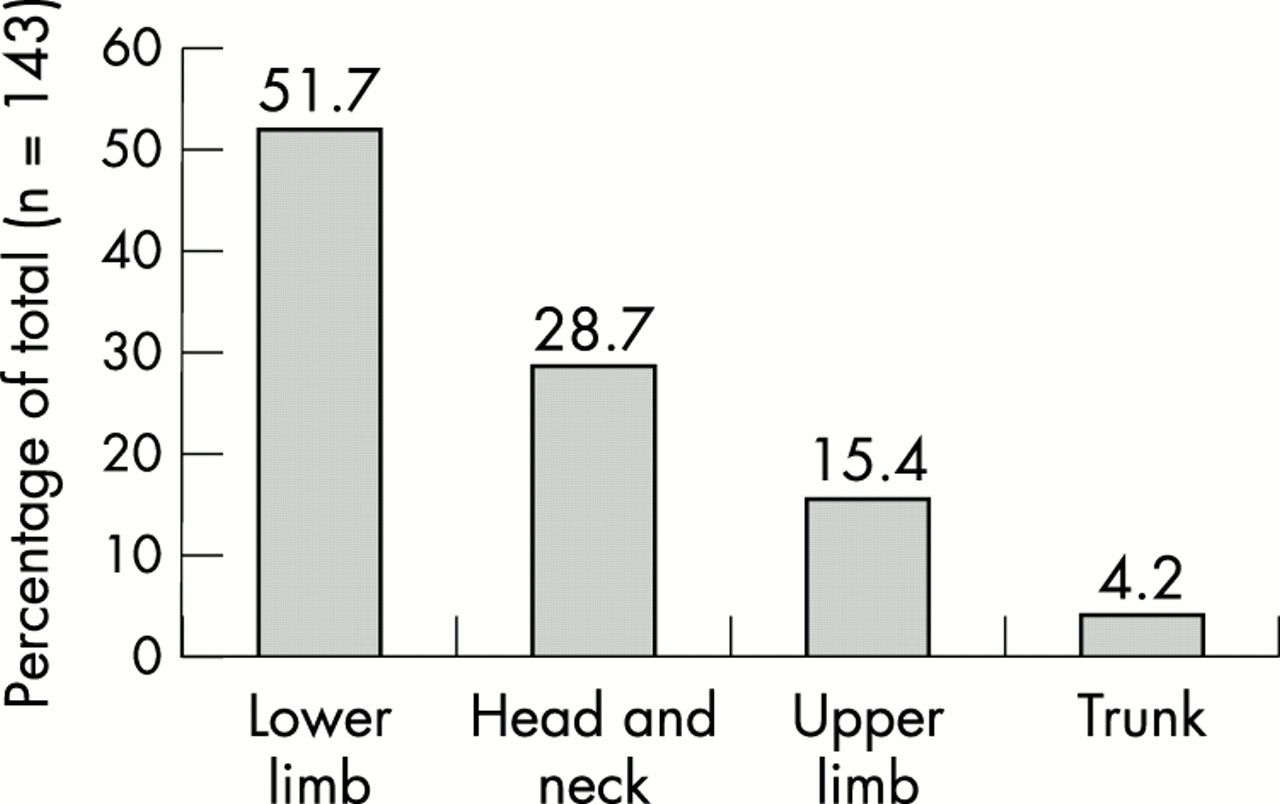
When injuries were categorised according to more general body regions, the lower limb was the most commonly injured region, with 51.7% of injuries. The head and neck accounted for 28.7% and the upper limb 15.4%. Other body parts were rarely represented (fig 1⇓).

Injury occurrence in elite Australian rugby union players by anatomical region.
Severity of injury
Most injuries were mild (64%), with the player missing one week or less, 14% were moderate with the player missing one to three weeks, and 22% severe, resulting in the player missing more than three weeks (table 3⇓).
Severity of injury by year
In the period before the start of professionalism, 63% of injuries were mild, 26% moderate, and 11% severe. In the period since then, 64% of injuries were mild, 12% moderate, and 24% severe. The vast majority (94%) of the severe injuries occurred in the professional era.
Mechanism of injury
Most injuries occurred in the tackle phase (58.7%), either tackling or being tackled. Open play accounted for 19.6% of injuries, closely followed by the ruck and maul with 14.7%. Open play occurs when the ball is no longer in a set piece, in a ruck or maul, or in the tackle. The set pieces (scrums and line outs) accounted for very few injuries (2.1%), with no injuries seen in the lineout at all. Foul play resulted in 3.5% of injuries (fig 2⇓). Most of the severe injuries occurred during the tackle phase (66%). Open play resulted in 19%, ruck and maul 9%, and foul play 6% of severe injuries.
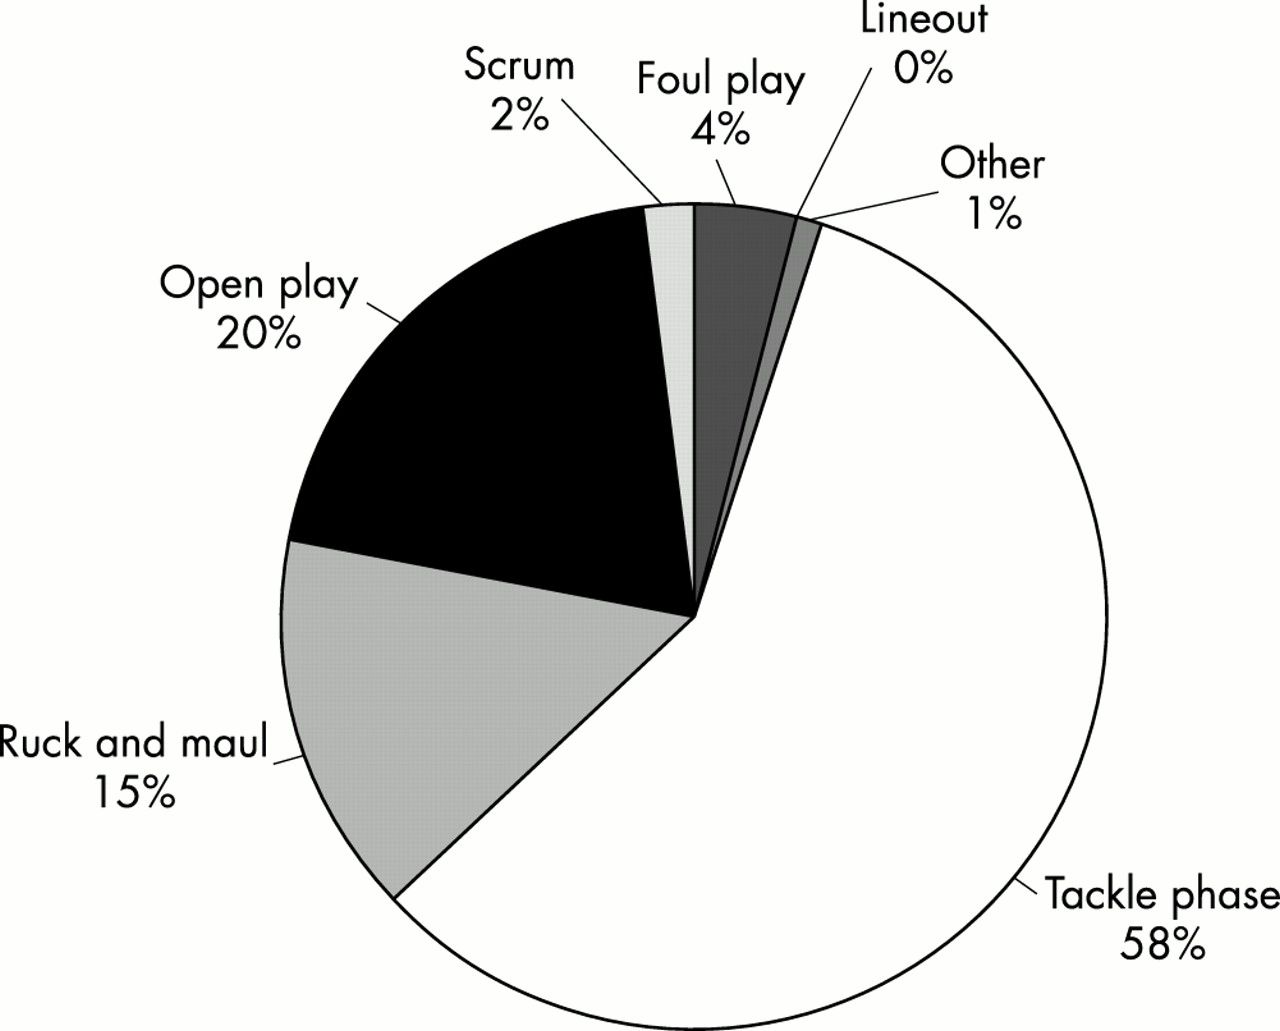
Mechanism of injury to elite Australian rugby union players.
The two injuries listed as “other” occurred during training in the gym.
Type of injury
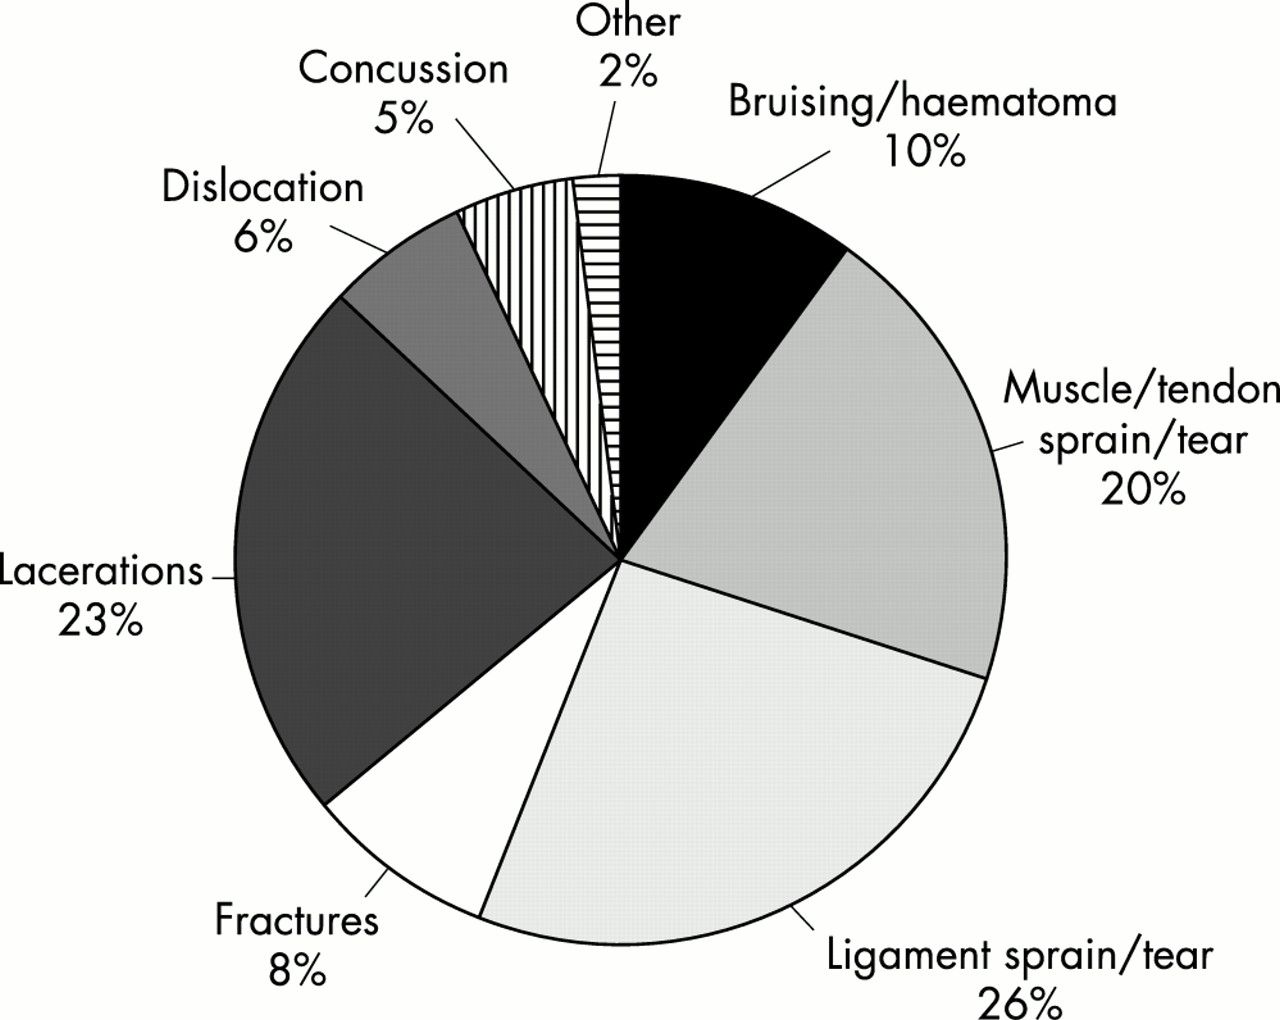
Soft tissue, closed injuries accounted for over half of all injuries (55%). These were further subdivided into contusion/haematoma (9.8%), musculotendinous strains/tears (20.3%), and joint/ligament sprains/tears (25.2%). Other types of injury included lacerations (23.1%), fractures (8.4%), dislocations/subluxations (6.3%), and concussions (4.9%)(fig 3⇓).

Types of injury to elite Australian rugby union players.
Time and place of injury
Most injuries (88%) occurred during the game, with 12% occurring at training. Approximately 53% of the training injuries were muscle strains or tears. A disproportionately high number of training injuries (76%) were moderate or severe, 54% of these being muscle strains or tears. Training was divided into contact (opposed) and non-contact sessions. Most Australian rugby union teams generally participate in one or two opposed sessions per week. The remaining sessions, generally two or three, are non-opposed.
There were 69% of injuries seen in the second half of the game, with 31% in the first half. When subdivided into quarters, the third quarter was seen to produce most injuries (40%), followed by the fourth (29%), the second (24%), and the first (7%).
Acute or chronic injury
The vast majority (90%) of injuries were acute, with the remainder being either chronic or a recurrence.
DISCUSSION
This study is the most exhaustive yet performed on international rugby players. In 1995, Jakoet et al5 studied injury patterns during the International World Cup held in South Africa. There are no other published studies on injury patterns in international rugby union players.
In 1997, Targett6 followed injury rates in a single elite professional New Zealand provincial team for one season during the Super 12 competition. Other studies have compared injury patterns in senior and junior recreational levels as well as schoolboy teams.1,7–,18 Data are scarce for female rugby players, although a study by Carson et al19 attempted to extend our knowledge of injury patterns in women’s rugby.
In spite of what may appear on the surface to be a reasonably broad volume of injury data on rugby players throughout the world, closer scrutiny shows this to be deceptive. There are appreciable differences in injury data collection, injury definition, severity definition, and methodology in most of the published studies. Uniformity as to how, when, and why injuries occur, and a standard injury definition are critical to allow methodologically sound injury research in the future. This would allow valid comparison of results between studies, and formulation of management strategies to reduce injury risk. An injury data collection form developed and validated by McManus20 offers a valuable starting position.
Most of the above studies have confirmed a number of trends in injury patterns. Most, although not all, have shown that injury rate increases with the grade of play.21 This applies at both senior and junior levels. The expectation in studying an international team, such as the Wallabies, would therefore be that injury rates would be high. This study has confirmed this, with a rate of 69 injuries/1000 playing hours of game play. Although not as high as that seen by Targett,6 it is higher than that seen by Jakoet et al5 (30–43 injuries/1000 player hours).
By comparison, injury rates at senior male recreational level have varied from 13.95/1000 player hours to 53/1000 player hours in those studies with injury definitions similar to ours.8,9 Schoolboy injury rates vary from 7/1000 player hours to 27.5/1000 player hours.18,22 The most recent study of injury rates in senior female rugby players has shown an injury rate of 20.5/1000 game hours.19
A number of theories have been postulated as to why there is a higher rate of injury at high levels of play. Firstly, the intuitively most obvious reasons are that play is faster, players are bigger and fitter, and tackling is harder. Secondly, it has been shown that, at the elite level and certainly since 1995, the ball is in play for longer periods.23 Thirdly, with the onset of professionalism, players are now able to devote more time to increasing speed and power and improving skills. Garraway et al7 showed that injury rates in senior Scottish players doubled in the four years after the onset of professionalism.
This study has further confirmed this trend towards increasing injury rates in the professional era. In the two years of injury data collection before the onset of professionalism, there was an injury rate of 47 injuries/1000 player hours. This has increased to 74 injuries/1000 player hours in the four years since then.
The most commonly injured player was the lock in the forwards, and the number 10 in the backs. The former finding concurs with the findings of Bird et al15 in a New Zealand club season in 1993. Other studies have most commonly found that the flankers or the number 8 are the most injured positions in senior male rugby.1,6,11,12 At the international level, locks are no longer players whose only job is to win lineout ball. They play in many respects like a back row forward in open play: they are important in scrummaging and of course are the dominant lineout players. It is no surprise that they are often injured. Forwards were disproportionately injured compared with backs. Again, this may simply reflect the fact that the forwards are involved in more phases of the game than the backs. This disproportionality, however, has not been a universal finding.1,6
Most injuries were soft tissue, closed injuries, accounting for 55% of all injuries. This is in accordance with other studies on rugby injuries.1,5,6,10,11 The most commonly injured site was the head, with 25.1% of total injuries. Most (75%) of these were lacerations requiring suturing. This high rate of head injury is in concordance with that seen in previous studies.1,6,9,12,14,24
In total, lower limb injuries accounted for just over half of the injuries. Most of these were knee and thigh injuries. Interestingly, only one anterior cruciate ligament tear was seen, and this injury occurred in open play. It has previously been reported that the rate of anterior cruciate ligament injury in rugby union is two to three times that of rugby league.9
There was a low rate of injuries to the upper limb (15.4%) compared with other studies.5,15 Upper limb injuries accounted for 34.4% of the severe injuries. When involved, the upper limb was more likely to be severely injured: 55.6% of the shoulder injuries seen were severe. At the elite level, an increase in shoulder girdle injuries, specifically rotator cuff tears associated with glenohumeral instability, has previously been observed.25
There is currently no evidence that wearing IRB approved shoulder pads reduces the incidence or severity of shoulder injuries. Shoulder padding can in no way prevent rotator cuff tears or glenohumeral instability injury. It has previously been shown that the rate of clavicular fracture increases on dry, hard grounds.16 For shoulder pads to also reduce the rate of clavicular fractures, the zone of coverage would need to extend further down the arm. This would improve impact energy attenuation, particularly resulting from falls on to the tip of the shoulder.26 This is the usual mechanism for clavicular fractures.
The tackling phase of play accounted for most injuries in this study. This is in accordance with almost all previous studies, although a recent paper found that loose play was the commonest phase of injury.1,5–8,10–13,15 Two studies have looked at factors involved in the tackle.27,28 Both found that the tackling and tackled players experienced a similar incidence of injury. One found that most injuries were sustained from an opponent attacking from the player’s peripheral vision or were “blind” tackles.27 It seems reasonable therefore to ensure that any headgear used is not so bulky as to reduce a player’s peripheral vision.
As has been seen previously, there were very few injuries in the set pieces, with only 2.1% of injuries occurring in scrums, and no injuries occurring in the lineout.1,6 This no doubt reflects the more controlled nature of these phases of play. Referees now instruct scrums to “crouch, hold, and engage”. This ensures a far more controlled engagement, the feature of scrummaging that has been shown to be responsible for most disabling cervical spine injuries.29,30
As expected, most injuries (69%) in this study were mild; 14% were moderate, and 22% were severe. Knee injuries accounted for most of the severe injuries (25%), and the tackle phase accounted for 66% of the severe injuries. Some 94% of the severe injuries occurred in the professional era.
Approximately two thirds of injuries occurred in the second half of the game, a finding in concordance with previous studies.1,12 However, when subdivided into quarters, the third quarter was seen to be overwhelmingly the time when most injuries occurred (40%). This may reflect the new laws introduced at the end of the 1996 season that allow substitution of uninjured players. Players may have been playing the third quarter as if it were their last, in the knowledge that they may be substituted by the fourth quarter. However, analysis of the relevant data before and after the new law came into effect did not support this. Third quarter injuries before and after introduction of the new law totalled 40% and 41% respectively. Other factors, such as incomplete warm up or reduced concentration after the half time break, may be more important.
Most injuries occurred during a game (88%), as opposed to training (12%). Most were acute (90%), rather than chronic or recurrent (10%). With the advent of professionalism and more time being spent at training, in association with greater incentives to play with chronic or recurring injuries, it had been postulated that a greater proportion of injuries might be seen during training, as well as more chronic injuries. This was not supported by this study.
Conclusion
This study confirms the previously noted trend of increasing injury rate in higher levels of play. It also confirms the suspicion that injury rates have increased considerably in the professional era in rugby union. The head continues to be the most injured body part in elite rugby union. Most head injuries were lacerations and were therefore minor. There were only two severe injuries to the head, a fractured orbit and a fractured nose. The concussion rate of 5% over seven years of elite rugby playing is low in such a body contact sport. None of the concussions sustained were severe.
Take home message
Injury rates increase with higher levels of play in rugby union. The injury rate has increased considerably since the start of the professional era.
An interesting finding is that most injuries occur in the third quarter of the game. This may reflect incomplete warm up or reduced concentration after the half time break.
Australia is one of only three countries in which the primary professional contract of players is held by The National Rugby Union. This contrasts with most sports in which the club holds the primary contract, with the national team holding a secondary contract. In Australia, many of the players are on an incentive based contract. They therefore sacrifice income if they miss games. This fact may lead to an underestimation of the true injury rate, as players may hide injuries or mask symptoms in order to play more games and thereby earn more income.
There is a pressing need for standardised data collection to allow valid comparison between studies. This would facilitate the development of management strategies that promote injury prevention and minimise injury risk.
Acknowledgments
We thank Drs David Hughes, Greg Smith, and John Lennard for their contributions and comments, Ms Joanna Smit and Dr Megan Best for their administrative support, The Australian Rugby Union for supporting rugby injury surveillance.
REFERENCES
Commentary
The authors are to be commended for their insight into collecting injury data starting in 1994 for the Australian Wallabies national rugby union team. The data allow insight into injury rates, mechanisms, and location for international rugby players, which in turn should stimulate further research. The results are of practical importance for coaches and selectors who determine the type/position of player for reserves during games. The data cannot, however, be generalised to all levels of rugby. Three points in particular are worth commenting on. The high injury rate reported in this study for the time period just after half time (third quarter) is of practical value to coaches and sport science support staff. There are many potential strategies to reduce injury in this time frame. Secondly, there appears to be a very low rate of injury to the clavicle and acromioclavicular joint. With the current controversies about protective padding, one may wonder what role shoulder padding has in rugby. Finally, the concussion rate was extremely low (seven concussions in seven years or 5% of all injuries). The authors do point out that some minor concussions may not have been reported. This low rate will need to be reproduced in other studies to confirm the incidence. This value is of great importance to researchers studying concussion at this competitive level, as it can be used to calculate appropriate sample size calculations for their studies.