Article Text

Abstract
Objective: To assess the exposure of players to injury risk during English Premier League soccer matches in relation to selected factors.
Methods: Injury risk was assessed by rating the injury potential of playing actions during competition with respect to (a) type of playing action, (b) period of the game, (c) zone of the pitch, and (d) playing either at home or away. In all, 10 games from the English Premier League 1999–2000 were chosen for analysis. A notation system was used whereby 16 soccer specific playing actions were classified into three categories: those inducing actual injury, those with a potential for injury (graded as mild, moderate, or high), and those deemed to have no potential for injury. The pitch was divided into 18 zones, and the position of each event was recorded along with time elapsed in the game, enabling six 15 minute periods to be defined.
Results: Close to 18 000 actions were notated. On average (mean (SD)), 1788 (73) events (one every three seconds), 767 (99) events with injury potential (one every six seconds), and 2 (1) injuries (one every 45 minutes) per game were recorded. An overall injury incidence of 53 per 1000 playing hours was calculated. Receiving a tackle, receiving a “charge”, and making a tackle were categorised as having a substantial injury risk, and goal catch, goal punch, kicking the ball, shot on goal, set kick, and heading the ball were all categorised as having a significant injury risk. All other actions were deemed low in risk. The first 15 minutes of each half contained the highest number of actions with mild injury potential, the last 15 minutes having the highest number of actions with moderate injury potential (p<0.01). The first and last 15 minutes of the game had the highest number of actions with high injury potential, although not significant. More actions with mild injury potential occurred in the goal area, and more actions with moderate and high injury potential occurred in the zone adjacent to the goal area (p<0.001). There was no significant difference between home and away with regard to injury potential.
Conclusions: Playing actions with high injury risk were linked to contesting possession. Injury risk was highest in the first and last 15 minutes of the game, reflecting the intense engagements in the opening period and the possible effect of fatigue in the closing period. Injury risk was concentrated in the areas of the pitch where possession of the ball is most vigorously contested, which were specific attacking and defending zones close to the goal. Injury potential was no greater in away matches than at home.
- injury risk
- analysis of events
- soccer
- football
Statistics from Altmetric.com
Soccer is a vigorous sporting activity with relatively high injury incidence (17–24 injuries per 1000 playing hours) compared with many other sports.1–,6 The costs of injuries to soccer players are enormous; the cost of treatment and loss of production through time off work has been estimated at about £1 billion in Britain each year.7 To minimise the number of injuries and the associated costs, avoid the early retirement of professional soccer players, and provide a safe and healthy sports environment, preventive programmes are recommended. These preventive programmes require information on injury and the risk of injury associated with different aspects of the game.
A great deal of research on soccer injuries has been carried out, and a number of facts about their nature, causative mechanisms, and characteristics have been established. For example, over 75% of injuries to professional players are strain, sprain, and contusion injuries.1,8–,11 Lower extremity injuries represent 60–85%9 of the total injuries incurred by soccer players of both sexes, with the most susceptible joint being the knee, followed by the ankle.9,12,13 Injury severity is usually classified as minor, moderate, or major depending on the length of time needed for recovery, with over 65% being minor, 25% moderate, and 10% serious.8 About half of the injuries arise from player to player contact, including tackling, being tackled, and collisions, and the remainder (non-contact) arise from actions such as running, shooting, turning, and heading.14 Although most researchers have noted that the playing position does not influence the occurrence of injury,1–3,15,16 Hawkins and Fuller17 found that defenders had a greater risk of injury than other players, suggesting that playing position may be an influential factor. The final quarter of each half is the period when most injuries occur, and the risk of injury is greater in the second half than in the first half, reflecting the most intensive periods of play.6,17,18 Most epidemiological studies indicate that injuries to soccer players are about three times more likely in competition than training.10,11,14
Most injuries are thought to be unintentional, resulting from an error by the player injured or another player. The error may cause an accident and some of these accidents lead to injury.19–,21 Although the risk of injury is influenced by various factors, it is conventionally assessed by the injury incidence rate, defined in terms of the number of injuries and the exposure to injury, usually in terms of time. However, this is an expression of risk to players for the game as a whole and does not detail the risk associated with specific actions that may lead to injury. For example, the number of injuries caused by a tackle has been reported,14 but not the number of tackles from which these injuries occurred. Thus the injury risk associated with tackles is based on a count of the tackles that have led to injury not the incidence of injury from tackles (defined as the number of injuries from tackles divided by the total number of tackles made). Further, many actions take place that do not often lead to injury, but have some potential risk associated with them depending on the vigour, context, and nature of the action. There is a risk associated with these non-injury generating actions, which is generally ignored in the literature. Consequently, to understand fully the risk of injury to which a player is exposed during soccer play, it is necessary to analyse the actions made in a game and to relate these actions to the risk they may possess and the subsequent injuries that may result from them. This approach to the assessment of injury risk is fundamentally different from previous studies, as it attempts to express injury risk in terms of the actions used in play and the potential these actions have for injury. It therefore provides a more detailed understanding of injury risk, which will have importance for designing appropriate injury prevention and rehabilitation programmes.
Several factors are thought to be related to injury risk in addition to the type of playing action used, such as location on pitch, period of play, and whether playing at home or away. As the role of playing actions before the actual occurrence of the injury event has not previously been investigated, the purpose of this study was to assess the exposure of players to injury risk during English Premier League soccer matches in relation to a number of selected factors that may influence that risk.
METHODS
To assess the injury risk in soccer performance with respect to (a) types of playing action, (b) periods of the game, (c) zones of the pitch, and (d) playing either at home or away, 10 games from the English Premier League 1999–2000 were chosen for analysis. A TV monitor and a video recorder (Panasonic NV- HD 685) were used to view the games and enable notation of events to take place. The video was paused after every event that occurred (for both home and away teams) and the action, location, and time were notated on paper. Sixteen soccer specific playing actions (table 1⇓) were notated; the pitch was divided into 18 zones (fig 1⇓), and the playing time was divided into six periods of 15 minutes each.
The list of playing actions recorded during the game

The zones of play demarcated for analysis of events.
The analysis in this study was limited to actions involving the ball. Although some movements without the ball—that is, running—have been reported as causes of injury in soccer,14 these were not included because the games were recorded from television broadcasts and attention was focused on activity around the ball. As such, movements of all players on the pitch are rarely visible. To cover all the movements made in play, other methodologies would be necessary and were beyond the scope of this study.
Each playing action was classified into one of three categories depending on its likelihood to cause an injury. These categories were “no injury potential”, “injury potential” (both assessed subjectively on the likelihood of the actions to produce an injury), and “actual injury” (defined as receiving medical treatment on the pitch). The “no injury potential” category was used for actions, such as an easy pass to a team player, where there was no discernible likelihood of injury. The “injury potential” category was divided into three subcategories: grade 1 was a mild (small) possibility of injury, for example when receiving a ball unchallenged; grade 2 was a moderate possibility of injury, for example when making a long kick or jumping to head the ball; grade 3 was a high possibility of injury, for example when making a vigorous tackle or a receiving a hard “charge”. The “actual injury” category was also divided into three subcategories: grade 1 was a minor injury where there was evidence of injury and the player received “first aid” inside the field of play (but without any additional treatment); grade 2 was a moderate injury when the player received treatment off the field of play but continued for the remainder of the game; grade 3 was a major injury when the player received treatment and left the field for the remainder of the game. It should be noted that these descriptions of minor, moderate, and major injuries do not correspond to general definition of injury severity used in the literature, as information on the subsequent effect of the injury was not available.
To quantify the injury risk associated with a playing action, the playing action injury risk incidence (PAIRI) was defined as the number of actions with some level of injury risk plus all actual injuries in a specific playing action category divided by the total number of actions made in that category, expressed as a percentage. In this study it was decided to use the sum of moderate and high (grades 2 and 3) injury potential to express the genuine risk of injury because a level of mild risk is accepted as a part of the game. Playing action injury incidence (PAII) is defined as the number of actual injuries in a specific playing action category divided by the number of actions made in that category as a percentage. All data were collected by one of the authors, and in a pilot study analysis were shown to be reliable (r = 0.99). The data were analysed using χ2 to compare categories, and a level of p<0.05 was used to indicate significance.
RESULTS
The total number of play actions recorded was 17 877. Altogether, 7667 actions were judged to have possessed some level of injury potential, and 20 actions resulted in actual injuries (an average of two per game) (fig 2⇓). The total exposure in terms of player hours was 374 (22 players, 10 games, 1.7 hours games). The injury incidence rates (as defined by Hawkins and Fuller3,17) for minor, moderate, and major injuries were 27, 16, and 11 per 1000 hours played respectively. The overall injury incidence rate was calculated to be 53 injuries per 1000 hours played.
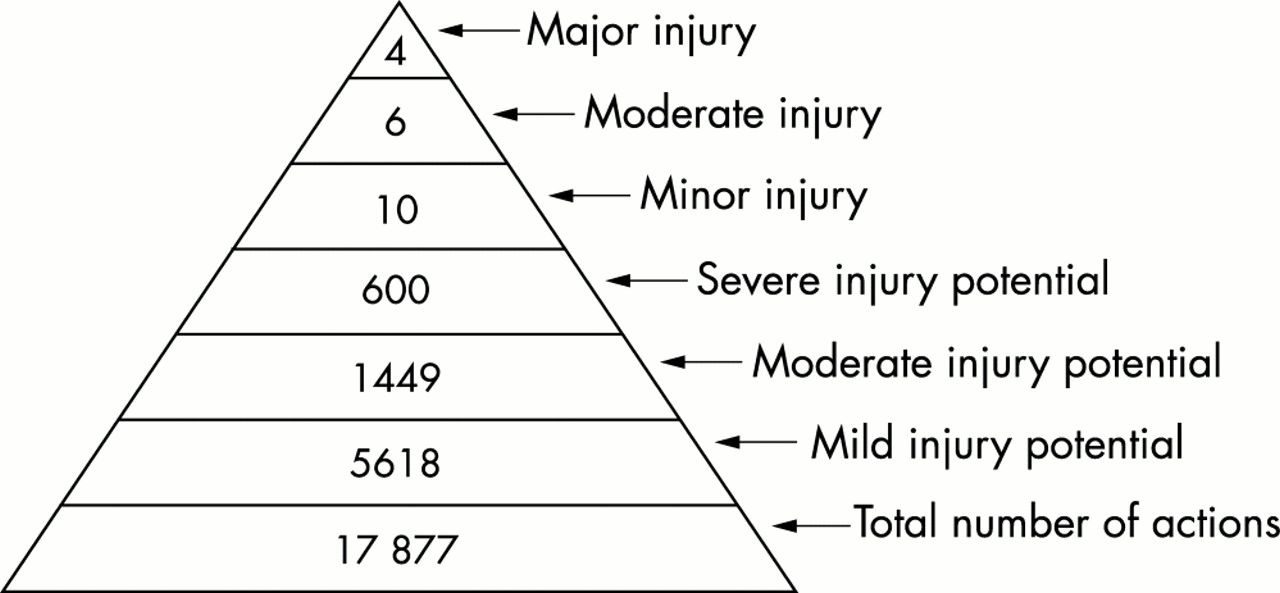
Total actions that were notated with the number of events in the injury potential and actual injury categories.
Playing actions
The minor injuries were caused by receiving a tackle (50% of all minor injuries), making a tackle (20%), receiving a “charge”, kicking the ball, and catching the ball (10% each) (table 2⇓). The moderate injuries resulted from receiving a tackle (83% of all moderate injuries) and making a tackle (17%). The major injuries were all attributable to receiving a tackle. The PAII values for actions leading to injury were 1.54% (receiving a tackle), 0.43% (goal catch), 0.33% (making a tackle), 0.17% (receiving a charge), and 0.04% (kicking the ball).
The incidence of injury potential (IP) and actual injury (AI) for each type of playing action (PA)
Table 2⇑ gives the total numbers of occurrences with injury potential for each playing action. A significant difference (χ2 = 1101.6, p = 0.001) was found between the playing action categories. Those with more than 50% of actions judged to have some degree of injury potential were categorised in terms of risk. Actions classed as having mainly a mild injury risk (because they had their highest percentage of actions with injury potential in the mild category) were kicking the ball (89% of all kicking the ball actions), set kick (83%), heading the ball (68%), and shot on goal (73%). Actions categorised as having a predominantly moderate injury risk were receiving a “charge” (72%), making a tackle (49%), and goal punch (47%), whereas one action (receiving a tackle, with 54% of all tackles received) was categorised as having a predominantly high injury risk.
Moderate and high injury risk is also expressed by the PAIRI, which for the four playing actions identified above were receiving a tackle (95.5%), receiving a charge (82.2%), making a tackle (50.4%), and goal punch (60%). Of these, only one (goal punch) did not lead to injury. Two playing actions had low PAIRI values but led to an injury; these were kicking the ball (4.7%) and goal catch (20.4%). The former may have occurred because of the high number of kicking actions made, and the latter did not figure in any injury risk category and may be a chance occurrence.
Periods of the game
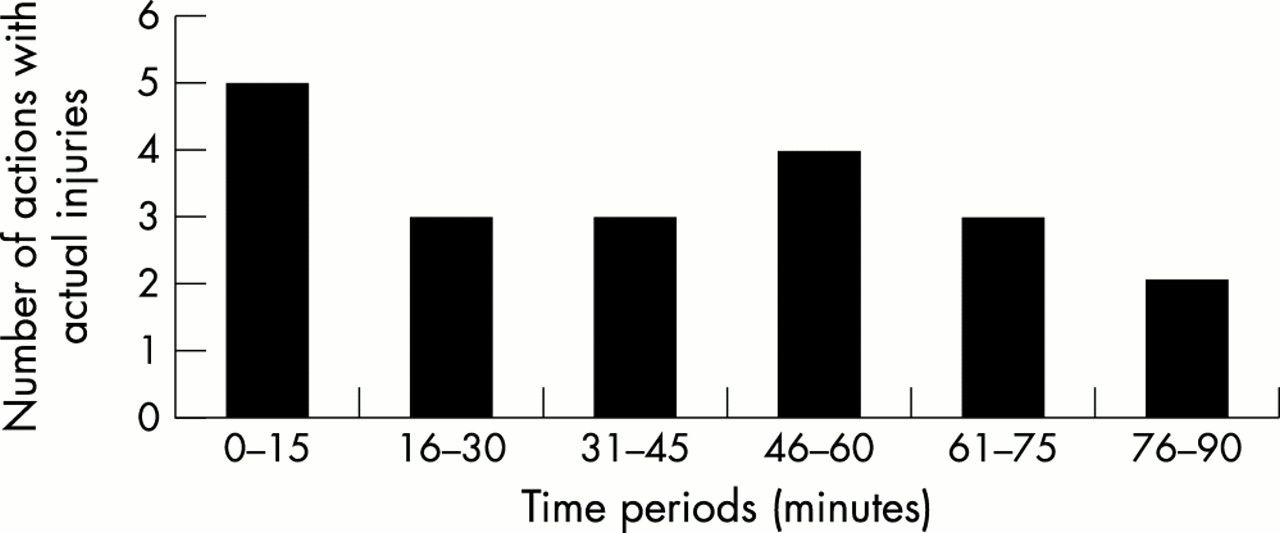
Figure 3⇓ illustrates the number of actual injuries per period. No significant difference (χ2 = 1.58, p>0.05) was found between the six 15 minute periods of the game. Most actual injuries occurred in the first 15 minutes of the first half (n = 5) and the first 15 minutes of the second half (n = 4). The first half tended to contain more actual injuries than the second half (11 and 9 incidents respectively), but this difference was not significant (χ2 = 0.04, p>0.05).

Number of actions resulting in actual injuries per period (total over 10 games).
Figures 4, 5, and 6⇓⇓⇓ illustrate the number of actions with mild, moderate, and high injury potential respectively per period. A significant difference was found in mild and moderate injury potential between halves, with the first half having more actions with injury potential (χ2 = 9.59, p = 0.008, χ2 = 10.47, p = 0.005 respectively). The number of actions with high injury potential was similar in the two halves (51% v 49%). A significant difference between periods (χ2 = 39.79, p = 0.001) was found in mild injury potential, the first 15 minute period having significantly more actions with mild injury potential than any other period of the game. A significant difference (χ2 = 25.08, p = 0.001) in actions with moderate injury potential was found; the last 15 minute period had significantly more of these actions than any other period of the game. Although the first and last 15 minute periods had more occurrences of actions with high injury potential than other periods, they were not significantly different (p>0.05).

Number of actions with mild injury potential per period (total over 10 games).

Number of actions with moderate injury potential per period (total over 10 games).

Number of actions with high injury potential per period (total over 10 games).
Zones of the pitch
The number of actual injuries observed was small so it was not possible to analyse these formally per zone. Altogether, 40% of injuries occurred in the midfield area, 30% in the defending area, and 30% in front of the main attacking area (table 3⇓).
Injury potential (IP) and actual injuries (AI) per zone
There was a significant association (χ2 = 517, p = 0.001) between the number of actions with injury potential and the zone of play (table 3⇑). Most actions with mild injury potential occurred in the attacking zones (14, 17), defending zones (2, 5), and midfield zones (7, 12), with about 60% of all events with mild injury potential occurring in these six zones. The number of actions with moderate and high injury potential also occurred in the same attacking and defending zones, with about 40% of all events with moderate injury potential and about 44% of all events with high injury potential occurring in the four zones numbered 5, 7, 12, and 14. Furthermore, it can be noted that 38% of events with injury potential occurred in the midfield area, 31% in the attacking area, and 31% in the defending area.
Playing either at home or away
The number of actions with actual injuries for away teams (13) exceeded that for home teams (7), but the difference between them was not significant (χ2 = 1.8, p = 0.12). The actions with mild, moderate, and high injury potential were also not significantly different between home and away teams.
DISCUSSION
The aim of this investigation was to assess the exposure to injury risk during competitive English Premier League matches, by identifying the most common critical incidents and the actual injury potential and injury associated with them. Injury potential and actual injury were assessed with respect to playing actions, periods of the game, zones of the pitch, and playing at home or away. The overall injury incidence rate in this study was found to be 53 per 1000 hours played, which is higher than reported by Inklaar9 and Arnason et al,18 probably because of the method of defining injury used in this study.
Unlike the previous work referred to, our study focused on the thousands of events observed over the 10 games analysed, and the small numbers of actual injuries occurring would not allow inferences about injury to be drawn. It should be noted that the concern of the study was with injury risk associated with actions around the ball, rather than injuries attributed to running off the ball (and the associated risk from locomotion), although all of the injuries recorded were due to actions made in contesting the ball.
Some playing actions were associated with a greater risk than others. Based on the PAIRI values and the different levels of injury potential, it seems that the playing action with the greatest injury risk is receiving a tackle. Receiving a charge and making a tackle also have substantial risk associated with them. Other playing actions such as goal catch, goal punch, kicking the ball (including shot at goal and set kick), and heading the ball all have a significant risk of injury. Other playing actions have a much smaller risk associated with them. Making a “charge” appears to be relatively low risk compared with receiving one, presumably because it is planned by the player doing the charging. As some actions have a higher injury risk than others, more attention should be paid to these by the coach when planning training, by the referee when judging a match, and by players who may also need to practice avoidance manoeuvres to protect themselves in such instances. Inspection of the data in table 2⇑ shows that some playing actions (such as kicking the ball) are characterised by a large number of “low injury potential” occurrences whereas others (such as making and receiving a tackle and receiving a charge) are characterised by a smaller total number but a higher occurrence in the moderate or high injury potential category. In both cases, these can lead to actual injuries. In the former case, an injury may occur simply because the large number of events increases the chance of one of them becoming a critical incident (as illustrated in fig 2⇑). In the latter case, the higher level of risk associated with certain actions means that they are more likely to lead to a critical incident or injury. An exception to this appears to be the goal catch, which has a low number of actions and has a predominantly low injury potential, but generated one injury. However, in any action, there is always some element of risk depending on the context and it may be that this particular action represents a chance event because of the small but important number of events with high injury potential.
Take home message
The risk of injury in soccer can be related to the playing actions, the period in the game, and specific zones of the pitch. Players are at most risk when receiving a tackle or charge or making a tackle. This risk is highest during the first and last 15 minutes of the game, reflecting the intense engagements in the opening period and the possible effect of fatigue in the closing period, and in specific attacking and defending zones where possession of the ball is most vigorously contested.
A significant difference was found between periods of the game with respect to injury risk. The opening 15 minutes had significantly more actions with mild injury potential than any other period of the game. The contest is arguably at its most intense in the initial period of play because the players are fresh, more energetic, and wish to “register their presence” with the opposition. The closing 15 minutes of the game had the most frequent actions with moderate injury. This may be the result of fatigue of the muscles and other body organs as muscle glycogen stores near depletion22 and players become hypohydrated.20 At this stage of the game, the players are tired but the contest may still be intense. The consequence may be that predisposition to injury is exposed as fatigue sets in or damage incurred earlier in the game becomes more evident as play is sustained. More attention should be paid by game officials and players (and the team's medical staff) to the first and last periods of the game if actions including some risk of injury are not to lead to actual injury.
No significant difference in actual injuries per period of the game was observed, mainly because of the small numbers involved. Most actual injuries occurred in the first 15 minutes of the first half. This may be because this is the period in which greatest effort occurs. The first 15 minutes of the second half of the game again had a relatively high number of injuries. In this instance, the players may not have warmed up properly after the half time intermission. These results differ from those of Hawkins et al,14 who reported that more injuries were observed during the final 15 minutes of the first half and the final 30 minutes of the second half. These differences may reflect, in part, the different definitions of injury (they classified injury severity by the length of time that a player was subsequently absent from training or competition), methods of data collection, observation periods, study designs, and sample characteristics.23 There was no significant difference between the two halves of play in terms of incidence of actual injury, accounting for 11 (55%) and 9 (45%) incidents respectively. Hawkins and Fuller4 found that the number of injury incidents in the second half was significantly greater than in the first half (57% v 43%), although Ekstrand and Gillquist24 have shown some similarities to our research—that is, more injuries at early stages of a game.
A significant difference in injury risk was observed between zones of the pitch. More actions with mild injury potential occurred in the goal area (zones 2 and 17), and more actions with moderate and high injury potential occurred in zones adjacent to the goal area (zones 5 and 14). This pattern probably reflects intense actions occurring as a result of efforts to score goals by forward players and the protection of the goal area by opponents. Relatively high injury risk also occurred in zones 12 and 7, which are asymmetrical zones of the pitch. This may be due to a tendency of players to attack on the right side of the pitch (fig 1⇑). Zone 12 represents the right hand side of the pitch when attacking whereas zone 7 represents the opponents' right hand side of the pitch when they attack. Therefore more attention should be paid by referees to play in these zones (14, 17, 2, 5, and 12). In relation to actual injury per zone, it is noted that just 50% of injuries occurred in the attacking zones 16, 17, and 12. This finding is linked to the attempts by forward players to score and by defenders to protect the goal area from the opponents. The low number of actions in zone 16 suggests that this is the weaker side of the field for players, who are therefore at increased risk. In defence, the high number of injuries in relation to the low number of actions in zones 3 and 6 suggests that these are high risk locations.
In soccer, home advantage has always been a very important factor in determining the outcome of a game,25,26 but in this study no significant difference was observed between the home and away teams with regard to their exposure to risk. The total number of actual injuries for away teams was only marginally more than for home teams, and this difference was not significant. The higher number of actual injuries for away teams may be due to psychological factors such as stress and lack of acquaintance with the opponent's playing surface, and may contribute to the phenomenon of home advantage but seemingly not to injury risk or injury occurrence.
In conclusion, data available from this investigation suggest that some playing actions were associated with higher injury risk than others. In particular, receiving a tackle, making a tackle, and receiving a charge were actions with a substantial risk of injury. The first and last 15 minutes of the game contained the highest risk, although the greatest number of injuries tended to be in the first period of each half. Exposure to injury risk was concentrated on those parts of the pitch where possession of the ball is most vigorously contested, being specific attacking, defending, and midfield zones. Playing at home or away does not affect a player's risk of injury.
Acknowledgments
NR is supported by a research grant from the Ministry of Sciences, Research and Technology of Iran and also by Isfahan University.