Article Text

Abstract
Objectives: To show how epidemiological data can be presented and analysed in frequency based and risk based formats and how risk based information can simplify management decisions on injury prevention strategies in professional football.
Methods: The club physiotherapists at four English professional football clubs prospectively recorded players’ injuries over the period November 1994 to May 1997. The nature, location, and mechanism of each injury and the specific numbers of days that players were unavailable to train or play as a result of injuries were recorded. The rates of injury were evaluated on a risk matrix using the number of days and the estimated costs of absence as measures of injury consequences.
Results: There was a significant difference in the time lost through injury as a function of injury severity (p<0.001). Slight and minor injuries accounted for 51% of all injuries but represented only 17% of the risk from injury, whereas major injuries accounted for only 12% of the number of injuries and 47% of the risk. Player to player contact injuries accounted for 39% of the risk of injury, and football specific activities accounted for 47% of the risk. The risks of acute injury in professional football were three orders of magnitude greater than those in the construction, manufacturing, and service sectors of industry.
Conclusions: The risks associated with minor, moderate, and major acute injuries and osteoarthritis in lower limb joints of professional footballers were found to be unacceptable when evaluated against work based risk criteria used by the Health and Safety Executive. All stakeholders within professional football were shown to have an important contribution to make in reducing the overall level of risk to players through the provision of risk prevention strategies.
- football
- injury risk
- risk
- injury prevention
- support services
Statistics from Altmetric.com
Under UK health and safety legislation, employers are required to ensure the health, safety, and welfare of their employees,1 and, in order to comply with this legislation, they must carry out risk assessments to identify the level of occupational risk.2 Employees in the United Kingdom suffer, on average, 0.36 reportable injuries per 100 000 working hours within the range 0.03 for the finance sector to 1.3 for the mining/quarrying sector.3 Footballers, however, suffer 710 reportable injuries per 100 000 hours of training and competition,4 which is several orders of magnitude greater than that found for most occupations in the United Kingdom. In addition to the high rates of injury, 47% of players5 are forced to retire from professional football as a result of an acute or chronic injury. Risk taking and aggressive behaviours by players contribute to 28–33% of the players’ injuries,6,7 and 3.7% of fouls result in minor or moderate injuries.8 Although the injury rate caused by foul play is high at 500 injuries/100 000 hours, the rate of injury from other causes is even higher at 750 injuries/100 000 hours.4 The significance of these high levels of injury is increased by the fact that most players have only a poor understanding of the beneficial contribution that prevention strategies can make to reducing the levels of injury9 and the fact that clubs provide an inadequate level of support services to players for injury prevention.10
Work based injuries are normally measured using frequency based performance indicators, such as the number of injuries per 100 000 hours or per 1000 employees. This method of measurement, however, does not reflect the true level of risk because it does not take into account the number of days that employees are absent from work or the costs incurred by employees and employers as a result of an injury. It is possible, using a frequency based assessment, for a large number of minor injuries to obscure a greater impact from a small number of major injuries. For this reason, assessments should review the levels of injury using risk based criteria, such as the number of days lost by employees or the financial costs or losses experienced by employees and employers.
In the United Kingdom, the Health and Safety Executive (HSE) have provided guidelines on the levels of work based risk that are considered to be negligible, acceptable, tolerable, and unacceptable. A negligible level of risk11 is “a level of risk, usually presumed to be below 1 in a million per annum and perhaps much lower, of seriously adverse consequences occurring, where no thought is given to their likelihood in the conduct of normal life”. An acceptable level of risk11 is “a risk in the region of 1 in a million of a serious adverse occurrence, where the conduct of life is not affected provided that we are in fact satisfied that reasonable precautions are in place”. A tolerable level of risk11 is “a range of risk that we do not regard as negligible or as something we might ignore, but rather as something we need to keep under review and reduce it still further if and as we can”. An unacceptable level of risk11 is “a risk which is beyond (above) the region of tolerability”. A serious adverse occurrence in the context of injury is normally taken to mean a fatality. The HSE12 have defined the region of tolerable risk to an employee as a probability of between 1 in 5 × 10⁴ and 1 in 103 of a fatality occurring, and the region of acceptable risk as a probability of between 1 in 106 and 1 in 5 × 10⁴ of a fatality occurring.
The first aim of this paper is to assess epidemiological data of injuries to professional footballers on a risk based format and to evaluate the results against the HSE guidance on the acceptability and tolerability of risk to people at work. The second aim is to show how an assessment of injury data on a risk based format can assist football clubs in identifying the significant sources of injury, thereby supporting the development of injury prevention strategies.
METHODS
Data collection
Player injuries were prospectively recorded over the period November 1994 to May 1997 at four English professional football clubs. All professional players at these clubs were included in the study together with youth players from two of the clubs. Each injury was diagnosed by the clubs’ senior physiotherapists, who were qualified to either Chartered status or FA Diploma level. The senior physiotherapist at each of the four clubs recorded their injury data on a specific injury report form designed for this study.4 A recordable injury was defined as an injury received during competition or training that prevented the player from participating in competition or normal training for at least one day, not including the day of the injury. These injuries were categorised as “slight” (one to three days), “minor” (four to seven days), “moderate” (one to four weeks), and “major” (more than four weeks). The categories designated as “minor”, “moderate”, and “major” corresponded to work based injuries that would be defined as reportable injuries under the Reporting of Injuries, Diseases, and Dangerous Occurrences Regulations.13 For every injury, the physiotherapists were also required to record the nature, location, and mechanism of the injury and the specific number of days that players were unavailable to train or to play as a result of each injury. Absences caused by sickness or other general medical conditions, which required an examination by the player’s own general practitioner, were not included in the study.
Comparative data for work based fatalities and major and over three day injuries for the construction, manufacturing, and service industries were obtained from statistics published by the Health and Safety Commission.3
Data analysis
Probability is defined as the frequency of occurrence of an adverse event and, in the present context, was expressed as the number of events per 100 000 hours of exposure. The six levels of probability used in this study were set over the range from 0.001 to 1000 events per 100 000 hours of exposure in order to correspond to the probability values observed in football and a range of other occupations (fig 1). The consequences of an injury were defined principally in terms of the number of days of absence from training and/or competition experienced by the player, because this reflected the impact of injury on both players and clubs. Data for injury location, nature, and mechanism were analysed and reported as proportions of the total number of injuries and of the total risk and as percentage cumulative frequencies of the number of injuries and of the risk from injuries. The risk (Rd) associated with a specified number of days absence (d) was defined as the total number of injuries (nd) resulting in the specified number of days of absence multiplied by the specified number of days:
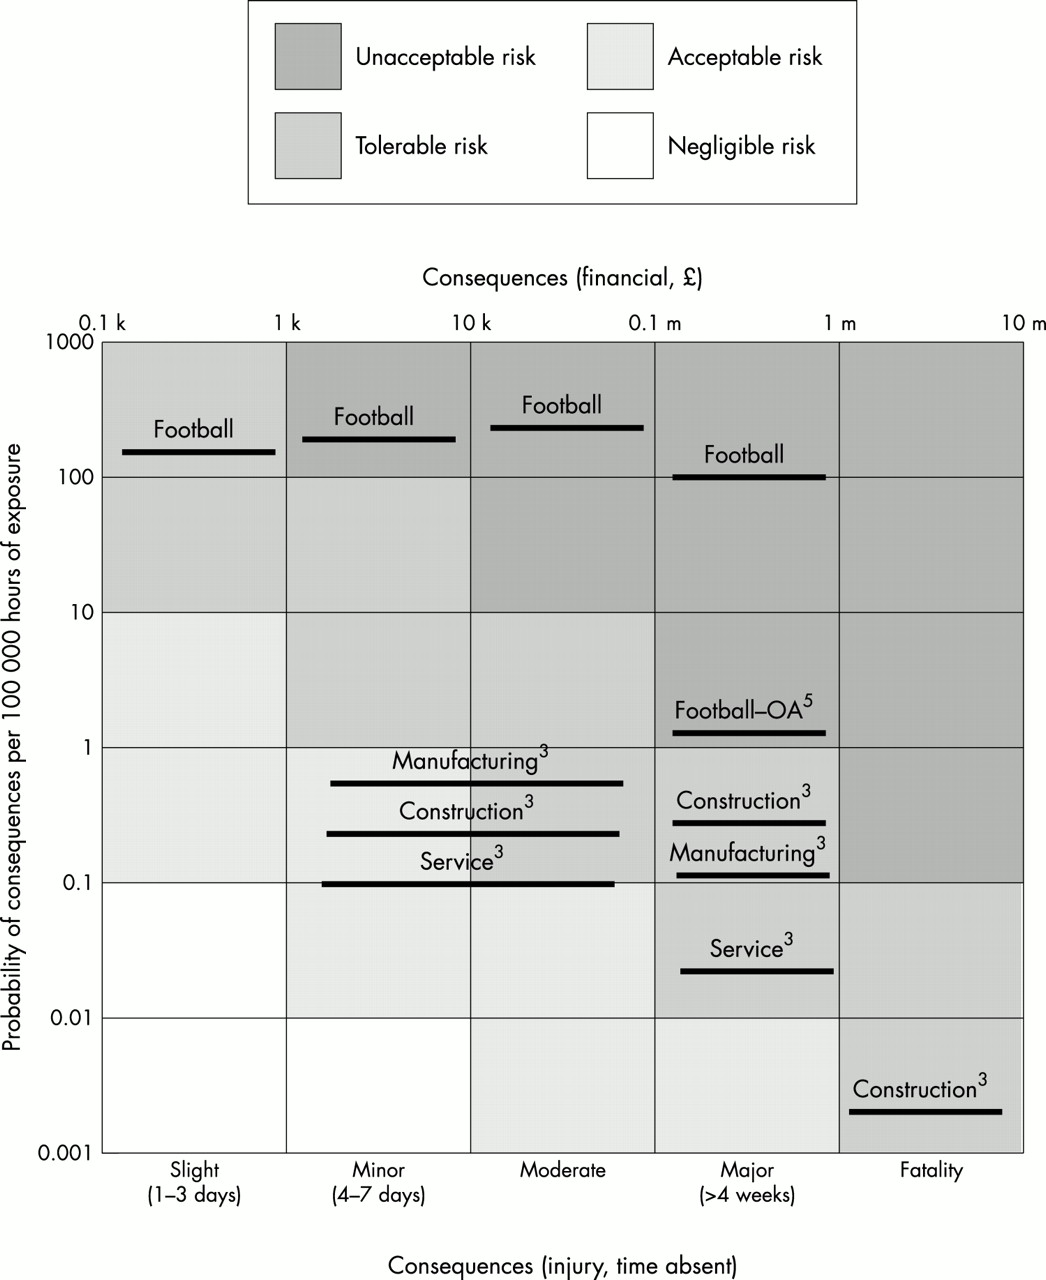
Injury risk matrix. Superscripts are reference numbers. OA, Osteoarthritis.
The total risk (RT) within the category of injury being assessed was defined by the sum of Rd for all values of d from d = 1 to ∞:
To compare risk levels in football with other occupational sectors, the RIDDOR reportable category of over three days absence from work was taken to equate to the categories of minor and moderate injuries reported here, and the RIDDOR reportable category of major injury was equated to the major injury category reported here.13
The consequences of injury were also evaluated against an estimated equivalent monetary value and, in this respect, the value of a life (fatality) was taken to range from £1m to £10m, which is a typical range of values used by the UK government and industry for the purposes of cost benefit analysis. The monetary values used for the less severe categories of major, moderate, minor, and slight injuries were set at decreasing exponential intervals down to the range of £100 to £1000 for a slight injury resulting in one to three days of absence. The values for days lost also equate to the equivalent monetary values of the days lost based on typical salaries of professional footballers.14
The boundaries of the evaluation areas within the risk matrix were defined by the HSE criteria for the acceptability and tolerability of risk in terms of the probability of a fatal accident,12 with the boundaries at lower levels of consequence defined by equivalent levels of risk based on the product of probability and financial losses.
Statistical analysis
A one way χ2 test was used to assess differences between the results obtained for the proportions of injuries and proportions of risk. Significance was accepted at the 95% confidence level for all statistical tests, unless stated otherwise.
RESULTS
Overview
The injury database covered 138 players and included 744 reports of injury that prevented a player from training or competing for at least one day; a detailed analysis of the epidemiological data, in terms of injury nature, location, and mechanism, has been reported separately.4 Of the 744 injuries reported, 587 (76%) were accompanied by information on the number of days that the player missed from training and competition as a result of the injury. These injuries accounted for a total of 8644 days of absence, which equated to a mean (SD) absence period of 14.7 (22.5) days per injury (new injuries, 13.7 days; re-injuries, 18.2 days) and were equivalent to 39.6 days of absence per player per year or 13% of a playing season. Re-injuries accounted for 22.3% of all the injuries recorded.
Injury frequency and severity
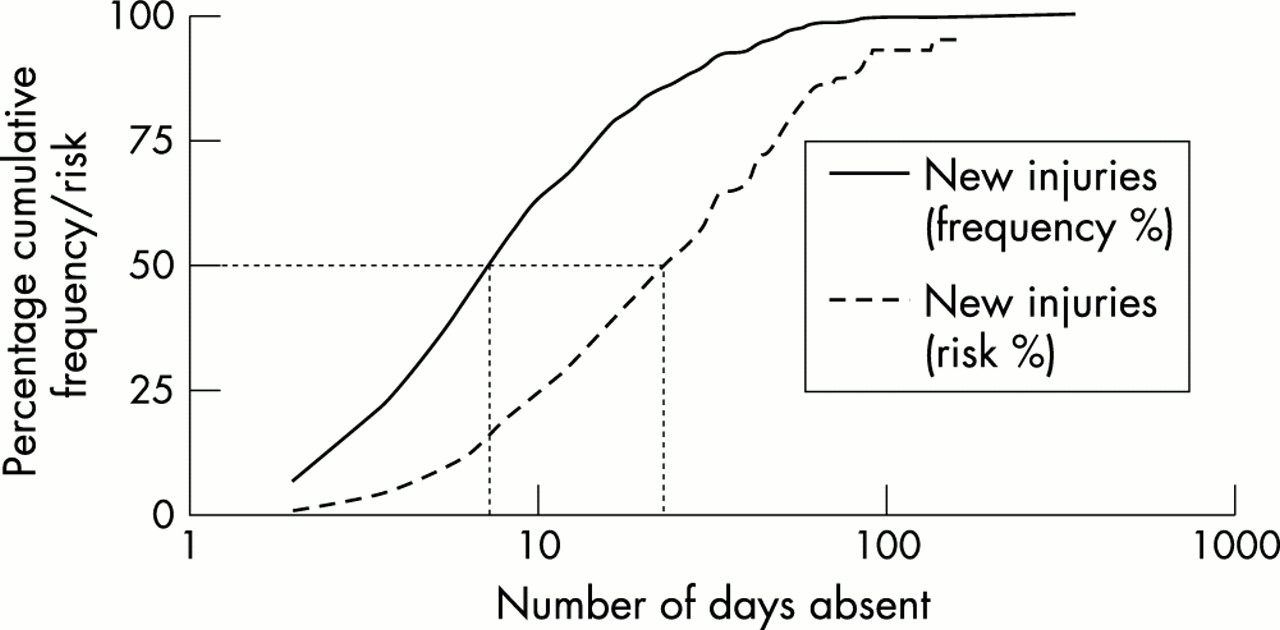
Table 1 summarises the proportions and rates of injury and the proportions of time lost, as a function of injury severity. There were significant differences in the proportions of time lost through injury as a function of injury severity (p<0.001). Figure 2 shows the frequency distributions for the number of days lost (up to eight weeks) for all new and re-injuries, and figure 3 shows the percentage cumulative frequency and percentage cumulative risk for new injuries as a function of days lost.
Overview of the risks of injury as a function of injury severity

Frequency distributions for the days of absence as the result of new injuries and re-injuries.
Percentage cumulative frequency and cumulative risk of injury as a function of days of absence.
Table 2 gives the proportions of injuries and accident rates for fatalities and major and over three day injuries from the construction, manufacturing, and service industries, which were calculated from data published by the Health and Safety Commission.3
Proportions of injuries and injury rates in the construction, manufacturing, and service sectors as a function of injury severity
Injury location, nature, and mechanism
Tables 3, 4, and 5 present the percentages of injuries and levels of risk within the five main categories of injury location (thigh, ankle, knee, lower leg, and groin), the four main categories of injury nature (strains, contusions, sprains, and fractures/dislocations), and the four main categories of injury mechanism (tackled, running, tackling, and shooting) respectively.
Distribution of injuries and risk as a function of injury location
Distribution of injuries and risk as a function of injury nature
Distribution of injuries and risk as a function of injury mechanism
Player to player contact incidents, such as tackling and being tackled, accounted for 38.9% of the total days of absence, and football specific activities, such as running and shooting, were responsible for 46.5% of the days lost. Player to player contact was responsible for 93.8% of contusions, 59.4% of sprains, and 55.0% of fracture injuries. The players making the tackles suffered all of the fracture injuries caused through player to player contact. Player to player contact was also the major cause of ankle (61.9%) and knee (56.8%) injuries, and football specific activities were the major causes of strains (72.1%) and groin (46.8%), thigh (71.3%), and lower leg (43.6%) injuries.
Percentage cumulative frequency and cumulative risk distributions
Table 6 shows the numbers of days of absence at which 50% of the injuries and 50% of the risk occurred for new and re-injuries and for injury location, nature and mechanism. Table 6 also shows the percentages of injuries at which 50% of the risk occurred within each of these categories.
Fifty per cent cumulative frequency and risk values as a function of causative factors
DISCUSSION
Frequency based assessments of injury only describe the likelihood or probability that an injury will occur, whereas risk is a function that takes account of both probability and the consequences resulting from an adverse event. Although the probability of an adverse event occurring will be the same for all stakeholders in a football club, quite often each stakeholder will be concerned about and affected by different outcomes from a player’s injury. For example, a knee injury may lead to osteoarthritis in the knee of the player, a heavier treatment and rehabilitation workload for the physiotherapist, a poorer performance by the team, and a worse financial performance by the club. Therefore, for an accurate evaluation of the impact of players’ injuries, measures of both injury severity and probability should be included within an assessment. In this respect, injury severity or consequence can be defined in a number of ways, such as the nature of the injury, the duration of the injury treatment and rehabilitation processes, and the financial loss experienced by the club and/or player.
If a simple comparison is made between the frequency based and risk based distributions of injuries shown in tables 3, 4, and 5, there appears at first to be little difference between the results obtained from the two approaches in the cases of injury location and mechanism. For injury nature, the risk from contusions was half the level indicated by the frequency of occurrence, whereas the risk from fractures/dislocations was three times higher than the level indicated by the frequency of occurrence. The results presented in tables 1 and 6, however, emphasise the importance of taking risk based as well as frequency based assessments of injury into account. Table 1, for example, shows that if the severities of players’ injuries are ranked in decreasing order of frequency of occurrence, they appear as moderate, minor, slight, and major injuries, whereas, if the severities are ranked in decreasing order of risk they appear as major, moderate, minor, and slight injuries. In addition, whereas slight and minor injuries contributed 51% of the number of injuries, they represented only 17% of the total risk, whereas major injuries only accounted for 12% of the injuries but 47% of the risk. Similarly, the results presented in table 6 show that, apart from fractures/dislocations, 50% of the injuries in each category resulted in 12 or less days of absence. However, injuries included within the 50% risk value in each category lasted for up to 42 days. In addition, between 8% (lower leg) and 19% (ankle) of injuries, which represented the more severe injuries, accounted for 50% of the total risk. As major injuries normally require very different treatment and rehabilitation programmes from slight and minor injuries, these results are particularly important as far as decisions on the allocation of resources for injury prevention, treatment, and rehabilitation support services are concerned.
An assessment of the levels of support services provided by professional football clubs in the United Kingdom showed that, although the provision and application of injury treatment and rehabilitation services were adequate, the provision of injury prevention services was inadequate.10 Although deficiencies in the numbers, qualifications, and experience of medical staff at football clubs have been reported as an important issue,15 the underlying cause of the problems associated with the provision of injury prevention can often be traced to the financial pressures experienced by most professional clubs.14 This situation has been exacerbated by the short term management strategy adopted by many clubs whereby the limited financial resources that are available are prioritised and allocated in favour of the recruitment and remuneration of players,14 which is supported by a strategy of treatment and rehabilitation for players when they are injured.10 The longer term benefits offered by a risk management approach, which advocates the allocation of adequate resources to injury prevention strategies, have therefore not gained currency among most English clubs.
An effective risk management strategy begins with an estimation and evaluation of the risks associated with the activity. However, to complete this assessment, it is necessary to use acceptable criteria for the estimation and evaluation of the risk. Risk, which is described as a function of probability and consequence, can be displayed on a two dimensional calibrated matrix, such as the 5 (consequence) × 6 (probability) matrix used here. The data for acute football injuries (table 1) and the construction, manufacturing, and service sectors of industry (table 2) are presented within the 5 × 6 risk matrix shown in fig 1. In addition, risk data have been included for the occurrence of osteoarthritis in the lower limb joints of retired footballers by taking the probability of occurrence5 (two cases/100 000 hours) and assuming that the consequences of osteoarthritis are equivalent to a major acute injury. The data for fatalities in the manufacturing and service sectors fell within the tolerable range of risk, but the probability values were below the range included in the risk matrix presented here. Fatalities in the construction industry and major injuries in the construction, manufacturing, and service sectors fell within the area defined by the HSE as tolerable, and the data for over three day injuries in the construction, manufacturing, and service sectors fell within the acceptable and tolerable areas of risk. For football injuries, however, although the occurrence of slight injuries fell within the tolerable level of risk, the occurrence of minor, moderate, and major acute injuries and osteoarthritis in the lower limb joints all fell within the area of risk deemed to be unacceptable by the HSE.
These unacceptable levels of risk to players from acute and chronic injuries should be a major concern for all stakeholders in English professional football. Table 1 shows that nearly 50% of the total risk from injuries was associated with the 12% of major injuries; therefore significant reductions in the overall level of risk could be achieved if the treatment and rehabilitation programmes for these long term injuries could be reduced significantly. However, 22% of all injuries were attributable to re-injuries, which indicated that caution should be exercised before introduction of non-validated treatment and rehabilitation programmes. Inadequate rehabilitation and incomplete healing of injuries have been suggested as key reasons for the high levels of re-injury in football.16 In general, ankle and knee sprains and thigh strains have been identified as the injuries with the greatest chance of re-injury.17 Re-injuries are reported to be more severe than the original injury,18 and the results obtained from this study support this, as the average period of absence for re-injuries was 33% greater than that observed for new injuries. The probability of a re-injury occurring could be reduced if the sports science and medical team measured each player’s levels of fitness and physical condition when they were fully fit and used these values as benchmarks to assess a player’s level of recovery during an injury treatment and rehabilitation programme.
The high proportion of risk associated with player to player contact indicated that players had a high level of accountability for their own and other players’ injuries. More effective coaching, which would improve tackling skills, and appropriate education for players about the personal and third party consequences of poor tackling technique could both contribute to significant reductions in the number and severity of contact injuries. In addition, the number of player to player contact injuries could be further reduced through more effective control of players by referees and through the use of more stringent penalties for players causing injuries as a result of foul play. The proportion and level of risk associated with football specific activities indicated that many players were not adequately prepared for training and competition. Therefore, coaches and fitness trainers should take into account current sports science knowledge when developing balanced fitness and skills training programmes. However, it is the chairmen who define the allocation of financial resources to injury prevention, and the team managers who define the team’s playing culture within a football club, and as such they have the greatest influence on and responsibility for the levels of injury in professional football. It is essential that a club’s financial resources are allocated and utilised efficiently and effectively in order to reduce the overall risk to clubs and players. Drawer and Fuller19 have developed an economic framework, based on the relations between the availability and quality of players, team performance, club turnover, and team salaries, that can be applied to cost benefit analyses. However, by taking into account the number of players at a club, the rates of injury, and the equivalent monetary values at each level of injury severity, it is possible to obtain a relatively simple assessment of the costs associated with injury, which can then be used for evaluating and optimising resource allocations within a range of injury control strategies.
Conclusions
The results from this study have highlighted that the HSE would deem the levels of risk associated with professional football to be unacceptable. The high proportion of risk attributable to re-injuries illustrates the potential impact that managers may have when selecting players for competition before they have fully recovered from injury. The sports science and medical team has a major role to play in minimising the risks associated with re-injuries by developing effective and efficient injury rehabilitation programmes. The players, however, have a significant responsibility for the level of injury because of their poor standards of tackling and preparation for training and competition. Referees must also accept responsibility for their contribution to the level of injury through their role as arbitrators of the laws of the game, which have been developed to protect players from injury. Finally, the sport’s administrators must ensure that suspension and financial punishments are used to provide an adequate deterrent to those players whose poor technique or inappropriate tackling results in serious injuries to other players.
Take home message
The risk of injury to professional footballers has been assessed against the risk criteria of negligible, acceptable, tolerable, and unacceptable, which are used by regulators when assessing risks in other industrial and commercial sectors. The levels of risk associated with acute and chronic injuries are shown to fall within the unacceptable level of risk.