Article Text

Abstract
The methodology for studies designed to investigate potential risk factors for sports injury is reviewed, using the case of hamstring strains as an example. Injuries result from a complex interaction of multiple risk factors and events. Therefore, a multivariate statistical approach should be used. In addition, the sample size of the study needs to be considered carefully. Sample size mainly depends on the expected effect of the risk factor on injury risk, and to detect moderate to strong associations 20–50 injury cases are needed, whereas small to moderate associations would need about 200 injured subjects. Studies published to date on the risk factors for hamstring strains have methodological limitations, and are too small to detect small to moderate associations.
- risk factors
- methodology
- ACL, anterior cruciate ligament
- BMD, bone mineral density
- OR, odds ratio
- ROM, range of motion
- RR, relative risk
Statistics from Altmetric.com
- ACL, anterior cruciate ligament
- BMD, bone mineral density
- OR, odds ratio
- ROM, range of motion
- RR, relative risk
Aphysically active lifestyle is important for all age groups.1–3 Reasons to participate in sports and physical activity are many, such as pleasure and relaxation, competition, socialisation, maintenance, and improvement of fitness and health. Regular physical activity reduces the risk of premature mortality in general, and of coronary heart disease, hypertension, colon cancer, obesity, and diabetes mellitus in particular.1–3 However, sports participation also carries a risk for injuries, which may in some cases lead to permanent disability. Scandinavian studies document that sports injuries constitute 10–19% of all acute injuries seen in an emergency room.4–6 Some injury types, such as anterior cruciate ligament (ACL) injuries, are a growing cause of concern. The highest incidence is seen in 15–25 year old athletes in pivoting sports such as football, basketball and team handball; the incidence is 3–5 times higher among women than among men.7,8 ACL injury causes lengthy absence from work and sports, and dramatically increases the risk of long term sequelae—like abnormal joint dynamics and early onset of degenerative joint disease.9,10 Kujala et al11 investigated the post-career rate ratios for hospital care among former national team athletes and showed that the risk of hospitalisation for musculoskeletal disorders was higher than for an age-matched control group. Most likely, this can to some extent be explained by the increased risk of osteoarthritis among former elite athletes, as demonstrated in studies on Swedish soccer players,12,13 However, there is no evidence to prove that repair of the ruptured ACL or isolated cartilage lesions prevents further development of osteoarthritis.14 Other prevalent injury types, such as hamstrings strains or patellar tendinopathy, may be career-ending, although they as a rule do not lead to post-career disability. In other words, sports injuries are a significant cause for concern—for athletes, sports, and society. In fact, in a recent paper Drawer and Fuller15 showed that the risks associated with minor, moderate, and major acute injuries and osteoarthritis in lower limb joints of English professional footballers are unacceptable when evaluated against accepted criteria from the occupational health setting. Whereas developing improved treatment methods for injuries remains an important goal, it may be even more important to prevent injuries.
According to the van Mechelen model,16 once it has been recognised through injury surveillance that sports injuries constitute a threat to the health of athletes, the causes must be established as a next step towards injury prevention. This includes information on why a particular athlete may be at risk in a given situation (risk factors) or how injuries happen (injury mechanisms).17 Murphy et al18 have recently reviewed the literature on the risk factors for lower extremity injuries, demonstrating that our understanding of injury causation is limited. Many risk factors have been implicated; however, there is little agreement with respect to the findings. Partly, this can be attributed to limitations in study design and the statistical methods used to assess the results.18–20 Murphy et al18 conclude that more prospective studies are needed, emphasising the need for proper design and sufficient sample sizes.
Thus, the purpose of this review is to outline some methodological issues of particular importance when studying risk factors for sports injuries, using the case of hamstring strains—the most common injury type in many popular team sports21–25—as an example. The aim is to provide some guidance on how to plan and conduct studies on risk factors for sports injuries, with special emphasis on sample size calculations.
Risk factors and injury mechanisms—the Meeuwisse model
Risk factors are traditionally divided into two main categories: internal (or intrinsic) athlete-related risk factors and external (or extrinsic) environmental risk factors.16,26 An important point is that risk factors can be divided into modifiable and non-modifiable factors. Although non-modifiable risk factors such as gender and age may be of interest, as a minimum it is important to study factors which are potentially modifiable through physical training or behavioural approaches, such as strength, balance, or flexibility. However, merely to establish the internal and external risk factors for sports injuries is not enough. To establish a complete understanding of the causes, the mechanisms by which they occur must also be identified. In other words, sports injuries result from a complex interaction of multiple risk factors and events of which only a fraction have been identified.
Key points
-
Studies on the aetiology of sports injuries need to account for the multifactorial nature of sports injuries by including as many relevant risk factors as possible.
-
Risk factor studies need to be designed properly—in most cases a prospective cohort study is the appropriate model.
-
A multivariate statistical approach should be used, such as a linear logistic regression model or, preferably, a Cox regression model, if individual match and training participation can be recorded.
-
The sample size of the study needs to be considered carefully. Sample size mainly depends on the expected effect of the risk factor on injury risk, and to detect moderate to strong associations 20–50 injury cases are needed, whereas small to moderate associations would need about 200 injured subjects.
-
The accuracy of the methods used to measure potential risk factors and record injuries are critical factors which can influence sample size considerably.
-
Studies published to date on the risk factors for hamstring strains have methodological limitations, and are too small to detect small to moderate associations.
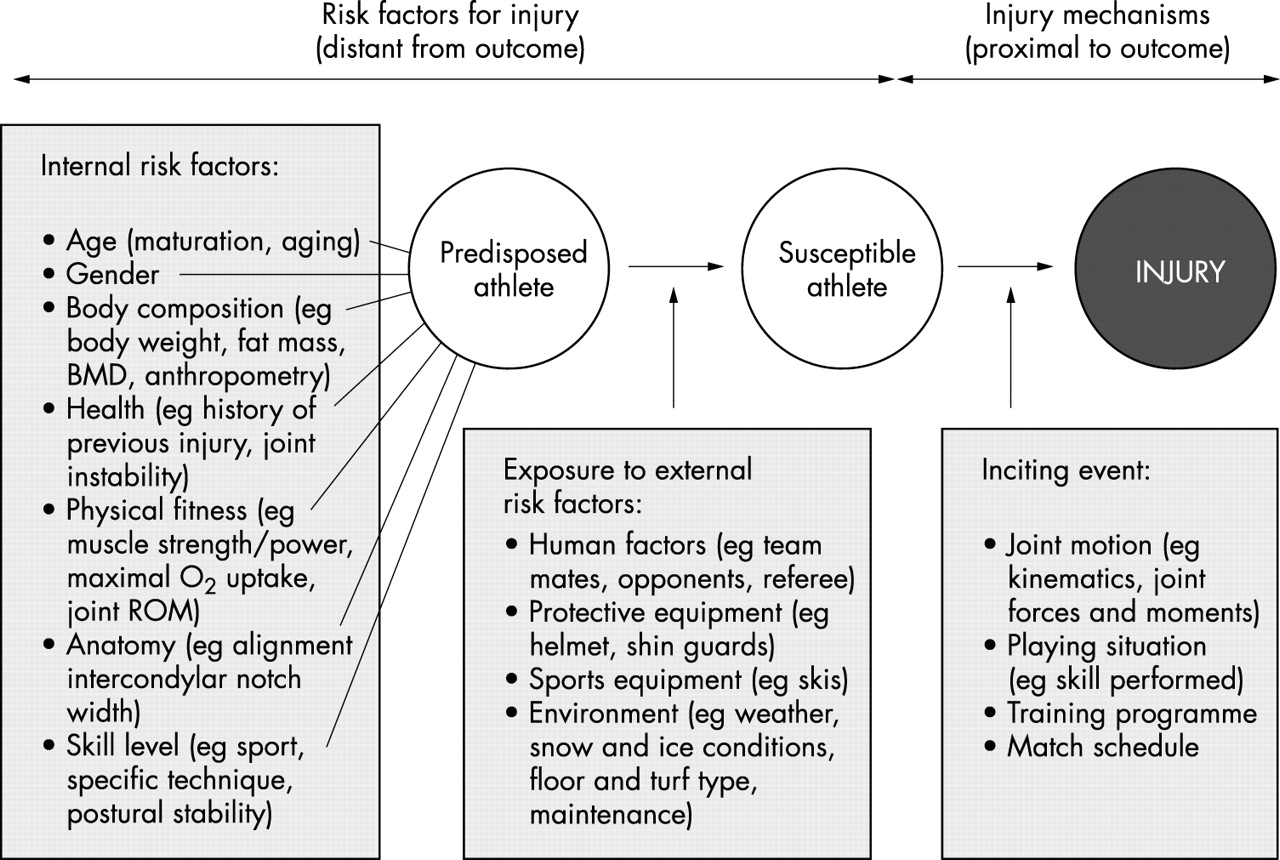
Therefore, studies on the aetiology of sports injuries require a dynamic model that accounts for the multifactorial nature of sports injuries, and in addition, takes the sequence of events eventually leading to an injury into account. One such dynamic model is described by Meeuwisse.27 This model describes how multiple factors interact to produce injury (fig 1).

A dynamic, multifactorial model of sports injury etiology—adapted from Meeuwisse (1994).43
In studies on the aetiology of sports injuries, this model can be used to explore the interrelationships between risk factors and their contribution to the occurrence of injury. Meeuwisse classifies the internal risk factors as predisposing factors that act from within, and that may be necessary, but seldom sufficient, to produce injury. In his theoretical model, external risk factors act on the predisposed athlete from outside and are classified as enabling factors in that they facilitate the manifestation of injury. It is the presence of both internal and external risk factors that renders the athlete susceptible to injury, but the mere presence of these risk factors is usually not sufficient to produce injury. The sum of these risk factors and the interaction between them “prepares” the athlete for an injury to occur in a given situation. Meeuwisse describes the inciting event as the final link in the chain that causes an injury, and such events are regarded as necessary causes. He also states that such an inciting event is usually directly associated with the onset of injury.
As shown in figure 1, we would argue that it is necessary to expand the traditional approach to describing the inciting event. Firstly, the term injury mechanism is often used to describe the inciting event in biomechanical terms only. For example, an ankle sprain could be described as resulting from an inversion injury, or an ACL injury from valgus trauma to the knee. However, to be complete, the description of the injury mechanism needs to account for all of the events leading to the situation where the injury took place.28 Examples of this include the playing situation (eg a two man block in volleyball), the position in the field of play (eg in the scoring box in soccer), the interaction with other players (eg being tackled from the side in American football), the skill performed by the injured player (eg a jump shot by a team handball player). Describing an ACL injury as a non-contact or contact injury does provide meaningful information, but leaves us far from having a complete understanding of the inciting event. If patterns can be established in the events leading to an injury situation, this information can potentially be more important and easier to apply to prevent injuries than an exact biomechanical description of joint motion at the point of injury. Secondly, the inciting event can—especially for overuse injuries—sometimes be distant from the outcome. For example, for a stress fracture in a long distance runner the inciting event is not usually the single training session when pain became evident, but the training and competition programme he or she has followed over the previous weeks or months.
Study designs for risk factor analyses—the case of hamstring strains
Three main study designs are available to study risk factors for sports injuries: case control studies, cohort studies and intervention studies (preferably done as a randomised controlled trial). In the following, we will illustrate the principles, strengths, and disadvantages of each of these three study designs using hamstring strains as an example (table 1).
Summary of the evidence for hamstrings strength, hip ROM, previous injury of the same type, and age as risk factors for hamstring strains. The table also shows whether a multivariate approach was used to analyse the data
Hamstring muscle strains (tears of the semimembranosus, the semitendinosus, or the biceps femoris muscles) occur in the myotendinous junction at any location along them, and are common in a number of sports—sprint, martial arts, water skiing, soccer, and other forms of football.21–25 The hamstring muscles are two-joint muscles that extend the hip joint and flex the knee joint. Although there are no studies that have examined the injury mechanisms directly and these may differ between sports, injuries are mainly thought to occur during maximum sprinting, when resisting knee extension or at foot strike.29,30 A number of candidate risk factors have been proposed for hamstring strains (for example, poor posture, neuromeningeal tightness, decreased muscle control, poor technique, ethnicity, muscle fatigue),31–37 but for the purposes of this discussion we will focus on three internal factors: previous injury, reduced ROM, and poor hamstrings strength. As shown below, the other factors have not been examined properly. In theory, limited ROM for hip flexion could mean that the muscle is vulnerable close to maximum length when muscle tension is at its maximum. Low hamstring strength would mean that the forces necessary to resist knee extension and start hip extension during maximal sprints could surpass the tolerance of the muscle-tendon unit. Hamstring strength is often expressed relative to quadriceps strength as the hamstrings: quadriceps ratio, since it is the relation between the ability of the quadriceps to generate speed and the capacity of the hamstrings to resist the resulting forces that is believed to be critical. A previous injury can cause scar tissue to form in the musculature, resulting in a less compliant area with increased risk of injury. A previous injury can also lead to reduced ROM or reduced strength, thereby indirectly affecting injury risk.36
In a case control study design, the approach is to compare the frequency or level of potential risk factors between a group of injured athletes and an otherwise comparable group of injury-free athletes. Often, information on risk factors is collected retrospectively, because the approach is to identify persons with the injury of interest and then look backward in time to identify factors that may have caused it. For hamstring strains, this could mean comparing a group of patients treated at a sports medicine clinic with a group of healthy athletes from the same sports. Three important assumptions must be met to use this approach.38 Firstly, the cases that are selected must be representative for all patients with the injury in question. Secondly, the controls must be representative of the population of injury-free athletes. Thirdly, the information on potential risk factors must be collected with adequate accuracy, and in the same way from cases and controls. In the first study on risk factors for hamstrings strains published by Burkett in 1970,39 he compared 17 injured and 50 healthy athletes by measuring their hamstring:quadriceps ratio and ROM for hip flexion. The results showed that the injured athletes had a lower strength ratio, while there was no difference in ROM. This study illustrates another important limitation of the case control approach—that is, to distinguish between risk factors and injury sequelae. Although all the subjects were tested after they had returned to full performance after their injury, it is not possible to know what the strength of the injured athletes was prior to injury. In other words, reduced strength could be a risk factor, or simply a result of the injury. The same limitations apply to the studies of Worrell et al40 and Jönhagen et al.41
The second, and in most cases preferable, study design is the cohort study, where all data are collected in a standardised manner prospectively in time. The approach involves measuring potential risk factors before injuries occur, after which new cases and exposure are reported during a period of follow up. Quality control is simplified and completeness can be secured to a high degree. Prospective cohort studies can provide direct and accurate estimates of incidence and relative risk. As will be discussed later, the main disadvantage of the cohort study design is that study size is critical. It may be necessary to include and monitor a large number of athletes for an exceedingly long study period, particularly for less common injury types.
A cohort study to assess risk factors for hamstring strains would involve examining a group of currently healthy athletes at baseline to test their hamstrings strength, hip ROM, and obtaining their history for previous hamstring strains. This cohort would then be followed prospectively to record injuries during a defined period of time, typically one or two seasons. At the end of the study, injured and non-injured athletes can be compared to examine whether there were any differences in strength, ROM, or the prevalence of former hamstring strains between the groups. To date, all three factors have not been examined in the same study (see table 1), but in the study of Bennell et al42 they used a similar approach to examine the effects of hamstring strength and former injury on the risk for new strains. The isokinetic strength of the hamstrings and quadriceps muscles was tested with an isokinetic dynamometer before the start of the season in a group of 102 Australian rules footballers. Twelve players sustained clinically diagnosed hamstring strains that caused them to miss one or more matches during the ensuing season. However, although they did not observe any differences in strength between the injured and the non-injured players, the power to detect even large differences may be low with only 12 injury cases. Nevertheless, players with previous injury were twice as likely to suffer a new injury compared with players with no history of a previous injury.
As emphasised in the Meeuwisse model,27 the preferred approach is to use a multivariate model, to control for interactions and confounding factors. For example, such an approach can be used to distinguish between the effect of previous injury per se, and the effect previous injury may have through, for example, reduced strength. Meeuwisse43 has reviewed the concepts of interaction (when two factors work together to produce a risk which is greater or lesser than expected) and confounding (when an association between two variables of interest could be due to the effects of a third variable) when assessing risk factors for athletic injury, and how to distinguish between them.
The third study design that can be used to study the effect of a particular risk factor on sports injury is the intervention study. Randomised large scale clinical trials provide the strongest evidence for both the causal nature of a modifiable risk factor, as well as the effectiveness of modifying that factor on preventing injury outcomes.38 This approach involves determining if a particular intervention designed to eliminate or at least reduce a risk factor, also results in a reduced risk of injury. For example, to test the association between hamstrings strength and injury risk, one could select a cohort of athletes at risk, and randomly assign half of them to a programme of strength training for the hamstrings. The relationship between strength as a risk factor and injury risk is established if strength training can be shown to lead to fewer injuries in the intervention group. A similar approach using a stretching programme could be used to test the relationship between ROM and the risk of hamstring strains. To date, no randomised controlled study has been conducted to test the effect of potential risk factors on hamstring strains. However, Heiser et al37 compared the risk of reinjury between American football players who underwent two different rehabilitation programmes after acute hamstring strains in a retrospective study. One group, treated in the period from 1978 to 1982, followed a rehabilitation programme that included an isokinetic strength training programme. The other group, treated from 1973 to 1977, did not. They showed that the risk of reinjury was reduced significantly in the strength training group (7.7% v 1.1%) by the addition of post-injury testing and strength training. Since specific strength training appears to have modified injury risk, this study indicates that reduced strength is a risk factor for reinjury.
However, although randomised controlled trials can provide the strongest evidence to evaluate cause-effect relationships, they are limited to risk factors that can be modified (for example through special training programmes or use of protective equipment), and they are usually used to assess the effect of only one factor at the time. However, additional factors can be included by including more groups if the factors can be assumed to be additive on injury risk. For instance, a study could have one control group, one strength training group, one stretching group, and one group doing stretching and strength training to test the effects of strength and flexibility on hamstring strains, a 2×2 factorial design. Deciding when to initiate a clinical trial can therefore be controversial. They should not be undertaken until there is a substantial body of knowledge suggesting that intervention may be effective, but not so late that conducting them would be considered unethical.38 Finally, it is arguably unethical to undertake a clinical trial simply to prove harm. Therefore, the first step to establish the relationship between potential risk factors and sports injuries will in most cases be to conduct a prospective cohort study.
Statistical methods in sports injury risk factor studies
Risk factors of interest in injury research can be classified in two groups, continuous variables and categorical variables. Examples of continuous variables include most anthropometric and physiological factors, such as body composition, age, strength, flexibility, aerobic power or running speed. Examples of categorical (grouping) variables include gender (male v female), previous injury (no previous injury v history of previous injury), player function (attacker v defender). Statistical analyses or risk factor data have, as mentioned above, usually been done in a simplistic manner without much use of statistical modelling tools—as a rule using univariate tests, where the effect of each risk factor is tested separately. An example of a univariate test to assess the effect on injury risk of a categorical variable is the χ2 test, which compares the injury rate between groups. As an example, the effect of previous injury status can be assessed by comparing the risk of injury between previously injured and non-injured athletes. In a recent Icelandic study by Arnason et al on hamstring strains among soccer players the players were followed for one season and each leg was categorised as healthy or previously injured based on their injury history of hamstring strains.44 A total of 10 re-injuries occurred in the 74 previously injured thighs, while there were only nine new strains among the 442 thighs that had been classified as healthy. Based on these numbers risk can be expressed as the odds ratio (OR) or the relative risk (RR, sometimes also referred to as risk ratio).45 The RR is the ratio of the rate of injury in previously injured thighs (10/74; 13.5%) to the rate of injury in thighs without previous injury (9/442; 2.0%). The OR is the ratio of the odds in the previously injured group (10 injured: 64 with no injury) to the odds in the healthy group (9 injured: 433 with no injury). Thus, the OR may be calculated as (10/64)/(9/433) = 7.5 (ZWald = 4.17; p<0.0001), while the RR was (10/74)/(9/442) = 6.6 (ZWald = 4.27; p<0.0001). In other words, the risk of injury is about seven times higher in previously injured thighs. The OR and RR are similar when the frequency of injury is low; they diverge when injuries become more frequent.
It should be noted that in this analysis of previous injury as a risk factor, the limbs of the athlete were used as the unit of analysis rather than the person. Although we typically treat the athlete as the unit of analysis (for variables such as age, gender, training background, etc), the question is whether we should treat their past history of injury differently (that is, treat the limb as the unit of analysis rather than the individual). It seems reasonable to assume that the factors that contribute towards an increased risk of reinjury are related to the injured limb (for example, reduced proprioception, increased joint laxity, scar tissue formation, reduced ROM), and not the person. On the other hand, it may be argued that some athletes are more prone to injury than others—for example, because of an aggressive playing style. With few exceptions,44,46 until now the person rather than the limb has been used as the unit of analysis in studies where past history of injury has been examined as a risk factor—for example, for ankle sprains47–49 and hamstring strains.50,51 Whether to treat the limb or the person as the unit of analysis depends on the risk factor. If the risk factor can be assumed to represent a characteristic of the person, such as age or gender, the person should be used as the unit of analysis. If the risk factor in question can be assumed to describe a characteristic of the limb, such as may be argued for previous injury, the limb should be used instead.
The same study by Arnason et al44 also shows how the effect of a continuous variable can be evaluated. This is usually done using simple t tests or alike to compare the average between injured and non-injured groups. In this study the average age of the players with a new hamstring strain (n=18) was 27.8 years, while the age of the uninjured players (n=280) was 23.8 years (p<0.001, t test). In other words, from this it appears that older players were more susceptible for hamstring strains. However, this type of analysis does not reveal whether the injury risk increases linearly with age. It may be that only players over a certain age—for example, 30 years, have an increased risk, while the risk is low for players under 30, regardless of their age. This hypothesis would be relevant, if hamstrings strains were the result of age related processes within muscles which begin after the age of 30. The opposite hypothesis could be that the youngest players are at greater risk because they are not accustomed to playing at a high level, perhaps with an insufficient training background. In a case like this, where the relationship between a continuous risk factor and risk of injury can be assumed not to be linear, the risk factor can be dichotomised at a certain cut off point—for example, one standard deviation (1 SD) below or above the mean value for the entire cohort. In other words, a continuous variable can be transformed to a categorical grouping variable, in this example three groups: older (players older than the mean +1 SD), young (those with an age lower than the mean −1 SD), as well as an intermediate reference group (with an age within ±1 SD of the mean). This way, the risk of injury can be compared between older players and the intermediate reference group, or between younger players and the reference group, if that is thought to be relevant. Table 2 shows an example of how this was done in the same Icelandic study. The mean age for the entire cohort was 24 years, with a standard deviation of four years. Based on this, the players were separated into three age groups, <20 yrs, 20–28 yrs and >28 yrs, and ORs could be calculated for risk of injury to compare the older and younger groups with the reference group. The results show that the odds ratio for older players was 1.77 compared with the reference group (p<0.001), while there were no injuries among the youngest players.
Example showing how a continuous variable (age) can be transformed to a grouping variable to compare risk of injury (hamstring strains) between groups. The players have been split into three groups using the mean −1 SD (20 yrs) and the mean +1 SD (28 yrs) as the cutoff values: Younger, older, and an intermediate reference group. The data have been taken from Arnason et al44
However, a univariate statistical approach may be too simplistic, since injuries may be generated by the interplay of several factors. A multivariate approach is often necessary in sports injury risk factor studies, and one statistical model commonly used to achieve this is the linear logistic regression model. The restriction here is that observation times—the number of hours each subject participates in training or matches—must be about equal. In many sports injury studies this assumption is reasonably met by including an observation period of one or more full sport seasons for every subject. This model assumes a linear relationship between the logarithm of the odds of having an injury and the risk factors.45 If the frequency of the injury is p (eg 10%), the linear univariate logistic model can be written Log (p/1-p) = α + β • x in the univariate case, where x is the risk factor, eg age. The most interesting factor in the model is β. It tells how much the log odds increase by increasing x with 1 unit, eg an age increase of one year. Another way to express this is as the odds ratio, which in this case is calculated as exp (β • x). In the same Icelandic study44 a logistic regression analysis was performed for risk of injury due to hamstring strains versus age as risk factor. The estimate of β was 0.33, giving a 1 year OR = exp (0.33) = 1.40. This means that for every one year a player gets older the risk of a new hamstring strain can be estimated to increase by as much as 40% in this player population.
The advantage of the logistic regression model is that it can easily be extended to include one or more confounding risk factors by adding more risk factor terms in the model, ie log (p/1-p) = βo + β1X + β2X2 + β3X3 etc.45 Such risk factors can be continuous or categorical variables. In the Icelandic study this was done by adding age (X1), previous hamstring strain (X2, 1 or 0), body weight (X3), and body composition (X4). The final two factors were not significant, and the paper reported β1 = 0.34 and β2 = 2.45. The risk of a new hamstring strain was thus estimated to be e2.45 = 11.6 times higher among athletes with a previous hamstring strain than among those without, adjusted for differences in age, body weight, and body composition. From this model we also see that the risk increases by 40% for every year the athlete gets older (e0.34 = 1.40), adjusted for previous injury, etc. In other words, age is a significant risk factor in itself, the increased risk of injury in older players is not just a result of the higher prevalence of previous injury among older players.
In this model, it is not necessary to know the exact exposure time of each athlete, but it must be assumed that participation has been about equal for every athlete. However, this is not always the case, exposure may be reduced because of injury and athletes may leave the team for a number of reasons other than injury (see fig 2). A more advanced model to study risk of injury is the Cox proportional hazards regression models.52 The time from the start of the follow up period until the event (that is, the first injury) or the end of follow up (for players that are not injured) is here the main variable. Time is measured as the number of hours of exposure for each player (such as training and match participation). The strength of this approach is that the method can adjust for the fact that playing time can vary greatly between players on a team. This may be important, since the best players play more games than the substitutes, and perhaps even train harder. It also takes censorship into account, such as abbreviated lengths of follow up for other reasons than injury (for example, sickness, moving, quitting the sport) (see example in fig 2). The method assumes that risk factors affect injury risk in a proportional manner across time. Both continuous and grouping variables can be used as risk factors in the model, as in the logistic model. In this model the logarithm of the hazard rate is linear in the risk factors—that is, log hazard rate = α + β • x, when x is a single risk factor. Relative risk (RR) for a change in x can be estimated by exp (β • x). Thus, the interpretation is similar to that of logistic regression, the difference being that RR is estimated instead of OR.

Example of data structure for a Cox regression model. The main outcome variable is the time until event. In this example five of 22 players were injured during the observation period; #3, #6, #10, #17 and #22. In addition, three players were censored for other reasons; #8 turned professional and left the country, #11 quit playing because of a different injury, and #12 became ill with mononucleosis. In a Cox regression, the censored players are included in the analysis, adjusting for the reduced follow up period. Ideally, the exposure of each player should be counted as the number of hours they participated in training and matches, not simply the weeks or months of observation time.
This model, as well as the logistic model, can also be used to explore potential interactive effects. If one wants to explore if age works interactively with previous hamstring strain on the risk for new hamstring strains, the model would include linear terms for age (continuous) and previous hamstring strain (categorical) with an addition term equal to the product of the two factors. Interaction is declared if the product term is statistically significant in the regression model. Note that the statistical power for a test of interaction on risk will usually be much smaller than for demonstrating an effect of each factor. p Values for interaction are often therefore chosen to be higher than 5%, (for example, 10–15%). The concept of confounding will be difficult to interpret if interaction is present, so a pre-test of interaction is recommended before a regular multivariate and additive risk factor analysis is undertaken.
When considering whether to use a logistic or a Cox regression model, the advantage of logistic regression is that it is somewhat simpler. It does not require the investigator to monitor the participation in training and matches for each individual. Whereas accurate attendance records can be obtained when following teams or athletes at the elite or professional level, this may not be possible when studying younger or less organised teams. In such a case, if all athletes are followed for a full season, the logistic model would be chosen. The limitation of the logistic model is that it assumes equal probability of injury for all included. Another limitation is if the observation period is long, resulting in a large proportion of the subjects being injured. In contrast, in a Cox model exposure time is worked into the model, which will provide unbiased estimates of relative risks. Therefore, if individual exposure time can be collected with a reasonable accuracy—and that requires a well developed recording system—the Cox model approach would be preferable in most cases.
Risk factors for sports injuries—the significance of study size
In addition to a proper study design and choice of appropriate statistical methods, another factor which needs to be considered carefully is the sample size of the study. As pointed out by Murphy et al,18 a persistent problem is the relatively small number of subjects and injuries included in the risk factor studies published so far. For example, in the studies available on risk factors for hamstring strains the number of injured athletes ranges from 6 to 31, as shown in table 1. A study by Orchard51 on Australian rules footballers is the only exception with as many as 672 injuries, but this study only included descriptive questionnaire data (for example, age, history of previous injury, height, weight). No test data were available on other, potentially modifiable risk factors (for example, strength, ROM). For the rest of the cohort studies available, the number of cases may have been too small to provide a definite answer. In addition, there is typically no mention of how sample size has been calculated, which means that it is not possible to interpret a negative result.
In technical terms, the studies may lack power. The power of a study is its ability to demonstrate that there is an association between a risk factor and injury, given that the association exists.45 A typical value is 80%—that is, the study is designed so that the chance of detecting a true difference is 80%, and we accept that we will miss the true difference in 20% of instances. If we need to be more confident that we will not overlook a true effect, we may need a power of 90% or more, which will require many more subjects. The factors that affect the power of a study are: the strength of the true association between the risk factor and injury risk (the stronger the association, the fewer cases are needed), the injury frequency (in general, the more frequent the injury, the fewer cases are needed), and the significance level (usually set at the p=0.05 level).
Sample size calculations should be performed specific to the type of statistical test which will be used to evaluate the main effect. Below we have outlined how sample size can be calculated using a univariate Cox model without adjustments for other factors.53 It is possible to perform power calculations taking additional risk factors into account, but these more complicated models are beyond the scope of this review. In addition to the power and significance level, the investigator has to consider the coefficient β in the Cox model and the injury frequency p. The injury frequency p can often be estimated with good precision from previous studies for most injury types, but the strength of the relationship between a risk factor and the frequency of that injury type (β) is usually uncertain. A practical solution is to decide on a given value of β (the RR = eβ • x for a given difference x) which is thought to be clinically important, and calculate sample size so that the probability of missing such an effect is low. However, it should be acknowledged that it may be difficult to decide what is clinically important—that is, which value of β should be decided on.
When the study is finished sample size can be recalculated from the estimated value of β, or alternatively the power of the study to detect an effect can be calculated, should the study fail to find a significant relationship. An alternative is to incorporate interim analyses into the study design to examine outcome data at an early stage to adjust the sample size calculation or extend the length of the study. Often the reason for non-significance is that the strength of the relationship has been overestimated—that the effect of the risk factor is lower than anticipated. Sometimes, though, the injury frequency can be lower than anticipated, and cause loss of power as well.
Schmoor et al54 have among others given formulas for calculation of sample size with a Cox regression model (box 1), and table 3 shows the sample size for some chosen values of p and relative risk. From the table it is evident that only rather strong relationships in combination with a fairly prevalent injury type will defend a design with less than 300 subjects. The table also illustrates how the sample size mainly depends on the effect size, but also to some degree by the projected proportion of injured subjects. Moderate to strong associations can be detected with 30–40 injury cases, whereas small to moderate associations would need more than 200 cases. As shown in table 1, this means that the cohort studies published to date on risk factors for hamstring strains have limited statistical power, and can only be expected to have detected strong relationships. In other words, a negative finding could result from a type 2 error (overlooking a true effect), since the studies are too small to detect anything but strong relationships.
Sample size (N) needed to detect a significant association between a risk factor and injury for some chosen values of log odds ratio (β) and injury frequency (p). Assumption: Univariate Cox regression model with censorship probability 1-q=0.10. This means that on the average the non-injured subjects in the study will be absent for other reasons than injury for 10% of the observation period
Calculation of sample size in the univariate Cox proportional hazards regression model. Recall that the hazard rate in a general Cox model can be written as:

if k risk factors X1, . . ., Xk are considered. ëo (t) is an underlying risk function by time. For simplicity let us consider a situation with k=1 and X1=previous injury (Yes=1, No=0) and we want to estimate the necessary sample size to detect a doubling of risk between previously injured and non-injured athletes. Let the incidence of previous injury be p=0.10 (ie 10 % of the subjects have experienced a previous injury at baseline). This means that with a RR equal to 2.0 between previous injured and non-injured, the model will be: RR=eâ1• 0.10=2.0, i.e. β1 =
log(2.0) = 0.69. If we want the test to have a significance level α=0.05 and power 1-β=0.90, the probability quantiles corresponding to this in the normal distribution are 1.96 and 1.28, respectively. The formula for total sample size is then:

where q is the probability of not being censored. This means that if q=0.90, the non-injured subjects in the study will on the average be exposed during 90% of the observation period, for example, the season. With logRR=0.69, p=0.10, q=0.90,

that is, we will need 273 athletes of whom about 27 will have a previous injury. Table 3 gives necessary sample sizes for various combinations of previous injury frequencies p and RR in the case with q=0.90.
The effect of measurement errors
The ability to identify the effect of a potential risk factor also depends on how accurately the factor can be measured at baseline. As shown in fig 1, a number of internal and external factors can potentially influence injury risk. The challenge when designing a risk factor study is to decide which factors to measure, and how to measure them. Although non-modifiable risk factors may be of interest, studies should at least focus on modifiable factors which can be subject to intervention by physical training or behavioural approaches. Ideally, these factors should be easy to measure and with excellent precision. Unfortunately, this is not always the case. It is important to collect methodological information on risk factors when planning a study, since the measurement error can make it more or less difficult to detect risk factor associations with injury risk. Factors like age and sex, height, and weight are typically measured with high precision. A typical risk factor in many sport injury studies is the variable “previous injury of the same type”. The measurement error here is probably low and its association to injury may therefore be easier to detect statistically. However, the ability to recall and properly classify a previous injury depends on the injury type, as discussed below. Other variables such as maximal O2 uptake, strength, and ROM have a variable degree of measurement errors.55
The precision of a measurement method or test for a risk factor can be assessed by making two measurements of the variable on the same group of subjects some time apart. The precision can be expressed in several ways—for example, as the intraclass correlation coefficient (ICC). An ICC of 1.00 signifies a perfect precision—that is, the method gives the exact same result in both cases. For example, the ICC for maximal hamstring strength ranges between 0.82 and 0.97,56 while the ICC of a passive knee extension test to measure hamstring flexibility is 0.99.57 A study to detect associations between hamstring strength risk of hamstring strains will therefore have an extra burden to carry with respect to loss of power. If the ICC is 0.8, the regression coefficient will be inflated by this factor, so the error-free association between risk factor and injury risk will be β1/0.8. This means that the necessary sample size (see formulae in box 1) will increase by a factor of approximately (1/0.8)2 ≈ 1.56, by more than 50%. In other words, a cohort study to detect small to moderate associations would not only need at least 100 cases, but more than 150 cases, if the method used to measure the risk factor in question has an ICC of less than 0.8.
A final point to consider is the accuracy of the recording of injured cases. A recording system, often with the help of team medical staff, has to be established to document all injuries of interest during the observation period. The key is to not miss any of the injuries of interest, and to make sure that there are no false positives by using appropriate methods and precise diagnostic criteria—for example, documenting that an alleged ACL injury really is an ACL injury through an arthroscopic exam or MRI. Not to miss any injuries is a significant challenge when using team medical staff or coaches to record injuries, especially at lower levels where the physical therapist or physician does not attend all training sessions and matches. This can probably be accomplished with more severe injuries, such as ACL injuries, where it is extremely unlikely that a player can continue to train or play after a complete rupture. In contrast, for hamstring strains minor injuries only resulting in reduced performance or a few days of missed participation may be overlooked. Also, it can be difficult to distinguish a true muscle strain injury from other conditions which can lead to pain in the posterior thigh. In the hamstring studies available, the diagnosis was made by the team physical therapist or physician based on a clinical examination only in all but one study. The exception is the study by Verrall et al,50 where they made a point of documenting all hamstring strain injuries through the use of MRI. They showed that of the 32 clinically diagnosed hamstring strain injuries recorded, six of the patients had normal scans. A precise recording system—where no injuries are missed and all injuries are properly documented—is an essential prerequisite in risk factor studies.
Conclusions
Studies on the aetiology of sports injuries need to account for the multifactorial nature of sports injuries by including as many relevant risk factors as possible and using a multivariate statistical approach. The sample size of the study needs to be considered carefully and this depends mainly on the expected effect of the risk factor on injury risk. To detect moderate to strong associations 20–50 injury cases are needed, whereas small to moderate associations would need about 200 injured subjects. Further studies are needed on the risk factors for hamstring strains, since the studies that have been published to date suffer from methodological limitations and are too small to detect small to moderate associations.
Acknowledgements
The Oslo Sports Trauma Research Center has been established at the Norwegian University of Sport & Physical Education through generous grants from the Royal Norwegian Ministry of Culture, the Norwegian Olympic Committee & Confederation of Sport, Norsk Tipping AS, and Pfizer AS. We would like to thank our colleagues for comments to the manuscript.