Article Text

Abstract
Objectives: To study hydration status in referees (main) and assistant referees (linesmen) during official football matches.
Methods: Twelve male football referees were evaluated; all were volunteers. Before and after each match, the referee and one of the assistants were weighed without clothes and a blood sample was taken. Total water loss was determined for each subject from the change in body weight. The main haematological variables were analysed in the blood samples. Total plasma protein concentration and osmolarity were also determined. Variation in plasma volume was determined from changes in packed cell volume and a combination of changes in packed cell volume and haemoglobin concentrations.
Results: During a match, total body water loss was 1.60 (0.13) litres, equivalent to 2.05 (0.18)% of body weight. Body weight was reduced by 1.55 (0.12)%, showing that water ingestion during the interval replaces only 24.4% of the body fluids lost during the match. The assistants lost 0.79 (0.19) litre of water, equivalent to 1.05 (0.25)% of body weight. The referees showed a significant decrease in plasma volume of 4.99 (1.33)%. The assistants showed a non-significant increase in plasma volume. The reduction in plasma volume observed in the referees correlated significantly with total body water loss (r = 0.9623). From these data, it is possible to predict that a dehydration of 1% reflects a reduction in plasma volume of nearly 2.5%.
Conclusions: Referees are moderately dehydrated after a football match (2%), whereas assistants show a non-significant dehydration of 1% of their body weight.
- football referee
- dehydration
- plasma volume
- sweat loss
- exercise
Statistics from Altmetric.com
The football referee assisted by two assistants (linesmen) has the responsibility of supervising and judging the action of the players and penalising offending players.1 The increasing economic importance of football matches has increased enormously the physical and psychological demands on referees.2 Despite the importance of the role of the referee in a football match, their physical and psychological status and performance have been little studied.3 Rontoyannis et al4 made a medical, morphological, and functional evaluation of a heterogeneous group of active Greek football referees. The physical condition of most of the referees in divisions A and B was adequate compared with international standards, but they were clearly less fit than football players. Others have examined the movement patterns using video recordings and heart rates during official football matches in different countries.5–8 The mean distance covered during a match was 9200–11300 m. A small but insignificant fall in work rate was noted in the second half of the game. The mean heart rate of 165 beats/min did not vary between the first and second halves.5,6
Dehydration—that is, body water loss—is commonly observed during physical activity, and is usually of greatest relevance to participants in endurance activities. It is exacerbated by environmental conditions that increase fluid loss (heat, humidity, lack of wind), by fluid restriction, and by high intensity activities that require dissipation of more metabolic heat.9 Negative effects on performance have been shown with modest dehydration (2% of body weight), and these effects are exacerbated in a hot environment.9,10 It is generally accepted that cognitive performance is also impaired when dehydration and hyperthermia are present.11 This is particularly important in the decision making aspect of refereeing.
Several methods have been developed to determine whole body hydration status.12 The simplest consists of observing changes in nude body weight during exercise, assuming that a 1 g change in mass represents a 1 ml change in water status. However, to obtain a correct estimation of total body water loss, the consumption of food and fluid during exercise must be considered.13 Urinary data, including volume, colour, protein content, specific gravity, and osmolarity have been investigated as markers of hydration status.12 Another way to analyse body hydration status is to study changes in plasma volume during exercise. Plasma volume change has been estimated by different methods such as measurement of protein content,14 Evans Blue dilution,15 radiolabelled albumin dilution,16 packed cell volume,17 and a combination of haemoglobin concentration and packed cell volume.18,19 Methods that use haematological variables are simple and economical, and have been used to study dehydration in various physical activities—for example, marathon,13,20 cycle ergometry,21 triathlon,22 and football.23,24 However, the hydration status of soccer referees during a match has not been studied.
The purpose of this work was to study changes in hydration status in referees and assistant referees during official football matches. Different methods used to analyse body hydration status were also evaluated.
METHODS
Participants and experimental design
Twelve male football referees credited by the Arbitration Commission of the State of Paraná (Brazil) Football Federation volunteered as subjects. Written consent was obtained from each after approval of the experimental protocol by the ethics committee of the University Hospital of the Federal University of Paraná. All were informed verbally and in written form about the nature and demands of the study, as well as about health risks. They were told that they could withdraw from the study at any time. They were divided into two groups: six referees with mean (SD) age of 36.7 (2.48) years, and six assistant referees with mean (SD) age of 32.3 (1.30) years. The study was carried out during official matches of the 2000 Paraná football championship, in the period March–May, which are autumn months in Brazil. Before and 10 minutes after the match, the referees emptied their bladders. Nude body weight was then determined to the nearest 10 g using a digital balance (Plena, model MS-601). The difference in readings before and after a match, plus the ad libitum water intake during half time and urinary volume, were used to estimate total body water loss during the match.13,21 We assumed that a body mass loss of 1 kg is equivalent to loss of 1 litre of fluid.12 The measurement error was 0.1 kg—that is, ± 0.14% for weight, and ± 0.3% for volume.
Blood analysis
Blood samples were taken 10 minutes before and 10 minutes after the match from an antecubital vein while the subjects were seated, and were later analysed for relevant haematological variables. Haemoglobin concentration and packed cell volume were determined using an automatic analyser (Cell Dyn 1400; Abbott, Abbott Park, Illinois, USA). Packed cell volume was determined electronically from the voltage change caused by the passage of blood cells through a special transducer. The voltage change is proportional to the cell volume. The measurement error was ± 0.9%. Haemoglobin concentration was determined by the standard cyanmethaemoglobin method: cells are lysed and haemoglobin oxidised to methaemoglobin, which reacts with cyanide to produce cyanmethaemoglobin, the concentration of which is determined from light absorption at 540 nm. The measurement error was 1 g/l, ± 0.7%. Packed cell volume was multiplied by a factor of 0.96 to correct for trapped plasma and again by 0.91 to convert venous packed cell volume into whole body packed cell volume.25 Mean corpuscular volume and mean corpuscular haemoglobin were calculated from erythrocyte counts, haemoglobin concentration, and packed cell volume by standard methods. Total plasma protein concentration was determined by the Biuret method, and the measurement error was 2.1 g/l, ± 3%. Plasma osmolality was determined by freezing point depression (Fiske OM; Osmometer, Norwood, Massachusetts, USA). The measurement error was ± 1.5 mOsm/kg, ± 0.5%.
Changes in plasma volume were calculated using the values for packed cell volume and haemoglobin concentration obtained before and after the match. Percentage change in plasma volume was calculated first from the increase in packed cell volume associated with exercise, according to the formula described by Van Beaumont et al.17 It was also calculated from changes in both packed cell volume and haemoglobin concentration as described by Strauss et al,19 to correct for any change in cell volume that may be associated with changes in plasma volume or osmolality. Percentage changes in blood volume were calculated from equations developed by Dill and Costill18:


where BV is blood volume, Hgb is haemoglobin concentration %ΔBV is percentage change in blood volume, and the subscripts pre and post refer to before and after the match, respectively. BVpre was taken as 100.
The proportional changes in total plasma protein content were calculated using values for packed cell volume and plasma protein concentration obtained before and after exercise, as described by Van Beaumont et al.26
Statistical analysis
Data are reported as means (SEM). Mean differences between variables were tested for significance with two-tailed Student’s t tests (paired or unpaired, as applicable), with Bonferroni corrections for multiple comparisons. Pearson product-moment correlations were calculated to determine bivariate correlation between selected variables. Significance was set as p<0.05 for all statistical tests.
RESULTS
The environmental conditions during the matches were warm with a mean (SEM) temperature of 20.3 (1.1)°C and a humidity of 76.8 (3.5)%. All the matches were played at the same time, 1600–1800. Table 1 shows losses of body weight and body water during matches for referees and their assistants. Referees lost 1.22 (0.10) kg body weight, equivalent to 1.55 (0.12)% of their pre-match weight. Total body water loss averaged 1.60 (0.13) litres, equivalent to 2.05 (0.18)% of their pre-match body weight. These two percentages are significantly (p = 0.005) different (table 1 and fig 1). Assistant referees lost 0.63 (0.17)% of their body weight, and total body water loss represented 1.05 (0.25)% of pre-match weight. These percentages are significantly different, p = 0.031. The percentage body weight lost by the referees was larger than that lost by the assistants: 1.55 (0.12)% v 0.63 (017)%, p = 0.001 (fig 1). Total body water loss was also significantly larger for the referees than for the assistants: 2.05 (0.18)% v 1.05 (0.25)%, p = 0.008 (fig 1). The changes in body weight and total body water loss were clearly not due to technical error of measurements of weight and volume (see Methods).
Loss of body weight and total body water during the match
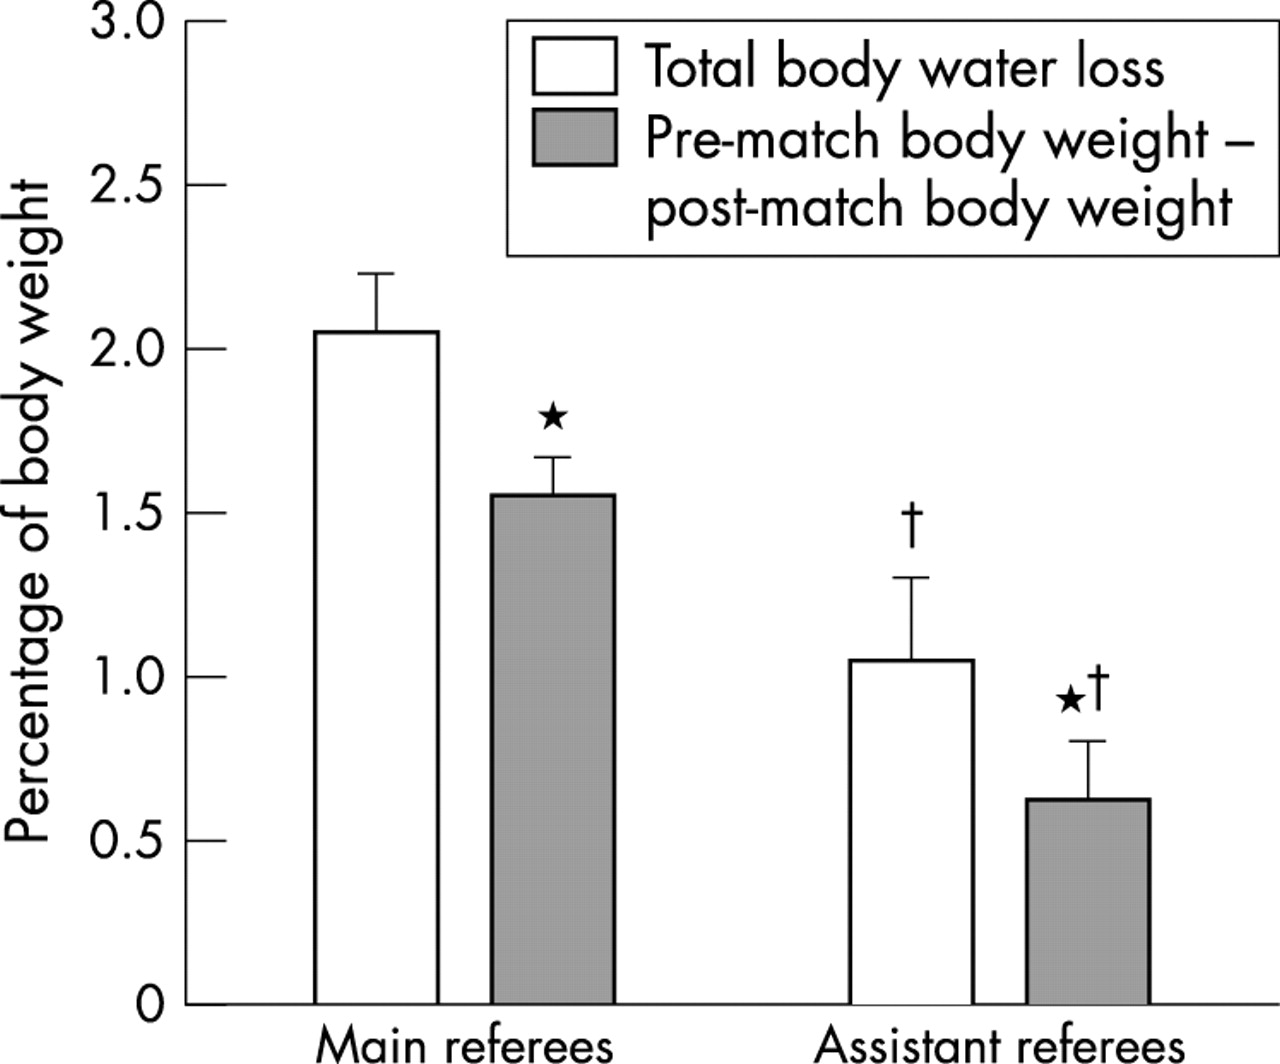
Changes in body weight and total water loss during the match for referees and their assistants, represented as a percentage of body weight before the match. *p<0.05 compared with total body water loss; †p<0.05 compared with main referees.
Table 2 presents values for various haematological variables before the match. All were within normal clinical limits for men of their ages and fitness levels. There was a significant increase in corrected packed cell volume for the referees after the match (39.00 (0.26) v 37.78 (0.27), p = 0.008) and a non-significant increase in whole blood haemoglobin concentration (15.02 (1.6) v 146.2 (1.5) g/l). These changes indicate a reduction in the plasma volume of referees. There were no significant changes in the haematological variables of the assistant referees (table 2).
Values for haematological variables before and after the match
Plasma osmolarity and protein concentration did not alter significantly during the match (table 2). When the change in total plasma protein content was calculated, a small non-significant decrease was noted for the referees: −5.03 (7.58)% (n = 6).
Plasma volume
Percentage change in plasma volume during the match was calculated first from the changes observed in packed cell volume.17 There was a significant reduction in plasma volume for the referees: −4.99 (1.33)% (p = 0.013), and a non-significant increase of 2.46 (1.74)% for the assistants. When the percentage plasma volume change was calculated from changes in both packed cell volume and haemoglobin concentration,19 we observed a reduction of −4.54 (1.16)% (p = 0.011) for the referees and a non-significant increment of 2.32 (1.37)% for the assistants. The differences observed between referees and assistants were significant, p<0.01, no matter which method was used to calculate the percentage change in plasma volume. The two methods used to calculate percent plasma volume change in the referees during the match were highly and significantly correlated (r = 0.9653), and there was no difference between them. There was also a significant correlation (r = 0.9412) for assistants.
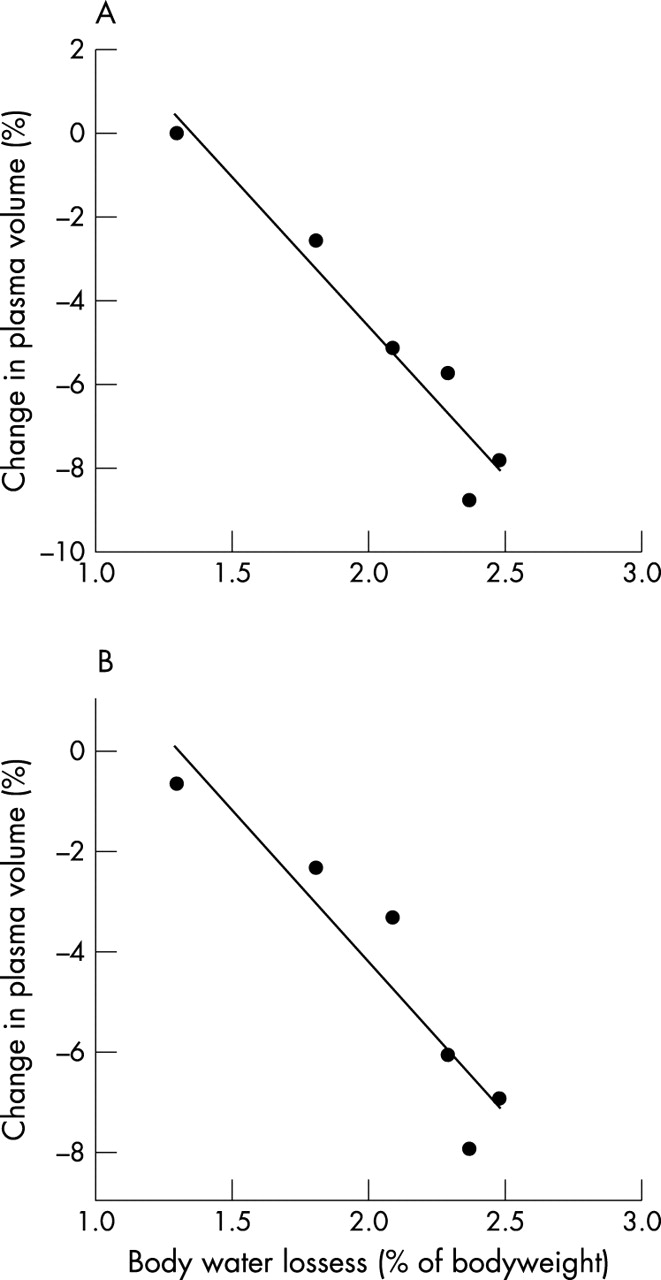
The reduction observed in plasma volume of the referees was linearly related to total body water loss (fig 2). This relation was highly significant when changes in packed cell volume were used to determine percentage plasma volume change (r = 0.9623; fig 2A), and also when changes in packed cell volume and haemoglobin concentration were used (r = 0.934; fig 2B).

Correlation between changes in plasma volume and total body water loss in main referees. (A) Changes in packed cell volume were used to determine percentage change in plasma volume (r = 0.9623; (B) changes in packed cell volume and haemoglobin concentration were used to determine percentage change in plasma volume (r = 0.934).
When the percentage changes in blood volume were calculated for the referees, we observed a significant (p = 0.012) reduction (−2.64 (0.69)%). Assistants showed a non-significant increase in blood volume (1.31 (0.71)%). These changes in blood volume are similar to those observed for plasma volume.
DISCUSSION
Loss of body fluids during physical activity has been observed in sports, such as the marathon, American football, basketball, football, hockey, and others. The degree of dehydration observed in footballers has been studied by several authors.23,25,27 Kirkendall et al25 reported a loss of volume of 1.70% of the corporal weight, Leatt28 observed a reduction of 2.80%, and Mustafa and Mahmoud27 a reduction of 3.08% in players during a football match. The differences found between the studies may be related to the differences in ambient temperature—for example, 19°C25 and 33°C.27 It is well known that an increase in ambient temperature stimulates body fluid loss.11 However, no previous study has evaluated these variables in football referees.
In this work we studied body fluid loss in football referees (main and assistants) after normal matches of 90 minutes duration, divided into two periods of 45 minutes with 15 minutes interval. The referees showed a total body water loss of 1.60 (0.13) litres, equivalent to 2.05 (0.18)% of their body weight. However, body weight was reduced by 1.55 (0.12)%, showing that intake of water during the interval restores only 24.4% of fluids lost during the match (table 1 and fig 1). On the other hand, the assistants lost 0.79 (0.19) litre of water, equivalent to 1.05 (0.25)% of their body weight. In this case the intake of water replaces 40% of fluids lost (table 1 and fig 1). These results show that referees develop moderate dehydration during a match which is not redressed by the spontaneous intake of liquid in the interval. The dehydration of the assistants was significantly less, probably because they are less active during a match. The mean distance covered during a match by referees is 9200–9400 m6,7 compared with 6900 m for assistants.7
We did not evaluate the physical performance of these referees after the match; however, from data in the literature, a significant fall in physical and mental performance after a loss of body water of 2.05% is not expected.9 Another factor that should be considered is the environmental temperature. Levels of dehydration that are well tolerated at moderate temperatures (20°C) can affect the performance of an athlete at higher temperatures (>30°C). Gonzalez-Alonso et al10 studied this using endurance trained cyclists submitted to all possible combinations of dehydration and temperature. They found that both hyperthermia (increase of 1°C in oesophageal temperature) and dehydration of 4% of body weight, separately, reduced stroke volume by 7–8% and increased heart rate by 5%, resulting in a non-significant change in cardiac output. When both factors were present in the same individual, a significant fall of 13% in cardiac output and mean arterial pressure was observed. The football matches in our study were played at an average environmental temperature of 20°C, suggesting that this factor did not contribute to a possible fall in physical and mental performance.
Plasma volume
Water distribution in and between the different compartments of an organism is governed by metabolic phenomena and forces such as hydrostatic pressure, colloidal osmotic pressure, and osmotic gradient. Rapid changes in plasma volume occur in response to changes in position, exercise, and dehydration. Changes in plasma volume can be estimated by diverse methods as shown above.14,15,16–19 We evaluated changes in plasma volume of referees and assistants using haematological variables (haemoglobin concentration and packed cell volume). The referees showed a significant reduction in plasma volume during the match: −4.99 (1.33)%, using changes in packed cell volume17 and −4.54 (1.16)%, using changes in haemoglobin concentration and packed cell volume.19 The methodology for determining plasma volume using changes in packed cell volume during dehydration is based on three assumptions: (a) a constant number of circulating erythrocytes; (b) a constant erythrocyte size; (c) the ratio between venous packed cell volume and total packed cell volume remains constant.17 It has been shown that, during physical exercise for less than two hours and with changes in plasma osmolality of less than 10%, the mean corpuscular volume remains constant.29,30 On the other hand, Costill et al31 found that 4% dehydration provoked a reduction of 5.6% in mean corpuscular volume and an underestimation of the plasma volume calculated using only change in packed cell volume (a difference of 4.9% in relation to the technique that uses haemoglobin concentration and packed cell volume changes was observed). Furthermore, changes in the ratio of total body packed cell volume to peripheral packed cell volume, or the release of pooled erythrocytes from the spleen, may introduce errors in the determination of plasma volume with the technique that uses changes in haemoglobin concentration and packed cell volume.32,33 Lundvall and Lindgren34 showed that, with reductions in plasma volume of less than 15%, the latter technique satisfactorily reflects the changes in this variable. In table 2 we can see that the physical activity performed by the referees and assistants did not result in significant alterations in the number of erythrocytes, mean corpuscular volume, or plasma osmolality. This explains why the percentages of change in plasma volume were similar using the techniques of Van Beaumont17 and Strauss et al.19 In addition, the correlation between the methods was highly significant: r = 0.9653 for referees and r = 0.9412 for assistants. During our experiments, plasma osmolality did not change significantly, suggesting that, with moderate dehydration, changes in plasma osmolality do not mirror changes in plasma volume. As fluid was lost without any change in osmolality, both water and solute (salt and/or protein) was lost.
The reduction in plasma volume of the referees showed a highly significant correlation with total loss of body water (fig 2). From these results, we can estimate that 1% dehydration in referees reflects a reduction in plasma volume of about 2.5%, which is in accordance with the study of Costill et al,31 who found a reduction of 2.4% in plasma volume for each 1% decrease in body weight (subjects exercised on an ergometric bicycle).
Fluid distribution between compartments
Exercise modifies the fine balance between the forces that determine the distribution of body water in the vascular and extravascular compartments. At the start of exercise, the capillary hydrostatic pressure and interstitial oncotic pressure increase. This causes movement of water out of the vascular system resulting in a reduction in plasma volume.35 Assuming an initial blood volume of 5 litres in the referees in this study, the initial plasma volume would be 3.11 litres and would decrease to 2.95 litres at the end of the match. As the total volume of water lost during the match was 1.60 litres, the plasma would contribute 10% of the total water lost. These data agree with those of Costill et al,31 who studied volume loss in different compartments (plasma, intracellular, and interstitial) at three levels of dehydration (2%, 4%, and 6%) caused by continuous exercise on an ergometric bicycle. With a dehydration level equivalent to 2% of body weight, the largest percentage of water lost (60%) derived from the interstitial fluid, 30% from the intracellular compartment, and 10% from the vascular compartment. On the other hand, the assistant referees showed an increase in plasma volume of 0.075 litre, indicating that the 0.79 litre lost during the match derived mainly from the interstitial and intracellular fluid.
Loss of vascular fluid through the capillary wall can be followed by monitoring the reduction in plasma protein content.26 The referees in this study showed a non-significant reduction in total plasma protein content (−5.03 (7.58)%), which is similar to that found by Green et al36 working with athletes submitted to intermittent and supramaximal exercise.
Rehydration
Several studies have been performed on footballers to determine adequate replacement of water, electrolytes, and carbohydrates, before, during, and after a match.11,23,24,29,37 However, we are not aware of any studies that have analysed the requirements of football referees and assistants. The physical activity performed by referees is a combination of various types of exercise (walking, jogging, sprinting, and reverse running) covering an average distance of 9.3 m in a match.5–7 Our results show that this amount of activity caused significant dehydration (fig 1), which was not redressed by the spontaneous intake of water during the interval. Additional studies are required to find the best form of fluid replacement for football referees (before, during, and after a match) to prevent a decrease in their physical and mental performance.
Take home message
A football referee usually suffers moderate dehydration during a normal match. This could interfere with their physical and mental performance. Furthermore, referees need to monitor their salt and water balance.
In conclusion, although limited by small numbers, our results suggest that a football referee usually suffers moderate dehydration (2% of body weight) during a normal football match. However, dehydration in assistant referees is only 1% of their body weight. Of the total water lost by the referees, the vascular compartment contributes about 10%, the remainder being derived from the extravascular compartments. The degree of dehydration shown by the referees could interfere with their physical and mental performance. Additional studies are required to clarify this point, as well as to investigate the degree of dehydration during matches played in other regions of the country with higher ambient temperatures and relative air humidity.
Acknowledgments
We are grateful to Dr Gerhard Malnic for discussion and critical reading of the manuscript, and to Carla Simone Felippe for technical assistance.
REFERENCES
Footnotes
-
Financial support: CNPq, Brasil.