Article Text

Abstract
Background: Quadriceps atrophy is a commonly cited accompaniment to patellofemoral pain syndrome (PFPS), yet there is little valid, objective evidence for its existence.
Objective: To investigate atrophy and weakness of the quadriceps femoris muscle group in patients with PFPS using measures of cross-sectional area and peak extension torque.
Methods: A total of 57 patients with insidious onset of PFPS and 10 healthy control subjects had ultrasound scanning of the quadriceps femoris. The scans were analysed using computerised planimetry to estimate the cross-sectional area of the quadriceps femoris. Lower limb peak torque was also measured using a Biodex dynamometer.
Results: The mean of % differences revealed a 3.38% (95% confidence interval (CI) 1.3 to 5.45) difference in cross-sectional area (CSA) between the affected and unaffected limb in PFPS patients and a 1.31% (95% CI 0.06 to 2.55) difference in the dominant and non-dominant limb of the control group; the between-groups difference was not significant (p = 0.409). There was a 18.4% (95% CI 13 to 23.8) difference between the affected and unaffected limb in peak torque in PFPS patients and a 7.6% (95% CI 3.2 to 12) difference between the dominant and non-dominant limb in the control group; the between-groups difference was significant (p = 0.002).
Conclusions: The mean of % differences of 3.38% quadriceps atrophy between limbs was considerably less than the only other study using ultrasound scanning on the quadriceps in PFPS and was not significant between the groups. There were greater and more significant between-group differences in lower limb peak torque indicating that muscle strength may not be related to muscle size. These results help to re-appraise of the amount of quadriceps atrophy in PFPS.
- anterior knee pain
- isokinetic torque
- patellofemoral pain
- quadriceps atrophy
- ultrasound scanning
- CSA, cross-sectional area
- CT, computerised axial tomography
- MR, magnetic resonance
- PFPS, patellofemoral pain syndrome
- US, ultrasound
Statistics from Altmetric.com
- CSA, cross-sectional area
- CT, computerised axial tomography
- MR, magnetic resonance
- PFPS, patellofemoral pain syndrome
- US, ultrasound
Quadriceps muscle wasting is a common clinical observation in patients with lower limb disease, injury, or as a result of immobilisation.1 One theory is that pain causes reflex inhibition of the quadriceps, which in time induces an atrophic response within the muscle with subsequent loss of muscle size.2 Whether the loss of size is due to a decrease of muscle fibre area (atrophy) or a loss of fibre numbers (hypoplasia) is still subject to debate.1,3,4
Estimations of quadriceps atrophy in the clinical setting have usually involved girth measurements with a tape, but this method also involves posterior, lateral, and medial thigh muscles as well as bone and subcutaneous fat. The test–retest reliability of this method has been found to be poor with numerous factors accounting for inter- and intra-operator variability.5
In patellofemoral pain syndrome (PFPS) evaluation of the quadriceps musculature is recommended in authoritative texts.6,7 In addition, several reviews and descriptive articles on PFPS readily describe asymmetric muscle mass of the quadriceps group in general8,9 or the vastus medialis oblique muscle (VMO) in particular.10,11 Surprisingly, in contrast to the amount of evidence available using reliable and valid measures on decreased quadriceps strength in PFPS,12–15 to date there has been only one study using reliable and valid measures to evaluate quadriceps atrophy in PFPS.2 In that study, Doxey2 compared anterior mid-thigh girth measurements of subjects with PFPS using a static B-mode ultrasound (US) scanner. By measuring the distance directly perpendicular to the horizontal surface of the thigh between the femur and the muscle/fat interface with on-screen callipers, he measured the thickness of the quadriceps muscles of 44 patients with unilateral PFPS, and compared them to the asymptomatic leg. He demonstrated significant differences in quadriceps thickness between the symptomatic and asymptomatic knees of 12.4% for 26 males (p = 0.0001) and 13.9% for 18 females (p = 0.007).
There are several factors to consider in this study. Although Doxey used static B-mode US scanning, quadriceps thickness was measured rather than a proper measurement of CSA. Another issue was that Doxey had a mixed patient group of traumatic or insidious onset, with 50% of his male patients and 39% of his female patients reporting a traumatic cause for their pain. Furthermore, there was no measure of quadriceps or extensor strength for his patients. This patient mix and the different treatment protocols for insidious and traumatic onset may have implications when comparing data on quadriceps atrophy.
Sophisticated techniques are available in the research setting to measure muscle cross-sectional area (CSA) such as US scanning, which was first described on human skeletal muscle of the upper arm by Ikai and Fukunaga16 and on the quadriceps specifically by Dons et al.17 Despite the technique being developed and superseded by computerised axial tomography (CT) and, more recently, magnetic resonance (MR) imaging, US scanning is non-invasive, inexpensive, and can be used by therapists independently which makes it still an attractive measurement tool. Its criterion validity has been investigated18 and it was demonstrated that the mean differences between US scanning and the ‘gold standard’ of MR imaging in estimating quadriceps CSA was only 0.8%, with the conclusion that these limits were small enough for either US or MR to be used in clinical practice. B-mode US scanning to measure CSA has been reported to be reliable on a variety of subjects and patient groups.19–21
Establishing the true amount of quadriceps atrophy in PFPS has both clinical and research implications for rehabilitation and may cast light on the true change in quadriceps CSA in this common condition. Rehabilitation protocols traditionally involve methods to “improve wasted and weak quadriceps”, but if there is minimal wasting yet substantial weakness anyway, then rehabilitation needs to be directed towards a strength focussed goal. The present study was a re-investigation of the amount of quadriceps atrophy present in a group of patients with chronic insidious onset PFPS as measured by quadriceps CSA.
METHODS
Subjects
A total of 89 patients were referred from orthopaedic and rheumatology clinics with a diagnosis of non-traumatic patellofemoral pain. Patients were examined by an experienced clinician who had expertise in the assessment of PFPS (MJC) to assess their eligibility and to determine the presence of other lower extremity dysfunction that might account for the knee symptoms. These included referred pain from the lumbar spine and hip joint, severe leg length discrepancy, knee ligament, quadriceps tendon and meniscal pathologies, Hoffa’s syndrome, medial plica syndrome, femoral anteversion, and tibial torsion. Examination was also performed to detect loss of flexibility of the soft tissue structures such as the quadriceps, hamstrings, triceps surae, and iliotibial band which have been associated with PFPS.11 The presence of these dysfunctions, the finding of asymmetry, an abnormality on clinical examination, or bilateral symptoms resulted in 32 patients being excluded from the study leaving a total of 57 PFPS patients.
These 57 patients had PFPS that could be provoked by at least two of the following: kneeling, prolonged sitting, deep squatting, ascending or descending stairs, or patellar compression6 (table 1). A control group was also employed from a convenience sample from hospital staff of 10 healthy subjects who had no previous or current knee pain and no previous surgery or significant trauma to the knee (table 1).
Descriptive statistics of patients and control subjects
To investigate possible differences between groups of patients with PFPS of traumatic and insidious onset, we also included the small group of patients (n = 5) whose PFPS was due to a specific, recognised injury and had, therefore, been excluded initially from the PFPS group (mean age was 33.6±6.8 years, mean BMI 30.2±6.7). In all cases the trauma resulted from a direct blow to the anterior aspect of the patella and radiographs taken after the injury had excluded a patellar fracture.
All patients and subjects had the protocol and procedures explained to them, were given an information sheet, and were asked to sign a consent form if they wished to enter the study. The study was approved by the ethics committee of the Central Manchester NHS Healthcare Trust.
Instrumentation
Quadriceps cross-sectional area of both legs was assessed using a static B compound US scanner (Technicare EDP 1200). The size of the transducer was chosen to give the clearest image on the screen. Scans were taken at the thigh mid-point between the lateral joint line of the knee and the greater trochanter (fig 1). This was marked on an acetate in order to ensure exact reproduction of the position for the post-treatment scan. A hard copy of each scan was obtained and the area of the quadriceps calculated using Digiteye software (Medical Physics Department, Hope Hospital, Salford, UK) (fig 2). CSA reliability using this system has already been assessed and found to be high with an intra-test mean coefficient of variation of 1.7%20 and a between scans ICC(1,2) of 0.99, and SEM 0.29 cm2 (a smallest detectable difference between days for the same subject of 3.4%).21

The static B-mode US scanner. The skin line shows the approximate area scanned.
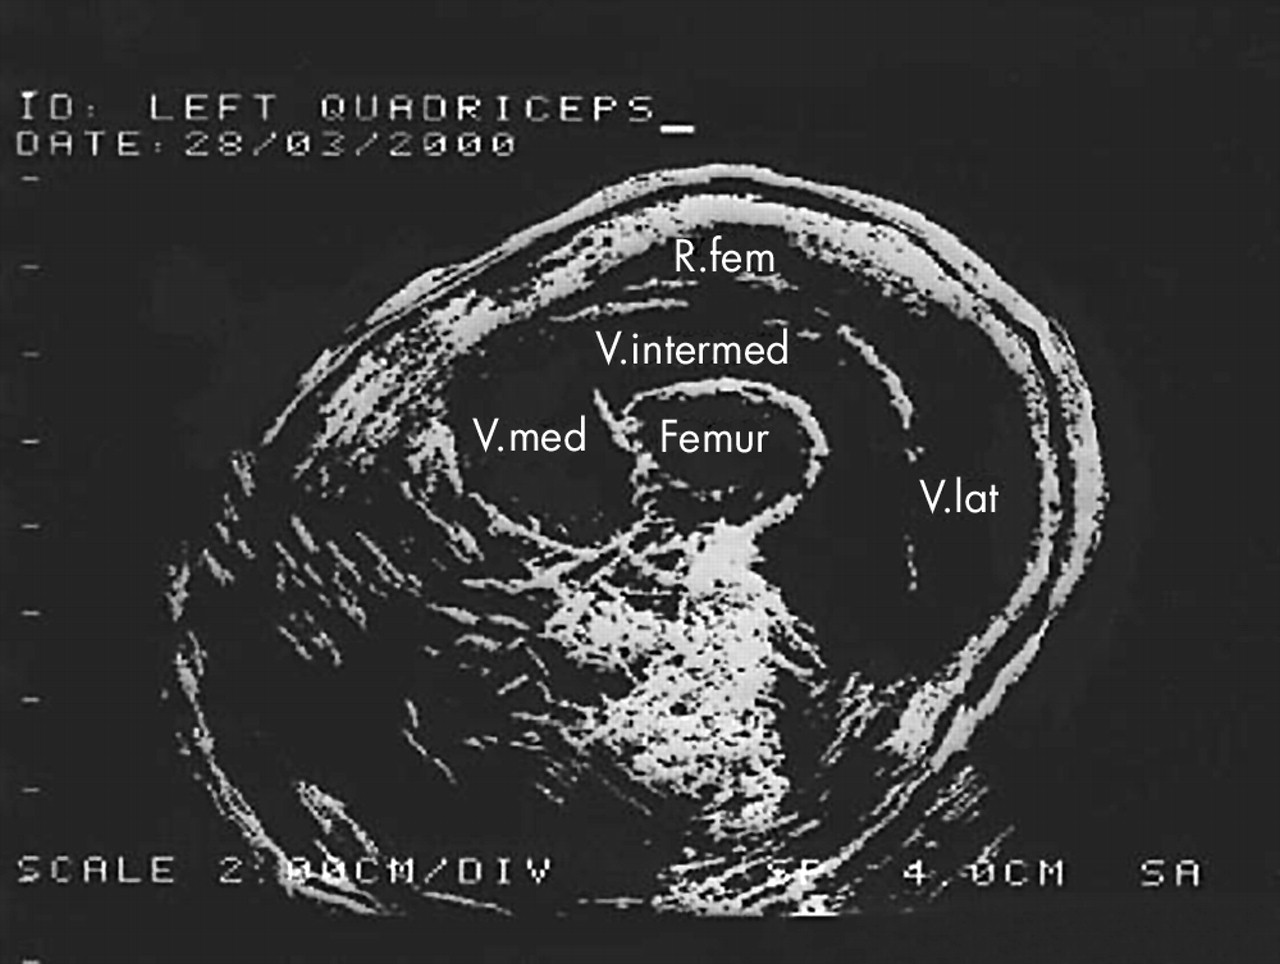
Example of a US scan output of the quadriceps femoris taken at the level of mid-thigh.
Extension torque of both lower limbs was measured using the Biodex system 2 isokinetic dynamometer (Biodex Systems, Shirley, NY, USA) with a closed kinetic chain attachment as supplied by the manufacturers. This attachment has been assessed for test–retest reliability with ICC(2,1) estimates of 0.76 for isokinetic mode.14 The closed kinetic chain attachment had been advocated for patients with PFPS due to a lessening of the patellofemoral joint reaction force and patellofemoral stress.22 The standard isokinetic lever arm was thought to exacerbate the patients’ patellofemoral symptoms. Subjects were placed in the chair with hip flexion set at 90° and the shoulder and waist straps applied. The foot was placed flat against the foot plate attachment and was held in place by velcro straps. With the knee at full extension the knee joint axis was aligned with the axis of the power head. Limits were then set at 0° and 90° flexion. The angular velocity was set at 90°/s. Subjects had a full practice session prior to data collection proper. Each session consisted of six sub-maximal repetitions as a warm up on each leg with verbal instruction strictly standardised. The peak extension torque was recorded.
Statistical analysis
Data were analysed using SPSS (Statistical Package for Social Sciences) for Windows (v10). A Kolmogarov–Smirnov test was performed on the data, which were found to be normally distributed (p>0.05). This permitted parametric analysis. The extension torque and quadriceps CSA of the uninjured and injured leg for the PFPS group and the dominant and non-dominant leg for the control group were calculated as a mean of percentage differences. For within-groups differences, data were analysed with paired t tests. For between-group differences, an independent t test was performed. For all analyses the probability level for statistical significance was p<0.05.
Power size calculation
Based on the means and standard deviations on data for PFPS provided by Doxey,2 a power size calculation was performed. This revealed that at a power of 80% and a significance level of 5% the number needed to show a significant difference between means was 41 for females and 21 for males.
RESULTS
Descriptive statistics for both groups are given in table 1. Data for peak torque and CSA for both groups and male and female subjects are given in table 2.
Raw data and percentage differences for males and females in both groups
Within-subjects analysis
Paired t tests were used to ascertain differences between the affected and unaffected knee of PFPS or dominant and non-dominant leg of healthy subjects in CSA and concentric extension peak torque. These results can be seen in table 2. When peak torque was expressed as I/UI% for PFPS patients, the percentage value was 82%, which is comparable to the torque I/UI% value of 84.8% at an angular velocity of 30°/s reported by Holder-Powell and Rutherford23 in 22 patients with knee ligament and cartilage injuries.
The data from the trauma group revealed much larger differences of 7.66% for between limb CSA and 36.6% for between limb peak torque but were not included in the formal statistical analysis due to the small sample size.
Between-subjects analysis
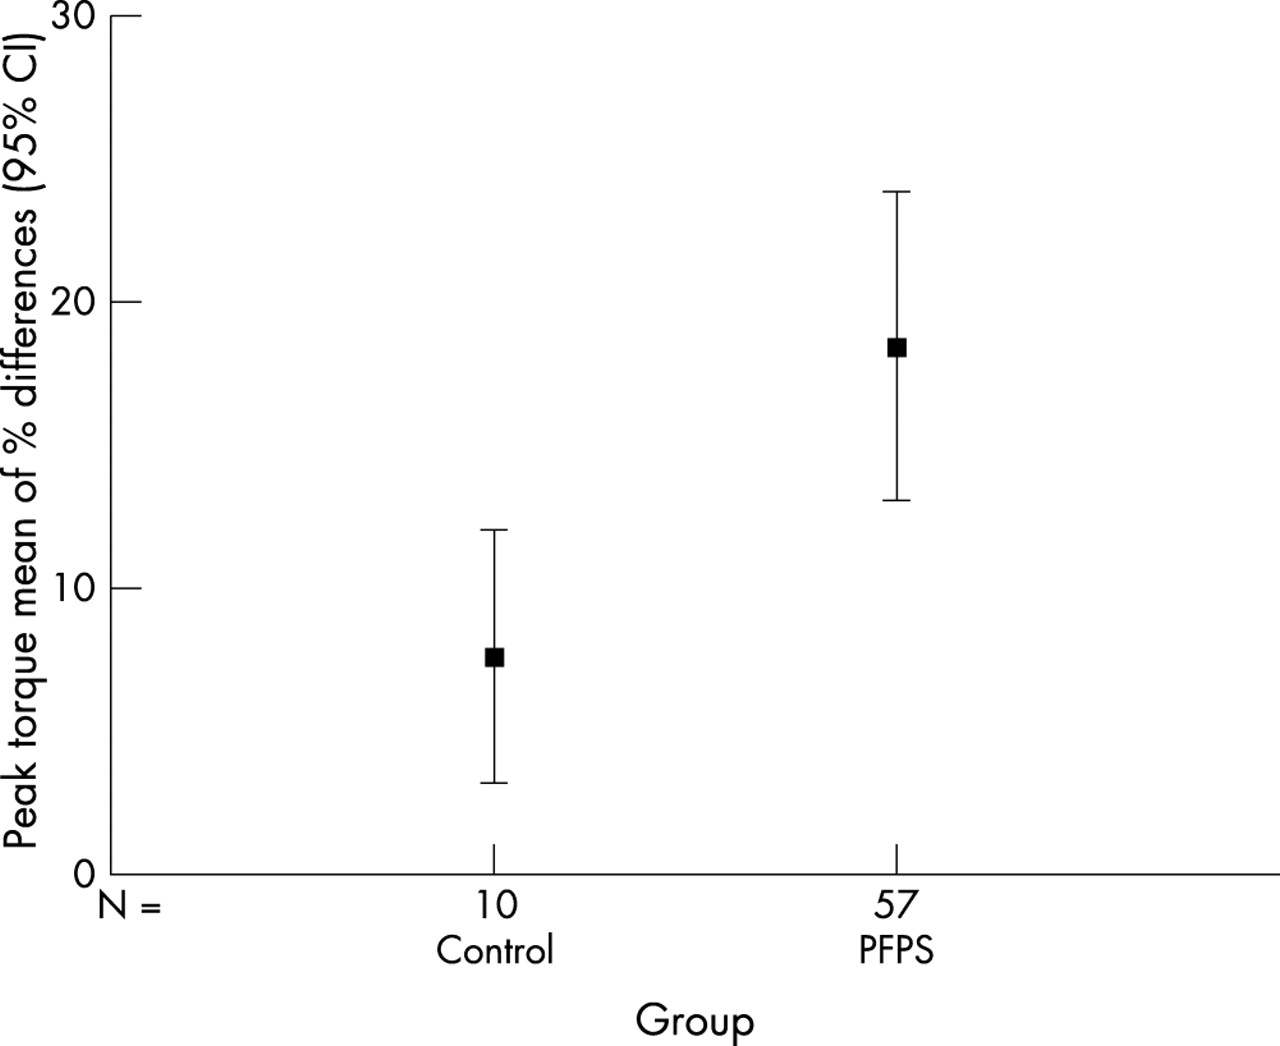
Independent t tests were used to ascertain significant differences between the PFPS and healthy groups. These results can be seen in table 3. These percentage differences (means and 95% confidence intervals) are illustrated in figures 3 and 4.
Independent t tests for CSA between control and patient groups

CSA mean of % differences (95% CI) for control and PFPS groups. Zero indicates no % difference in CSA between limbs.

Peak torque mean of % differences (95% CI) for control and PFPS groups. Zero indicates no % difference in peak torque between limbs.
Correlational analysis
A Pearson’s correlation co-efficient was calculated to assess the association between the CSA and peak torque of the PFPS group: r = 0.204, p = 0.988.
DISCUSSION
CSA
Despite virtually no objective supporting evidence, atrophy of the quadriceps is cited as a universal accompaniment to PFPS.9 The only other previous study to use a reliable and valid evaluation of quadriceps size in PFPS2 concluded that there was quadriceps atrophy of greater than 10% for both males and females. Our study has shown far less percentage differences and thus lends some weight to our own clinical observations of minimal quadriceps wasting in this group of patients. We suggest that the reason for the different results is that Doxey2 did not actually measure CSA but the quadriceps thickness perpendicularly from the femur to the skin above the rectus femoris using the on-screen callipers. Although other studies have used magnetic resonance imaging to evaluate the quadriceps, this is the first to measure quadriceps CSA in patients with PFPS. Despite Freilich et al24 declaring that CSA and muscle thickness were closely correlated, it would seem important to look at the whole quadriceps femoris, given that several authors have stated that assessment of the whole quadriceps is an integral and fundamental part of examination for PFPS.6,7 The descriptive statistics show that there was virtually no percentage difference in mean CSA between the dominant and non-dominant limb in the control group (1.31%) and the mean CSA between the affected and unaffected limb of PFPS patients (3.38%). When the PFPS group was analysed by gender, females (n = 35) had a mean difference of 4.57% and males (n = 22) of 2.38%. This is considerably less than the 12.4% for males (n = 26) and 13.9% for females (n = 18) reported by Doxey,2 although it too reflects slightly greater quadriceps atrophy for female patients with PFPS.
The lack of significant quadriceps CSA differences in our study may be explained by the insidious onset in all our PFPS patients who, despite their complaint, were fully weight bearing, without enduring any period of immobilisation. Although formal statistical analysis was inappropriate due to the different sample sizes between the groups, large differences in CSA and torque between the insidious and trauma groups were apparent from the descriptive statistics (table 1). The larger differences in CSA between limbs exhibited by the small trauma group (7.66%) may have been due to a short period of immobilisation, non- or partial weight bearing with crutches, or the application of bandaging or a brace (or a combination of all three) that were reported by all the trauma patients as part of their immediate post injury care. This may have been sufficient to induce atrophy and may help explain Doxey’s results,2 whose patient sample was a mixture of insidious and traumatic onset, which showed greater differences in atrophy between the legs. When we added our five trauma patients to the insidious group data for analysis, there was an insignificant change in the statistical outcome, probably due to the fact that they constituted only 8% of our total patient sample as opposed to just over 50% in Doxey’s study.
Although the number of male patients (n = 22) met the sample size target, the number of females recruited (n = 35) was slightly below the sample size calculated prospectively. A retrospective power sample calculation based on the present CSA results revealed that for the male subjects for a two-tailed test (p<0.05) the power of the study was 0.86 with a sample size of 20 needed to achieve a power of 0.80. For female subjects the power was only 0.15 with a sample size of 385 needed to achieve a power of 0.80 for a two-tailed test (p<0.05). Despite a valid prospective sample size calculation with data taken from Doxey’s data,2 retrospectively this study appears to be considerably underpowered for female subjects, yet very well powered for males. Obviously this could be explained by the differences in techniques for measuring “thickness” as opposed to CSA, and it may be that our study presents a more valid set of data for future studies wishing to perform this measure on groups of male and female athletes.
The reason for the larger sample requirement for the female group is probably due to smaller differences between the injured limb in the PFPS group and the non-dominant limb in the control group coupled with larger standard deviations than the male patient group (table 2).
Peak torque
As mentioned in the methodology, the standard method of open chain testing may be undesirable or contraindicated in several knee pathologies including PFPS.25 This study used the closed chain attachment that allowed other muscle groups to contribute to the extension torque. Despite the fact that the values would, therefore, have been of lower limb torque rather than quadriceps torque specifically, limiting the amount of pain from the testing procedure was a justifiable reason for using the closed chain method to stop pain from being a contributing factor. Although pain levels were not formally measured, we observed that at no time during or after the test procedures did patients complain of knee pain. The mean of % differences between the affected and unaffected knee in the PFPS group was significantly greater (18.4%) than the difference between the left and right leg of the control group (7.6%; p = 0.002). The lack of statistically significant quadriceps CSA differences between PFPS and healthy subjects does not imply normally functioning muscles for the patients group. Doxey’s study2 did not evaluate quadriceps strength so our study is, to our knowledge, the first to have reliable data of both quadriceps CSA and peak torque. These set of data enabled us to examine the association between CSA and peak torque. The poor correlation between CSA and peak torque percentage changes may be because, for reasons already stated, we measured lower limb extensor torque, not specifically quadriceps torque. However, the lack of correlation between peak torque and CSA may also indicate that PFPS patients have weaker extensor muscle groups that cannot be explained by muscle atrophy. Thus, there may be more subtle mechanisms other than muscle size limiting quadriceps function. For example, recent electromyographic studies on anterior knee pain have described a modified neuro-muscular control strategy of the quadriceps in patients with anterior knee pain26; this is not necessarily related to pain inhibition.15 Further study combining electromyography, dynamometry, and imaging techniques would be useful to clarify these important and complex issues.
Take home message
PFPS patients seem to have less quadriceps atrophy on the affected leg than previously described. Nevertheless, they exhibit significant muscle weakness in the affected leg and this should be a principle goal of rehabilitation.
CONCLUSION
This study has shown that patients with PFPS had a mean of percentage differences of 3.38% difference in quadriceps CSA between the injured and uninjured limb. This was not significantly different from control group values between dominant and non-dominant limb. This difference is smaller than the only other reported study on PFPS that measured quadriceps thickness. There was, however, a significant difference between the PFPS and control groups in lower limb extension isokinetic peak torque percentage differences indicating the existence of muscular dysfunction in the affected leg not related to muscle size. These results help to re-appraise the amount of quadriceps atrophy in PFPS.
Acknowledgments
We are most grateful to the following: the Department of Physiotherapy and of Orthopaedics at Manchester Royal Infirmary, Dr David McHugh for scanner maintenance, Mrs Claire Visanji for patient recruitment, and Dr Julie Winstanley for statistical advice.
REFERENCES
Footnotes
-
Funding was provided by Smith & Nephew Healthcare
-
Conflict of interest: none declared.