Article Text

Abstract
Background: Subjects exercising without fluid ingestion in desert heat terminated exercise when the total loss in body weight exceeded 7%. It is not known if athletes competing in cooler conditions with free access to fluid terminate exercise at similar levels of weight loss.
Objectives: To determine any associations between percentage weight losses during a 224 km Ironman triathlon, serum sodium concentrations and rectal temperatures after the race, and prevalence of medical diagnoses.
Methods: Athletes competing in the 2000 and 2001 South African Ironman triathlon were weighed on the day of registration and again immediately before and immediately after the race. Blood pressure and serum sodium concentrations were measured at registration and immediately after the race. Rectal temperatures were also measured after the race, at which time all athletes were medically examined. Athletes were assigned to one of three groups according to percentage weight loss during the race.
Results: Body weight was significantly (p<0.0001) reduced after the race in all three groups. Serum sodium concentrations were significantly (p<0.001) higher in athletes with the greatest percentage weight loss. Rectal temperatures were the same in all groups, with only a weak inverse association between temperature and percentage weight loss. There were no significant differences in diagnostic indices of high weight loss or incidence of medical diagnoses between groups.
Conclusions: Large changes in body weight during a triathlon were not associated with a greater prevalence of medical complications or higher rectal temperatures but were associated with higher serum sodium concentrations.
- body weight
- rectal temperature
- sodium
- performance
- triathlon
Statistics from Altmetric.com
Athletes have long been advised that dehydration during exercise is detrimental to both health and performance1 such that: “The greatest threat to health and well-being during prolonged exercise, especially when performed in the heat, is dehydration”2 and “if strenuous exercise is undertaken by hypohydrated subjects, the medical consequences can be devastating”.3
The classic studies undertaken by Adolph and colleagues4 in the Nevada desert between 1942 and 1945 established that subjects who walked in desert heat at night chose not to continue after they had lost about 7% of their body weight. Such “dehydration exhaustion” was not associated with hyperthermia in excess of 39.6°C but was caused by postural hypotension.4 These studies also showed that there were no obvious after effects of dehydration, “We do know that man can suffer a water deficit so incapacitating that he can neither walk nor stand; yet he recovers his walking ability within a few minutes of water ingestion, and his feeling of well-being within half an hour or less after he begins drinking. With a meal or two intervening, his recovery is practically complete in 6 to 12 hours”.5 The authors concluded that: “In general, people who experience the signs listed as occurring at water deficits of less than 10% of body weight are in no danger of death. Most signs disappear within an hour after water is freely drunk”.4
As a result, it has been suggested that exercise could only be sustained at body weight losses of less than 7%. Although signs and symptoms became progressively more severe after weight losses of 4–6%, medical complications were considered to begin only at body weight losses of 10–20%.4
Hydration guidelines based on these studies proposed that athletes should drink sufficiently during exercise to prevent dehydration from exceeding 2% body weight.1,6 However, these conclusions are based on laboratory studies of physiological changes during exercise, often performed in conditions that are less severe than the original desert studies, and in which, as in the case of the desert studies, no substantive health complications as a consequence of dehydration have been documented.
Thus neither the classical desert studies nor the more recent laboratory studies properly address the question of whether or not specific levels of dehydration are harmful to performance or carry specific risks of medical consequences in competitive events in which athletes exercise out of doors in environmental conditions that are substantially less severe than those experienced in the original desert studies.7 Nor do modern athletes exercise without any fluid replacement, as was the requirement in the original desert studies. Indeed, it remains unclear at what levels of weight loss severe medical consequences develop during ultraendurance, competitive exercise.7
As it is always possible that the observed phenomena associated with dehydration may be temporally, but not causally, linked, there is a need for cross sectional studies to determine the practical relevance of data collected in the more precise, yet less athletically demanding laboratory studies. For example, it is not possible to recreate in the laboratory, the performances achieved in real outdoor Ironman triathlons lasting 8–17 hours, as extraneous variables contributing to final outcome measures in the field are standardised and well controlled. In addition, longitudinal interventional studies, in which subjects are randomly assigning to different rates of fluid ingestion during competition to ensure that they develop varying levels of dehydration during a 17 hour competition, are neither possible nor at present ethical because it is currently believed that a restricted fluid intake during exercise jeopardises both the health and the performance of endurance athletes.1
In a recent study of the first Ironman triathlon on the African continent,8 some of the most successful athletes completed the race with percentage body weight losses greater than those considered to be incapacitating by Adolph et al.4 Indeed the athlete with the greatest individual weight loss (8.2%) in that race had one of the fastest 42 km marathon times (213 minutes). In addition, there was no evidence that athletes who experienced greater percentage weight losses were at increased risk of requiring medical assistance at the end of the race. Indeed, the proportion of athletes requiring medical care at the race finish (5%) was the lowest yet recorded in any equivalent Ironman race. It is more usual for 20–30% of finishers to require medical care after a 224 km Ironman triathlon.9–11 These results therefore question the historical findings from the desert studies as well as the more modern belief that any level of dehydration in excess of 2% is detrimental to athletic performance.1,6,7
To supplement these findings, we repeated the same study but on a larger number of athletes in the 224 km 2001 South African Ironman triathlon. In addition, all entrants in the race were required to have a medical evaluation before they were discharged from the race finish, regardless of whether or not they completed the race. Our hypothesis was that there is no increased risk of medical complication associated with high levels of weight loss during an ultraendurance competitive event performed out of doors in a moderate environment. Thus the specific aim of the study was to answer the questions: is a weight loss of 7% or more incapacitating, and are such high levels of weight loss associated with a higher prevalence of diagnosable medical conditions?
METHODS
All entrants in the first two official South African Ironman triathlons, held during 2000 and 2001 at Gordon’s Bay (situated 55 km from Cape Town, South Africa), were invited to participate in the study. Each athlete was contacted before the race and was sent a complete explanation of the study and an informed consent form. Written informed consent was received from each athlete during the race registration, which was held for the three days before the race. Approval for this study was obtained from the Research Ethics Committee of the Faculty of Health Sciences, University of Cape Town. The South African Weather Service provided details of the environmental conditions on the two race days. During the three days preceding the race day, an interview was scheduled with each race entrant to ensure that each was fully informed of, and understood, the aims and methods of the study.
The methodology used has been described in detail elsewhere8 and will therefore be discussed only briefly here.
Measurement of body weight, blood pressure, and rectal temperature
The methods for measuring body weight and rectal temperature have been described previously.8 Briefly, at registration, subjects were weighed, and resting blood pressure was measured with the subject supine. On the morning of the race, subjects were weighed again on the same scales, without shoes and only wearing a swimming costume (without wetsuit).
All athletes who finished the race were directed to the medical tent situated 20 m from the finish line; it was the only exit from the finishing area. On entering the medical tent, subjects were weighed without shoes. They were also further tested and medically evaluated before being discharged as soon as their physical condition allowed.
Blood pressure and rectal temperatures were measured with subjects supine, about five minutes after they entered the tent. A 4.5 ml blood sample was then drawn from a forearm vein for the measurement of serum sodium concentration. Biochemical analysis of the latter was as described previously.8
Medical evaluation
A relevant medical history was taken from all finishers by trained sports clinicians who also assessed fluid status. This assessment included the evaluation of skin turgidity, fullness of the eye sockets, sweat and saliva production, and oedema of the lungs (by auscultation) and of the tibia and hands (by inspection and palpation).
On the basis of the clinical and laboratory findings, the athlete was either classified as healthy and referred for further investigation if participating in another trial, or an appropriate clinical diagnosis was made and the appropriate treatment initiated.
Calculation of results
Body mass was corrected for the standard clothing worn by each athlete by subtracting the mass of the clothes (measured before registration) from the measured mass of the athlete. Mean changes in body mass (kg) were calculated as the difference between the body masses measured on the two different occasions. Percentage body mass lost or gained was calculated as the difference between the initial and final masses divided by the initial mass and expressed as a percentage. Body mass before the race was used to calculate the total change in body weight during the race. Although it is often assumed that percentage weight loss and percentage dehydration are synonymous, this is incorrect because the weight lost during exercise includes a significant mass from fuel and water released from glycogen.9 Accordingly, the term percentage weight loss is preferred to percentage dehydration in this study. However, as a group, athletes with the greatest percentage weight loss will also be the most dehydrated.
Grouping of triathletes according to the severity of weight loss during the Ironman triathlon
Triathletes were grouped according to the combined percentage weight losses in the two races: group 1, weight loss exceeding 5%; group 2, weight loss of 3.5–4.5%; group 3, weight loss of 3% to a weight gain of 3%. A triathlete in group 1 was matched with a triathlete in group 2 and a triathlete in group 3 for starting body weight and performance in the relevant Ironman race. Matching was considered acceptable if the difference in starting body weight was less than 5 kg and the difference in performance time in the Ironman was less than 30 minutes.
Statistical analysis
Data were analysed using a computer based statistical programme. Analysis of variance was used to determine differences between the three groups. Student’s t test for dependent variables was used to analyse differences within groups before and after the race. A Pearson’s χ2 test was used to determine differences in medical diagnoses between groups. Statistical significance was accepted at p<0.05.
RESULTS
The average dry bulb temperature during the 2000 event was 20.5°C (17.0–23.9°C). At midday, the temperature was 21.7°C with a relative humidity of 55%. This humidity averaged 68% for the day (46–87%). Sea temperature was 16°C. Average wind speed was 4.6 m/s (0 m/s at 0700 hours to 7.1 m/s at 2300 hours).
Dry bulb air temperature during the 2001 race was 15.6–20.9°C, with a midday value of 20°C and an average value of 17.2°C. Average humidity was 63% with a maximum value of 79% and a minimum value of 48%. Sea temperature was 15°C. Average wind speed was 6.4 m/s with a maximum gust of 22.3 m/s (81 km/h) at 2051 hours.
A total of 767 triathletes (271 in 2000 and 496 in 2001) were weighed during registration before the two Ironman races. At the start of the race, 871 race entrants were weighed (307 in 2000 and 564 in 2001), and, at the race finish, 872 athletes were weighed (293 in 2000 and 579 in 2001).
Table 1 presents the changes in body weight and serum sodium concentrations before and after the triathlon for the three groups. As dictated by the study design, athletes in group 1 experienced a significantly greater percentage body weight change than did athletes in groups 2 (p<0.001) and 3 (p<0.001). Similarly, absolute weight changes (kg) were significantly different between groups (p<0.001). All groups showed a significant body weight loss during the race (p<0.0001). Athletes in groups 1 and 2 also showed a significant increase (p<0.0001) in body weight in the period between registration and the race start.
Body weight and serum sodium concentrations before and after the race in three groups of Ironman triathletes differing in their extent of weight loss during the race
Athletes who experienced the greatest percentage changes in body weight (group 1) had significantly (p<0.05) higher serum sodium concentrations measured at registration than athletes who completed the race with the least weight loss (group 3) (table 1). There were no significant differences in serum sodium concentrations before the race between groups 1 and 2 or between groups 2 and 3. Serum sodium concentrations increased significantly (p<0.01) during the race in athletes in group 1. Serum sodium concentrations before the race were significantly higher in groups 1 (p<0.001) and 2 (p<0.05) than in group 3. Values were not different between groups 1 and 2. There were no differences between groups for the change in serum sodium concentrations during the race.
Table 2 lists blood pressure, rectal temperature, and medical diagnoses in the three groups of triathletes. Systolic and diastolic blood pressures were the same in all groups before the race. Systolic blood pressure decreased significantly during the race in all three groups (p<0.0001). Diastolic blood pressure fell significantly only in athletes in group 2 (p<0.05). There were no significant intergroup differences in systolic and diastolic blood pressure after the race.
Systolic (SBP) and diastolic (DBP) blood pressure, rectal temperature, and medical diagnoses in three groups of Ironman triathletes differing in their extent of weight loss during the race
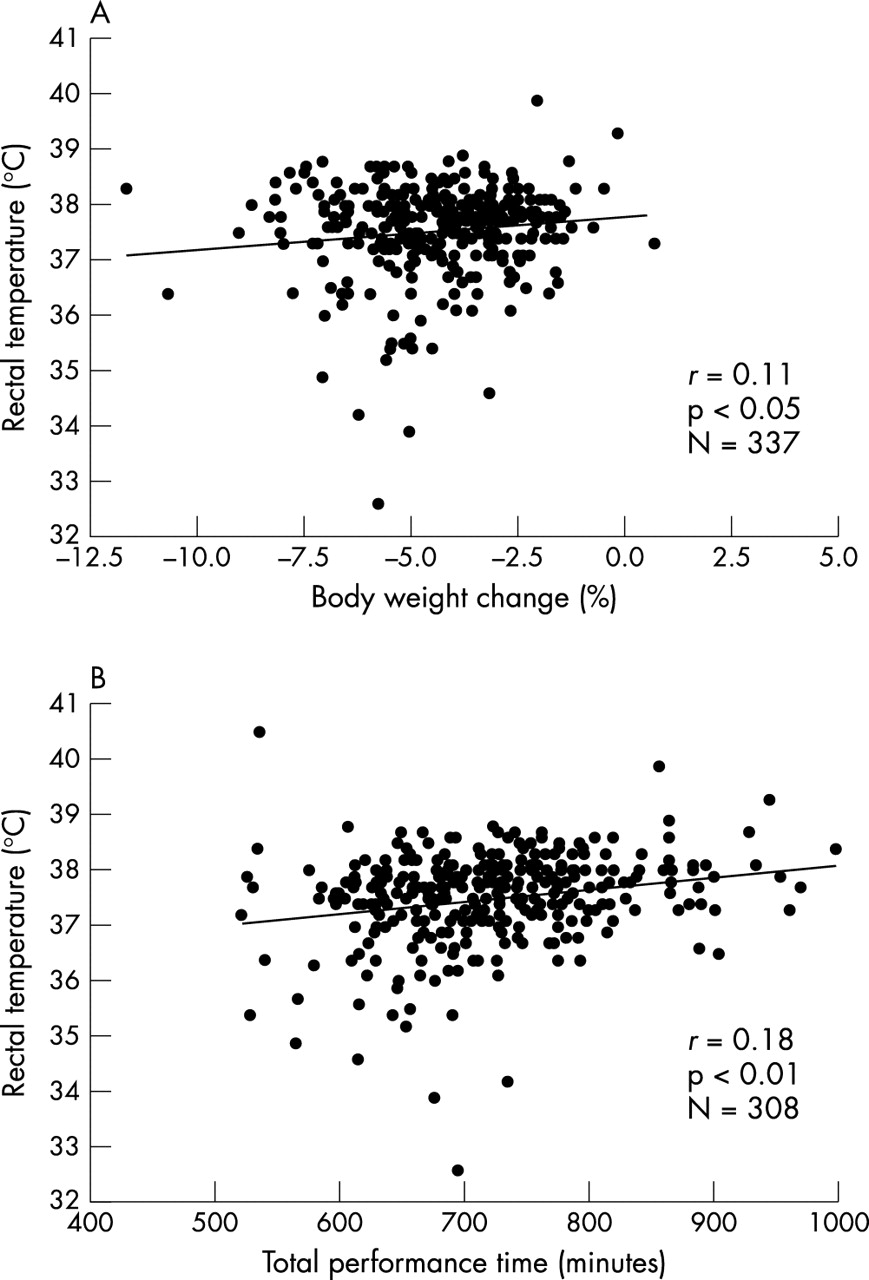
Despite significant intergroup differences in weight loss during the race, rectal temperature after the race was the same in all groups (table 2). Indeed when data from the whole group were analysed, there was a weak negative association between the degree of weight loss during the race and the rectal temperature after the race (fig 1A). There was also a weak inverse relation between rectal temperature after the race and overall performance time (fig 1B). However, serum sodium concentrations after the race were inversely related to the degree of weight loss during the race (r = 0.46, p<0.0001, n = 636), so that athletes who lost the least weight had the lowest serum sodium concentrations after the race (data not shown).

Relation between rectal temperature and (A) percentage change in body weight and (B) total overall performance time (minutes) for the total combined group of Ironman triathletes.
There were five confirmed medical diagnoses in group 1, three in group 2, and four in group 3. The diagnoses in group 1 were hypothermia (rectal temperature of 34.2°C), two cases of exercise associated collapse (defined as collapse from postural hypotension after completion of the race), and two cases of nausea and non-specific gastrointestinal complaints. Two athletes in group 2 developed exercise associated cramping, and a third athlete in that group developed exercise associated collapse. Medical diagnoses in group 3 consisted of two cases of non-specific gastrointestinal complaints and one of exercise associated collapse. One athlete in this group was diagnosed with symptomatic hyponatraemia (weight gain of 3 kg, serum sodium concentration of 125.8 mmol/l after the race). This athlete required extensive medical care, being admitted to hospital for the following 24 hours.12
Table 3 lists the prevalence of traditional diagnostic features of clinical dehydration in athletes in the three groups. There were no differences in any of these signs (sweating, ability to produce saliva, sunken eyes, hand, pre-tibial or pulmonary oedema, or ring tightness) between the three groups.
Percentages of athletes exhibiting signs usually considered to indicate clinical dehydration in three groups of Ironman triathletes differing in their extent of weight loss during the race
Athletes who were unable to complete the race were also examined in the medical tent at the race finish. Eight athletes were unable to complete the 2000 race, and ten were unable to complete the 2001 race. Medical diagnoses of these athletes included hypothermia (two), muscle cramping (three), nausea and gastrointestinal distress (four), abrasions (two), and non-specific symptoms associated with fatigue (seven) (data not shown).
Table 4 gives performance times. Again, in accordance with the study design, there were no differences in total performance time between groups. There were also no significant differences in swimming, cycling, or running times between groups. However, unmatched data from the entire group for whom data are available shows a weak inverse relation between percentage loss in body weight during the race and race time, so that those athletes who lost the most weight completed the race in the shortest times (fig 2).
Performance times of three groups of Ironman triathletes matched for starting body weight and total Ironman performance time but differing in their extent of weight loss during the race

Relation between the total performance time (minutes) and percentage change in body weight.
DISCUSSION
These data supplement our previous study8 and confirm that percentage changes in body weight are linearly related to serum sodium concentrations after a triathlon but are unrelated to rectal temperatures and endurance performance.
The most noteworthy finding from this study is that the only athlete requiring admission to hospital and extensive medical treatment finished the race 3 kg heavier than at the start with a serum sodium concentration of 125.8 mmol/l, indicating major over-hydration. Hyponatraemia was thus diagnosed. The athlete’s clinical data have been discussed in detail elsewhere.12
In addition, the subjects with the greatest weight changes (group 1) lost about 6% of their body weight during the race (range 5.0–10.7%). These changes in body weight are among the highest yet reported, exceeding peak values measured in laboratory trials by 2%13,14 to 5%.15 Indeed percentage changes in body weight in this group were greater than those measured in the two classical early studies of competitive distance runners that led to concerns that athletes do not drink sufficiently during exercise.16 A similar range of weight changes (−12 to +6%) has been reported by Speedy et al11 in the 1997 New Zealand Ironman triathlon, also held in relatively mild environmental conditions (average ambient temperature 21°C and relative humidity 91%).
In this study, there were no differences in rectal temperature, supine diastolic or systolic blood pressure, or the number of medical diagnoses after the race in the three groups differing in the extent of weight loss during the race (table 2). Serum sodium concentrations were significantly higher in athletes with the greatest weight change (table 1), and, as previously shown,11 were inversely related to the percentage change in body weight during the race (data not shown). In contrast, there was a weak inverse relation between rectal temperature and percentage change in body weight (fig 1A). Thus, once again,17,18 we are unable to confirm the widespread belief that greater weight loss during exercise is associated with higher body temperatures in outdoor competition, as originally postulated by Wyndham and Strydom,16 nor the belief that change in body weight is associated with the risk of specific medical conditions.1,2,6,19
We also make the, perhaps obvious, point that we measured rectal temperatures in 390 athletes and levels of dehydration in 839 athletes, whereas in most previous studies from which opposing conclusions have been drawn fewer than 20 subjects were used for either variable. Furthermore, none of those studies have measured adverse health consequences of increasing weight loss during exercise, only apparently adverse physiological consequences.2
Accordingly, one of the aims of this study was to determine the probability that experienced sports clinicians are able to identify the degree of weight loss according to the conventional clinical criteria developed in hospital practice (table 3). The results of this study show that these variables were unable to differentiate those who experienced weight losses of up to 10% from those who experienced as little as 1% change in body weight. Significantly, blood pressure measured in the supine position was not different between the groups (table 2), indicating that resting cardiovascular function in the supine position does not appear to be abnormally compromised even in athletes who have lost significant amounts of weight during prolonged exercise. This is compatible with the finding of González-Alonso et al20 that the cardiovascular effects of dehydration are apparent only during exercise in the upright position, indicating that it is the upright position and not the dehydration that determines these physiological abnormalities. This also helps to explain why the effects of “dehydration exhaustion” are rapidly reversed by lying down5 and are due to “an inadequacy of the peripheral circulation”—that is, impaired venous return in the standing position. Lying down, especially in the head down position, clearly negates any unique effect of weight change on resting cardiovascular function. However, the important clinical point is that weight losses of up to 10% do not produce unique effects on resting cardiovascular function, including systolic hypotension in the supine position (table 2).
It is of considerable interest that our finding that the percentage loss in body weight is not a determinant of rectal temperature after a race in competitive athletes (fig 1)17 contrasts with laboratory studies in which an effect of weight loss on the rectal temperature after the race is consistently found, such that each 1% loss body in weight increases the rectal temperature by between 0.1°C21 and 0.4°C.22 However, if this relation were true, then a number of the athletes in group 1 should have completed the race with rectal temperatures of approximately 40.7°C. However, this was not the case. The highest rectal temperature (39.9°C) was measured in an athlete in group 3, who experienced a 2% weight loss. Higher rectal temperatures, ranging from 39.3°C13 to 40°C,20 with smaller weight changes of about 5%13 and shorter exercise bouts (120 minutes) have been reported in laboratory trials. We theorise that there may be at least two reasons for these discrepant findings between laboratory studies and outdoor competition.
Firstly, the work rate in laboratory trials is predetermined so that athletes are unable to pace themselves as they do in competition. Rather they must complete a predetermined task set by the experimenter without reference to any physiological cues originating in their bodies, which might influence the pace at which they would choose to complete the exercise bout. Yet there is clear evidence that the pacing strategy adopted during exercise is influenced, at least in part, by the rate of heat accumulation,23 such that a rate of heat accumulation is chosen specifically to prevent the onset of hyperthermia induced central neural fatigue which will ultimately terminate the exercise performance.24
The second possible explanation for this discrepancy is that laboratory studies are often undertaken in environmental conditions that are seldom experienced in outdoor competition either because the temperature and humidity are much higher or there is inadequate convective cooling, or both, in the laboratory studies. Indeed the review of Cheuvront and Haymes25 concludes that running speed, environmental conditions, and level of dehydration all affect the rectal temperature so that when the running speed is approximately the same, the ambient conditions are the better predictor of rectal temperature after the race than is the percentage dehydration.
Nevertheless, the findings of this study are surprising for two reasons. Firstly, the classical studies suggest that a weight loss of 7% or more produces the symptoms and signs of dehydration exhaustion, which prevent further exercise.4,5 However, some athletes in our study were able to continue exercising without apparent penalty even though their percentage weight loss exceeded that value. Again, the findings from studies of military personnel exercising in extreme desert heat for eight hours without access to fluid cannot be extrapolated to modern competitive sports held in much cooler environmental conditions in which athletes have free access to almost limitless fluid volumes. These data support the suggestion that the absolute percentage body weight loss at which exercise must terminate is probably influenced by both environmental and individual factors.
Secondly, a popular statement is that levels of dehydration greater than 2.5% are associated with linear impairments of exercise performance from 20 to 55%.13,26 Clearly the findings from this study are incompatible with that prediction, as the 6–10% weight loss that we measured should have impaired performance by 70–125%, if the data of Craig and Cummings26 are extrapolated, or by 58–110%, if the data of Pinchan et al27 are used
Similarly, other studies that are often quoted as evidence for an effect of dehydration on endurance performance19 would seem to have little relevance to outdoor exercise lasting many hours, because these studies have been of either very high intensity exercise or short duration, including the Wingate test which last 30 seconds,14 high intensity cycling lasting less than 10 minutes,28 or running lasting less than 50 minutes.29 In addition, the techniques used to induce high weight loss have not been physiological as they have involved the administration of diuretics29 or exposure to a sauna.30 Furthermore, the extent of convective cooling differs between indoor and outdoor exercise. Indeed, even in some of the earliest studies, Ladell31 noted “the absence of air movement is far more deleterious than we had expected from certain published work.”
Rather, in contrast with these predictions, we found that percentage body weight loss during the Ironman race was inversely related to finishing time, so that the athletes who lost more weight during the race tended to finish in the faster times (fig 2). We acknowledge that, although it may be incorrect to extrapolate these equations15,26,27 to longer duration exercise such as an Ironman triathlon, we are not aware of any collected or published data to predict impairments in performance under ultraendurance competitive conditions.
Thus it was possible to find a group of 86 triathletes in these races who lost an average of 6% of body weight during the race, yet whose performance was the same as that of a weight matched group of 86 other triathletes whose average weight loss during the race was 2% with a range of −3 to +3.7% (table 1). Furthermore, when the performance of all athletes for whom data are available was included, a weak but significant inverse relation was found between percentage loss in body weight and performance during the race, so that those who lost the greater percentage of their body weight, or who had lost the greatest amount of weight had faster finishing times. This relation illustrates that the percentage change in body weight explains only 5% of the variability in overall performance time. This suggests that 95% of the total variability in ultraendurance performance can be explained by other factors, either physiological or external, and we can thus conclude that high levels of weight loss have, at least, a marginal effect on total performance time.
However, as these data are cross sectional, they do not allow the conclusion that the two are related—that is, that higher levels of dehydration substantially enhance triathlon performance. Rather, they provide compelling evidence that the doctrine that “weight loss during exercise must be less than 2%”1 needs to be properly evaluated in prospective trials of competitive events lasting longer than a few minutes.
CONCLUSION
This cross sectional study found no evidence for an effect of increasing levels of weight loss during endurance exercise on medical health risk in competitors in an Ironman triathlon completed in mild environmental conditions. Thus, in the South African Ironman triathlon, significant reduction in body weight is an apparently unimportant determinant of rectal temperature after the race or the probability that a significant medical condition will develop. Rather, the only athlete requiring medical attention in this study incurred a 3 kg weight gain during the race.12 Hence, there is no logical basis to encourage high rates of fluid intake specifically to reduce the risk of heat illness in Ironman triathletes competing in relatively mild environmental conditions.
HOW THIS STUDY CONTRIBUTES TO THE AREA OF HYDRATION AND FLUID STATUS
There is a large body of literature that suggests that dehydration impairs performance and increases the risk of heat illness in ultradistance races. However, these conclusions have been based on laboratory studies using exercise interventions of relatively short duration and are thus limited in their application to performance in the field. This study therefore provides actual data collected from a large number of athletes during an ultradistance event (224 km), held out of doors. The findings from this study show that there is no increased risk of heat illness associated with high levels of dehydration, and that high levels of weight loss do not significantly influence performance.
Acknowledgments
Research at the 2000 and 2001 South African Ironman triathlons was funded by a dedicated grant from the race organisers, with support from the University of Cape Town, the South African Medical Research Council, and Discovery Health.
The following members of the ESSM Ironman Research team contributed to the collection of the data reported here: V Lambert, M Lambert, W Derman, M Schwellnus, A St Clair Gibson, A Bosch, J Belonje, L Grobler, R Arendse, I Rogers, G Mokone, J Bekker, T Kolbe, S West, L Micklesfield, L Dreyer, B Parr, C McMahan, A Hunter, L Nobbs, W Viljoen, A Claassen, N Sulzer, D Tabakin, I Bohlmann, Z Kubukeli, M Dreyer, R Bailey, M Mabandla, D Hudson, K Baxter, L van Niekerk, N Edmundson, T Gaetsewe, C Harrison-Smith, Y Kriel, L Ndaba, R Tindall, J van Onselen, J West, A Paterson, D Hampson, S Taliep, I Carlous, G Stubbs, J Manonyane, B Peya, P Robson, K Murphy, L van den Oever, K Wheaton, S Cobbing, T Louw, A van der Westhuisen, A De Pao, T Griffiths, M Hassen, D Nair, M Stevenson, T Kohn, L Rauch, C Crow, C Smith, J Clarke, L Salt, Body iQ Corporate Wellness, Pathnet Laboratories and the Shozaloza Outreach and Development Programme of the Sports Science Institute of South Africa.
REFERENCES
Footnotes
-
Conflict of interest: none declared