Article Text

Abstract
Background: Increased knee valgus predicts the risk of anterior cruciate ligament (ACL) injury, particularly in women. Reducing injury rates thus relies on detecting and continually evaluating people with relatively large valgus motions.
Objectives: To examine the potential of a two dimensional (2D) video analysis method for screening for excessive valgus.
Methods: Ten female and 10 male National Collegiate Athletic Association basketball players had three dimensional (3D) knee valgus and two dimensional (2D) frontal plane knee angle quantified during side step, side jump, and shuttle run tasks. 3D valgus was quantified from external marker coordinates using standard techniques, and 2D data were obtained from both the frontal plane projections of these coordinates (2D-Mot) and manual digitisation of digital video footage (2D-Cam). A root mean square (RMS) error was calculated between 2D-Mot and 2D-Cam data to evaluate the reliability of the latter. Correlations between 2D-Cam and 3D data (intersubject and intrasubject) were also conducted, and regression slope and r2 values obtained.
Results: 2D-Cam and 2D-Mot data were consistent for side step (RMS = 1.7°) and side jump (RMS = 1.5°) movements. Between subjects, 2D-Cam and 3D data correlated well for the side step (r2 = 0.58) and side jump (r2 = 0.64). Within subjects, 2D-Cam and 3D data correlated moderately for the side step (r2 = 0.25 (0.19)) and side jump (r2 = 0.36 (0.27)).
Conclusions: The 2D-Cam method can be used to screen for excessive valgus in elite basketball players, particularly for movements occurring primarily in the frontal plane. This method may also be a useful training evaluation tool when large reductions in dynamic valgus motions are required.
- ACL, anterior cruciate ligament
- 2D, two dimensional
- 3D, three dimensional
- DOF, degrees of freedom
- RMS, root mean square
- anterior cruciate ligament
- neuromuscular control
- knee valgus
- two dimensional
- injury
Statistics from Altmetric.com
- ACL, anterior cruciate ligament
- 2D, two dimensional
- 3D, three dimensional
- DOF, degrees of freedom
- RMS, root mean square
Anterior cruciate ligament (ACL) injury is a common and traumatic knee joint injury. About 100 000 ACL injuries occur annually in the United States1 mostly to young healthy people. This injury also predisposes the athlete to the risk of significant long term consequences such as osteoarthritis.2,3 Of particular concern is the significant sex disparity in non-contact ACL injury rates. In sports such as basketball, soccer, and team handball for example, women are reported to suffer non-contact ACL injuries 2–7 times more often than men.4–6 With this in mind, the prevention of sports related non-contact ACL injuries is imperative.
Abnormal or poor lower limb neuromuscular control during sports movements such as jump landing, pivoting, and cutting manoeuvres is suggested to be an important component of the non-contact ACL injury mechanism, particularly for women.7,8,9,10 Recently, Hewett et al11 corroborated this theory, showing prospectively that knee valgus angle and knee valgus moment during jump landing tasks predicts ACL injury risk in female athletes. Recent modelling studies further support this contention, with knee valgus moment being the knee joint loading component that is most sensitive to neuromuscular control variations during cutting movements.12 Reducing valgus motions and loads during high risk sports movements therefore, particularly in women, may provide a potential antidote to the current sex disparity in ACL injury risk.
The prevention of sports related non-contact ACL injuries relies largely on the ability to screen, and thus modify through targeted training, potential risk factors that are amenable to modification.9 Recent studies have shown reasonable success in reducing ACL injury risk through the screening and training of people with “high risk” lower limb neuromuscular control patterns, such as increased knee valgus.13–15 Typically in these instances, lower limb joint motions are first quantified over a series of sports movement—for example, jumping or cutting—trials, with the resultant mean peak motion values, in conjunction with pre-established risk criteria, used to identify those at risk.11,15,17 The effects of a resultant training intervention are usually evaluated by quantifying similar data in a subject both before and after the training protocol, which targets a reduction in these same pre-defined “high risk” neuromuscular parameters.13,18
Current high speed motion analysis technologies afford accurate and reliable measurement of three dimensional (3D) lower limb joint motion during dynamic execution of sports movements,7,16,19,20 and have indeed contributed to the success of current neuromuscular screening and intervention methods linked to these movements. Although these methods provide a “gold standard” for analyses of this type, they present considerable financial, spatial, and temporal costs, which severely limit their application to the large scale screening, training, and evaluation programmes necessary for successful prevention of non-contact ACL injuries.18
The above concerns have resulted in studies designed to formulate simpler but equally reliable methods for the detection of high risk lower limb movement patterns linked to ACL injury, such as lower extremity valgus.11,16 A suggested solution is to quantify frontal plane knee motions by a two dimensional (2D) approach using a standard video camera.15–17 An obvious and well documented concern, however, is whether a constant relation exists between knee valgus as measured using the 3D approach and measures of frontal plane knee angle. Internal rotation of the limb, for instance, most certainly contributes to frontal valgus when the knee is flexed. A lack of consistency between 3D and 2D data would considerably limit the potential for the latter method to successfully screen for increased, high risk valgus motions. It would similarly compromise the ability of this method to evaluate successful modifications in knee valgus motions as the result of a particular intervention. We therefore examined the strength of the relation between 2D frontal plane knee motion, measured with a standard video camera, and the 3D valgus motion of the knee, measured with established methods. In particular, we examined the viability of a 2D standard video analysis technique as both a screening and evaluation tool, as they pertain to dynamic knee valgus motions. For screening, the 2D method needs to reliably detect between subject differences in peak frontal plane motions. As an evaluation tool, it must be able to detect changes or variations in peak angles that occur within a subject. The following specific hypotheses were therefore tested.
-
A 2D standard video analysis method provides measurements of frontal plane valgus knee motion that are consistent with frontal plane calculations based on 3D multi-camera tracking.
-
For between subject comparisons, peak frontal plane knee angle measured by standard 2D video analyses correlates with peak 3D dynamic knee valgus.
-
For within subject comparisons, peak frontal plane knee angle measured by standard 2D video analyses correlates with peak 3D dynamic knee valgus.
METHODS
Subjects
Twenty (10 female, 10 male) National Collegiate Athletic Association division 1 basketball players were recruited as subjects. Before testing, approval for the study was obtained from the institutional review board of the Cleveland Clinic Foundation, and written informed consent was obtained from all subjects. Subject inclusion criteria were no history of operable lower limb joint injury and proficiency in performing the sporting movements under investigation. All testing was carried out in the biomechanics laboratory of the Department of Biomedical Engineering, The Cleveland Clinic Foundation. Table 1 summarises the characteristics of the subjects.
Characteristics of subjects included in investigation
Experimental design
For each subject, 2D and 3D knee joint kinematics and 3D ground reaction force data were recorded for the right (contact) leg during the execution of three different sports movements (side jump, side stepping, and shuttle running). Subjects were asked to perform 10 successful trials for each of the three movements. A successful trial required the contact phase of the movement to occur on a force plate (AMTI OR6-5 No 4048; Advanced Mechanical Technology Inc, Watertown, Massachusetts, USA) within the field of view of both a six camera, high speed (240 Hz) motion analysis system (Motion Analysis Corporation, Santa Rosa, California, USA) and a digital (30 Hz) video camera secured to a tripod 2 m on the opposing side of the force plate, in the same plane as the original motion direction (fig 1). Approach speeds were required to fall between 4.5 and 5.5 m/s.20 These speeds were accurately quantified during processing using the Motion Analysis System as will be described below.

Illustrations of movement criteria for side step (A), side jump (B), and shuttle run (C) tasks. For each of the three movements, success was based on the stance phase occurring on a force plate, within the field of view of both a high speed video system and a hand held digital video camera.
For the side step, cutting angles were required to be between 35° and 55° from the original direction of motion, with this range demarcated (with tape) by lines on the floor, originating at the centre of the force plate (fig 1A). Subjects were required to continue running after side step execution for about five steps, with a trial deemed successful if the initial foot contact after the cutting action fell within this prescribed range. For the side jump, subjects were required to run and then initiate a jump about 2 m on the approach side of the force plate. On landing on the force plate with the right foot, they were then instructed to push off perpendicularly (to the left) to their original direction of motion and land about 1.5 m to the left of the force plate centre (fig 1B). For the shuttle run, subjects executed the step immediately after contact with the force plate, such that their new direction of motion was about 180° to their original direction of motion (fig 1C). As for the side step, subjects were required to continue running for about five steps after their change in direction.
For each subject, 21 reflective markers of diameter 24 mm were secured with tape to pre-determined anatomical locations, before the recording of video data (fig 2). Attachment sites were shaved and attachment over areas of large muscle mass was avoided to minimise excessive marker movement during initial contact. A static (stationary) trial was first recorded with the subject standing in the neutral position, after which the left and right anterior superior iliac spine, medial femoral condyle, and medial and lateral malleoli markers were removed (fig 2).
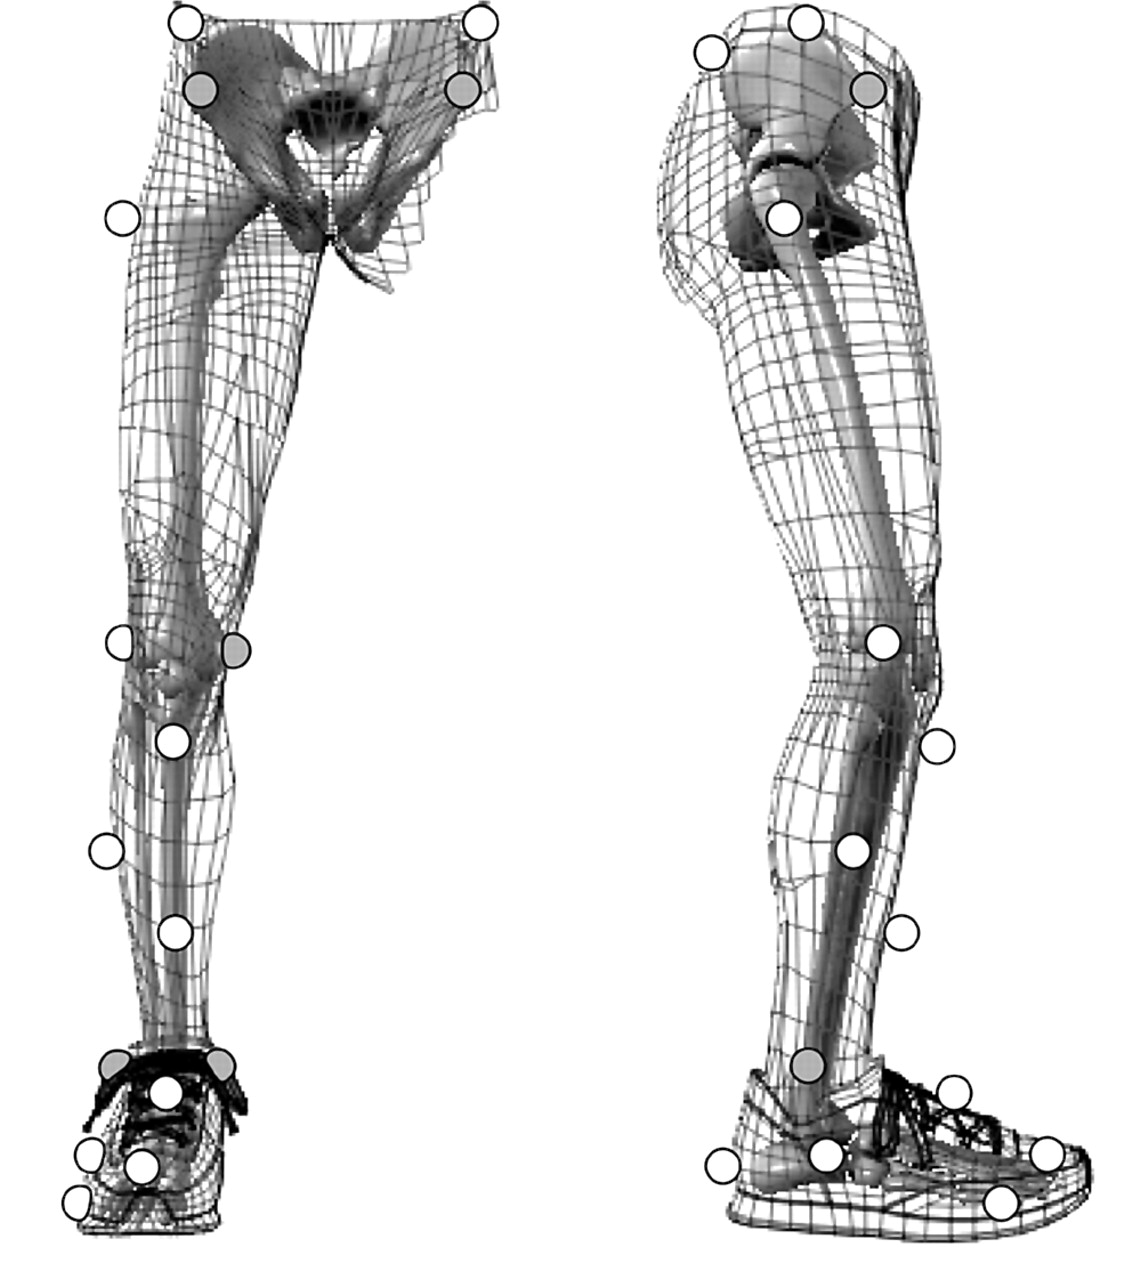
Marker locations used to define a kinematic model comprising five skeletal segments. The left and right anterior superior iliac spine, medial femoral condyle, and lateral and medial malleoli markers (grey) were removed for the recording of movement trials.
Analysis of 3D data
From the standing trial, a kinematic model was generated by defining five skeletal segments (foot, talus, shank, and thigh of the support limb, and the pelvis) and 14 degrees of freedom (DOF) using Mocap Solver 6.17 (Motion Analysis Corp), as described previously.21 Mocap solver performs model based kinematic analysis through global least squares optimisation22 and has been successfully used to quantify lower limb joint motions during side stepping tasks.20,23 For this investigation, the pelvis was assigned 6 DOF relative to the global (laboratory) coordinate system, with the hip,24 knee,25 and ankle26 joint defined locally and assigned 3, 3, and 2 rotational DOF respectively (fig 3).20
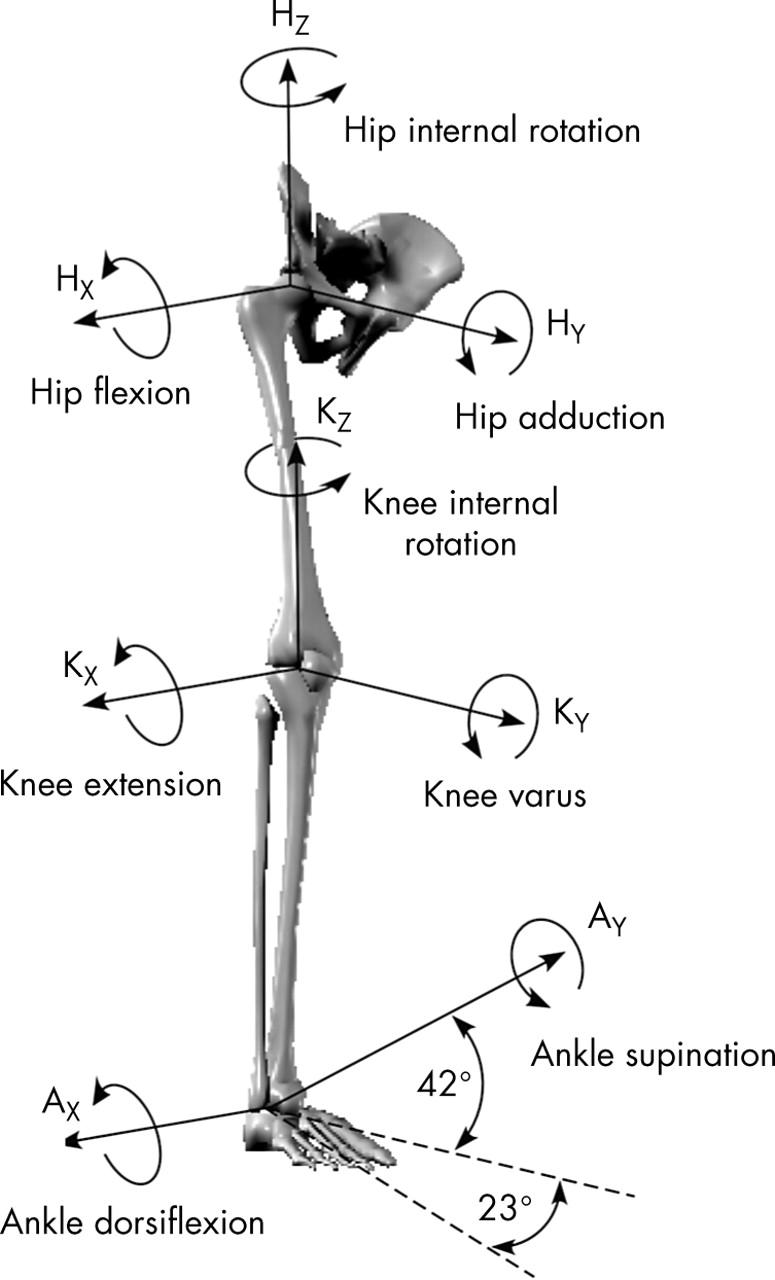
For the kinematic model, pelvis (body) motion was described with respect to the global (laboratory) coordinate system by 3 translational and 3 rotational degrees of freedom (DOF). The hip, knee, and ankle joints were defined locally and assigned 3, 3, and 2 rotational DOF respectively.
The 3D marker trajectories recorded during the test trials for each subject were processed by the Mocap Solver software to solve for the 14 DOF of the kinematic model at each time frame. The dynamic or functional valgus angle was quantified using a standard joint coordinate system27 and was defined as zero in each subject when the long axes of femur and tibia were aligned, as defined during the initial stationary shot (fig 3).20 This angle therefore represents the combination of static alignment and dynamic motion, as used previously.11,21 The valgus angle time series data were then low pass filtered with a cubic smoothing spline at a 20 Hz cut-off frequency.28 For each trial, the velocity of the X coordinate (direction of motion) of the greater trochanter marker was also calculated over the 10 3D video frames recorded before foot contact and was used to calculate approach velocity.
2D analyses
Measures of 2D frontal plane knee angle were obtained for each trial by two separate techniques. Firstly, the angle was calculated using the 3D external marker coordinate data generated by the high speed video analyses outlined above (2D-Mot). Specifically, the hip, knee, and ankle joint centres, first defined during standing, were transformed to global (laboratory) coordinates using rigid body assumptions, and 2D vectors were computed from knee to hip centre (kh) and from knee to ankle centre (ka). The cross product and vector norms were computed from the cartesian coordinates, and the 2D valgus angle (θ) was computed as in equation 1:

For the second case, the frontal plane knee angle was estimated from the raw video footage taken of each trial with the digital video camera (2D-Cam). Video data for each trial were first downloaded to a standard PC and subsequently imported into a custom software package (DgeeMe 1.0, www.geeware.com), which enabled manual digitisation of the 2D coordinates of points of interest. Specifically at each time frame, a single experimenter estimated and subsequently digitised hip, knee, and ankle joint centres by clicking directly on the video image. This procedure was repeated three times for each time frame, from which the mean 2D coordinates of lower limb joint centres were obtained. These data were used in equation 1 to calculate the 2D valgus angle.
Data synchronisation and normalisation
All 3D and 2D valgus data were time normalised to 100% of stance phase and resampled through linear interpolation at 1% time increments.28 For 3D and 2D-Mot data, stance phase was defined using the synchronised 3D force plate data. Specifically, contact began when the vertical force first exceeded 10 N and lasted until it fell below 10 N. For 2D-Cam data, initial ground contact was determined using a light stimulus, within the digital video camera’s field of view, which was simultaneously triggered by initial contact on the force plate. Toe off was estimated directly from the raw video data.
Statistical treatment
Stance phase knee (valgus and frontal plane) angles were calculated for each movement trial by each of the three measurement techniques, from which peak angles were obtained. To test the first hypothesis, a single root mean square (RMS) error was calculated for each of the three movement conditions, by equation 2:

In equation 2, N corresponds to the number of combined trials across subjects, with Cxi and Mxi corresponding to peak knee angles obtained for the ith trial by 2D-Cam and 2D-Mot methods respectively. Between trial variation (SD) in peak frontal plane knee angle obtained by the 2D-Mot approach was also calculated for each subject, from which a single group mean variance value was obtained for each of the three movement conditions. These values were compared directly with RMS errors to confirm the reliability of the 2D-Cam approach as a measurement tool for frontal plane knee angle.
To test the second hypothesis, mean peak valgus and peak frontal plane knee angles (10 trials) for each of the three movement conditions were obtained for each subject, from which correlations between mean 2D-Cam and 3D peak measures were conducted. The three (1 correlation × 3 movements) r2 values and the slopes of the associated linear regressions were subsequently determined and tested for statistical significance.
To test the third hypothesis, intrasubject correlations between 2D-Cam and 3D peak angle data were conducted, with r2 and regression slope data again being recorded for each subject. These data were subsequently submitted to an independent t test to determine whether the mean slope value for each movement was significantly different from zero. For all analyses, an α level of 0.05 was used to denote statistical significance.
RESULTS
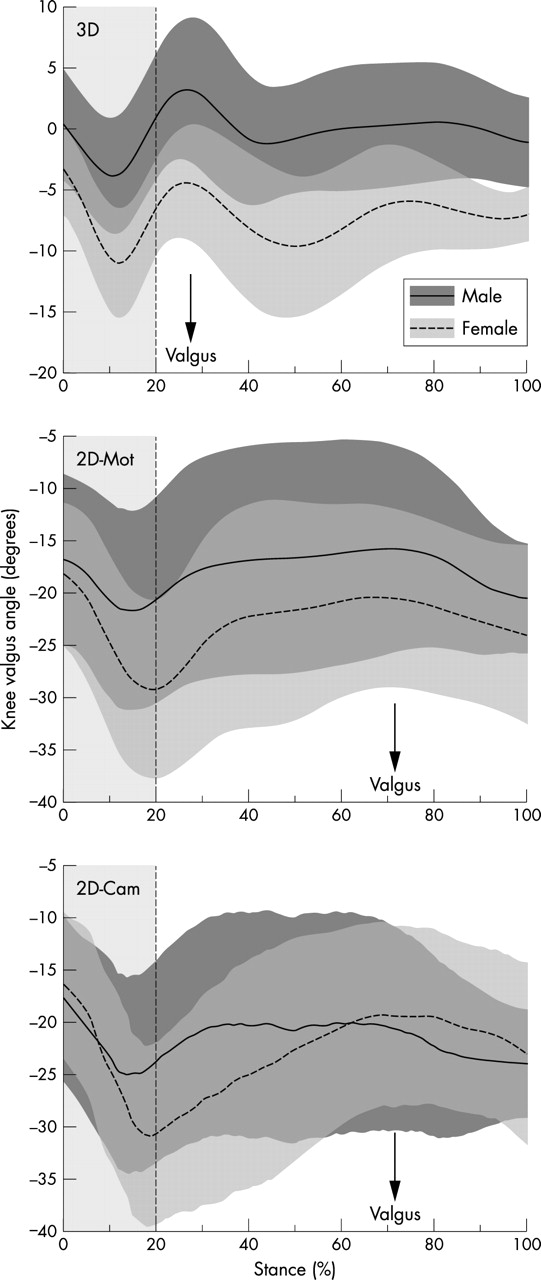
The 2D-Cam and 2D-Mot techniques resulted in similar stance phase valgus patterns for each of the three movement conditions, but frontal plane knee angles were on average larger than corresponding 3D knee valgus angles (table 2). The time of the rotation peak was also later for the 2D techniques. Mean male and female data are presented for side stepping as a sample (fig 4). Approach velocities were similar in the side step (4.85 (0.17) m/s), side jump (4.81 (0.26) m/s), and shuttle run (4.88 (0.31) m/s) conditions. This suggests that the approach speed was not responsible for differences between movements and sexes.
Peak mean (SD) stance phase knee valgus comparisons (in degrees) for three different movement conditions based on three measurement techniques

Comparisons of mean (SD) valgus excursions during side step stance for the three measurement techniques. 3D, Three dimensional data quantified from external marker coordinates using standard techniques; 2D-Mot, two dimensional data obtained from the frontal plane projections of the external marker coordinates; 2D-Cam, two dimensional data obtained from manual digitisation of digital video footage.
Mean RMS errors of 1.7°, 1.5°, and 16.0° were found for 2D-Cam and 2D-Mot peak angle data comparisons for side step, side jump, and shuttle run respectively. RMS errors were smaller than group mean between-trial variations observed in peak 2D-Mot frontal plane knee angles for both side step (3.3 (1.1)°) and side jump (3.3 (1.7)°). RMS errors were noticeably larger than between-trial variations, however, for the shuttle run (5.4 (2.6)°).
Between subjects, 2D-Cam and 3D peak angle measures correlated well for the side jump (r2 = 0.64) and side step (r2 = 0.58) (fig 5). In each case, the slope of the linear regression (side jump = 0.32; side step = 0.4) was significantly (p<0.05) different from zero. Correlations between these data for shuttle run movements yielded much lower r2 values (r2 = 0.04) and a slope (0.07) that was not significantly different from zero.
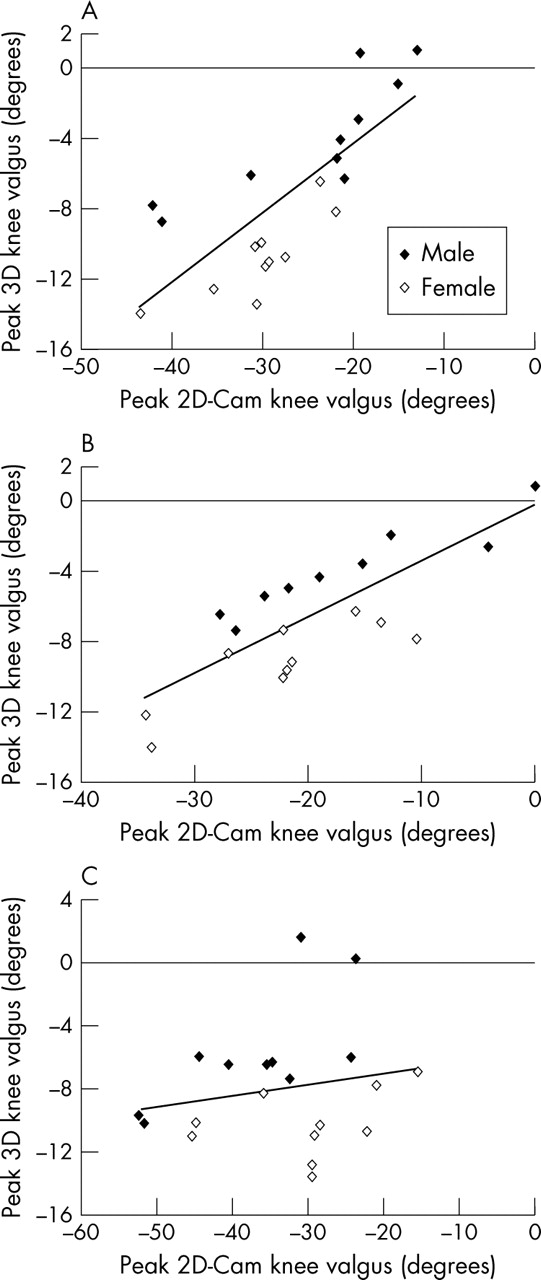
Associations between male and female mean peak valgus angles obtained by 2D-Cam and 3D measurement techniques during the stance phase of (A) side step, (B) side jump, and (C) shuttle run. 3D, Three dimensional data quantified from external marker coordinates using standard techniques; 2D-Cam, two dimensional data obtained from manual digitisation of digital video footage.
Within most subjects, moderate correlations were found between 2D-Cam and 3D peak angle data during side step and side jump, but not for the shuttle run (table 3, fig 6). The mean slope of the relation was significantly different from zero for side step and side jump. Subjects with large variations in valgus appeared to have stronger correlations between 2D-Cam and 3D angle data (fig 6).
Comparisons of mean (SD) intrasubject regression slope and variance measures for correlations between peak 3D and 2D-Cam valgus measures across three different movement conditions

Intersubject correlations between 2D-Cam and 3D valgus measures during the stance phase of (A) side step, (B) side jump, and (C) shuttle run movements. 3D, Three dimensional data quantified from external marker coordinates using standard techniques; 2D-Cam, two dimensional data obtained from manual digitisation of digital video footage.
DISCUSSION
The reduction of non-contact ACL injury rates, particularly in women, requires the development of large scale intervention programmes that can successfully screen for, and therefore modify, high risk, lower limb, neuromuscular control patterns. Recently, 3D dynamic knee valgus motion during sports movement execution was found prospectively to predict ACL injury risk in female athletes.11 The present study examined the potential for a 2D standard video measurement technique to detect between and within subject variations in peak dynamic knee valgus motions, with similar reliability to current “gold standard” 3D methods.
Mean 3D knee valgus patterns during side step, side jump, and shuttle run movements were consistent with those reported previously for similar tasks.16,19,20,23 Stance phase, frontal plane, knee angles obtained from both 2D-Mot and 2D-Cam, however, were notably larger than the 3D measures for each movement. Although the precise contributions remain unknown, knee flexion probably contributes directly to the resultant frontal plane knee angle when the femur is internally rotated. Exaggerated valgus estimates from frontal plane projections are thus expected. This observation suggests that a 2D measurement technique should be avoided when precise descriptions of knee valgus magnitudes are necessary. The potential for a 2D approach as a screening tool, however, should not be discounted. Successful screening of high risk valgus motions relies on reliable determination of interindividual differences in peak angle measures.13,17 Therefore, if a consistent relation exists between peak 3D dynamic knee valgus and the associated peak frontal plane knee angle, then a 2D approach may afford similar success in determining athletes with the largest valgus motions. The results of this study suggest that this may indeed be the case, at least for side step and side jump movements.
In direct support of our first hypothesis, 2D frontal plane valgus data obtained from manually digitised single camera video footage were consistent with frontal plane calculations based on 3D multi-camera tracking for both side step and side jump. Mean RMS errors for these movements were smaller than between-trial variations in peak angles quantified by the 2D-Mot method, suggesting that the 2D-Cam approach is equally reliable in identifying inter and intra subject differences in frontal plane knee motions. Both 2D-Mot and 2D-Cam valgus data were calculated by the same equation (equation 1), and both used nearly the same frontal plane definition. The small differences in peak knee angles between these two techniques therefore probably arose from differences in joint centre estimations. The 2D-Cam method relies on visual estimation of each joint centre directly from the video footage. In the case of the side step and, in particular, the side jump stances, the frontal plane of the body is generally parallel with the frontal plane of the video camera (fig 1), and thus reasonable estimation of joint centres should be possible. For the shuttle run, however, the athlete initiates a large direction change almost immediately after contact with the force plate, limiting the ability to reliably detect joint, in particular hip joint, centres. It appears therefore that the accuracy of 2D-Cam descriptions of frontal plane knee motion is largely dependent on the movement under investigation, being most amenable to movements in which the subject faces the camera throughout the stance.
The potential for the 2D-Cam technique as a screening tool for ACL injury risk through the detection of large valgus motions relies on its ability to successfully detect intersubject differences in this angle. In direct support of our second hypothesis, mean 2D-Cam peak angle estimates correlated well with mean peak 3D dynamic valgus for side step and side jump, suggesting that it may possess a similar screening potential. As noted above and suggested previously, frontal plane knee angle projections probably comprise several 3D lower limb joint rotational components.29 Although this may indeed be the case, the present results suggest that 3D knee valgus remains an important component of the projected frontal plane knee angle, at least for side step and side jump tasks. It is also possible that the remaining 3D kinematic parameters constituting the frontal plane knee angle have a direct effect on the 3D valgus measure. Internal hip rotation for example, which is suggested to directly influence 3D knee valgus,16,29 probably has similar effects on the resultant frontal plane knee angle measures, because of the linked segment dynamics of the lower limb.
The athletes examined in this study had extremely consistent 3D lower limb kinematic patterns during the side step and side jump movements.23 If frontal plane knee angle is indeed defined primarily by a specific group of 3D joint rotations outside of simply 3D knee valgus, a strong 2D-3D relation would rely on such a consistent movement strategy, particularly for that series of rotations. For other populations, large between-trial variations in lower limb joint kinematics during side stepping manoeuvres are possible.20 It is unclear whether, in these instances, 2D valgus estimates may be less reliable. Further research into the precise 3D kinematic contributions to 2D valgus and the kinematic predictors of 3D knee valgus would help to clarify this issue. However, the 2D-Cam method does appear to be a feasible screening tool for ACL injury risk arising from knee valgus motions in elite level male and female basketball players. This result is particularly pertinent considering the relatively high incidence of non-contact ACL injuries reported previously for athletes from similar populations.4,5
What is already known on this topic
Knee valgus during sports movements has been shown prospectively to predict non-contact ACL injury risk. Three dimensional motion analysis methods provide a “gold standard” for quantifying joint kinematics associated with these movements and can reliably detect people at increased risk of ACL injury through a valgus mechanism.
In partial support of our third hypothesis, 2D-Cam peak frontal plane and 3D dynamic valgus data showed moderate correlation within subjects for both side step and side jump, and limited association for shuttle run movements. Considering that intrasubject variations in peak 3D valgus for these movements were typically smaller than intersubject variations (fig 5), a lower mean r2 intrasubject comparison is intuitive. It is worth noting, however, that subjects with the largest between-trial variations in peak 3D valgus also had the highest r2 values (fig 6). Reliable detection of between-trial differences in peak 3D knee valgus may at least be possible by the 2D approach for these subjects. This result is important, as it suggests that a 2D method may still offer some potential as an evaluation tool within training programmes aimed at reducing valgus motions. Athletes exhibiting the greatest 3D knee valgus angles, for example, are known to be at the greatest risk of suffering an ACL injury by this mechanism.11 They will therefore probably require relatively large reductions in knee valgus to achieve “safe” normative magnitudes.11,13 If training can reduce peak 3D valgus motions by magnitudes similar to the largest between-trial variations observed here for this variable, then reliable detection of these changes should be possible with a 2D method. We did not implement any form of training in this study, nor did we instruct subjects to alter their valgus patterns in any way during movement trials. Hence, the true potential for the 2D method as a training evaluation tool remains speculative. More work is necessary to determine whether long term modifications to valgus motions are possible, and, if so, by what magnitude they can realistically be changed, before inclusion of 2D video as an evaluation can seriously be considered.
One reason for conducting this study was to determine whether a 2D video analysis tool could be successfully implemented within large scale neuromuscular intervention programmes attempting to reduce ACL injury rates. These results suggest that reliable screening of “at risk” people for specific movement tasks may certainly be possible with a 2D method. Although it may provide a cost effective alternative to current 3D motion analysis technologies, the relatively large processing requirements inherent in the 2D approach, particularly the manual identification of joint centres, does not lend itself to the already labour intensive requirements of intervention training programmes.18 Automated marker tracking software is available,30 and markerless methods are being developed,31 which would significantly expedite the processing of 2D video data obtained with low cost cameras. Such technologies should at the very least be considered for large scale intervention studies aimed at prevention of knee injuries related to dynamic valgus. However, it is crucial to first evaluate the reliability of a 2D video approach for the specific population/s and movement/s to be tested.
As noted, state of the art 3D motion analysis technologies and processing computational algorithms appear to provide a “gold standard” in terms of both accurate quantification of lower limb joint motions and detection of instances when these motions become large enough to cause injury.21,32 We have shown here that comparable success in terms of screening “at risk” people based on relatively large knee valgus motions may be possible using a 2D camera approach. However, these results should be considered within the limitations inherent in 3D analysis methods. Errors in defining anatomical landmarks by external skin markers, for example, have a direct effect on the position and orientation of resultant joint axes, culminating in the potential for significant errors in kinematic calculations.33,34 Similarly, excessive marker movement stemming from the high impact forces synonymous with these movements will probably compromise data integrity.35 As noted above, the 3D kinematic data in this study were generated using Mocap Solver 6.17, which performs model based kinematic analysis through global least squares optimisation.22 We have successfully used this method to detect relatively small sex differences in lower limb kinematics during similar high impact movements.20 Also, the optimised least squares approach allows the removal of markers that may be more prone to impact error, such as the anterior thigh marker, from the analyses.21
What this study adds
This study shows that a standard 2D video analysis method can successfully screen people at increased risk of non-contact ACL injury arising from large valgus motions. This method may allow identification of more “at risk” people within the population at relatively minor financial and temporal cost.
The ultimate success of any screening method relies on a precise understanding of the relation between knee motion, ACL load, and the subsequent risk of injury. In other words, we still do not know how much valgus is too much. It may be, for instance, that individual differences in knee joint anatomy and laxity, which are known to exist, precipitate “critical” dynamic valgus levels that are similarly subject specific. Until accurate descriptions of these relations are available, the potential exists for all screening methods to incorrectly exclude “at risk” people from the ensuing intervention process. Further research into the relation between joint mechanics and resultant ACL loading, particularly for movement scenarios synonymous with sport tasks, is therefore encouraged. Until this is achieved, screening should continue to identify anyone who displays relatively large dynamic 3D valgus motions compared with the remainder of the group being tested.
CONCLUSIONS
We examined the reliability of a 2D video measurement technique as an assessment tool for non-contact ACL injury risk, particularly as it pertains to valgus knee motion during high risk sports movements. From the results, we conclude the following.
-
The 2D-Cam method provides reliable descriptions of frontal plane knee motion for movements in which joint centres can easily be identified.
-
The 2D-Cam method provides similar potential to current 3D methods for the screening of ACL injury risk in elite level male and female basketball players stemming from dynamic valgus during side step and side jump movements.
-
The 2D-Cam method may be useful for evaluating the effectiveness of training programmes aimed at reducing dynamic knee valgus motions, particularly if large modifications in valgus are possible.
Acknowledgments
This work was supported by US National Institutes of Health (grants R01 AR47039 (to AJV) and R01 AR049735-01 (to TEH)).
REFERENCES
Footnotes
-
Competing interests: none declared
-
Ethics approval: study approval was obtained through the institutional review board of the Cleveland Clinic Foundation, and written informed consent for all subjects was obtained.