Article Text

Abstract
Objective: To investigate whether adipose subcutaneous tissue or skeletal muscle mass decreased during a non-stop ultra-endurance triathlon.
Design: Descriptive field study.
Setting: The Triple Iron Triathlon Germany 2006 in Lensahn: 11.6 km swimming, 540 km cycling and 126.6 km running.
Subjects: 17 male Caucasian triathletes, mean (SD) age 39.2 (7.5) years, height 178 (5) cm, body mass 80.7 (8.9) kg and body mass index (BMI) 25.4 (2.4) kg/m2.
Interventions: None.
Main outcome measurements: Determination of body mass, skin-fold thicknesses, limb circumference, skeletal muscle mass and percentage body fat in order to show changes after the race.
Results: A significant decrease was shown for body mass (p<0.001), BMI (p<0.001) and calculated percentage body fat (p<0.001) whereas skeletal muscle mass did not change significantly (p>0.05). Circumferences of the thigh, upper arm and calf did not decrease significantly (p>0.05), whereas all skin-fold thicknesses decreased significantly (p<0.05), with the exception of those at the chest and thigh. A significant correlation was found between the loss of percentage body fat and the loss of body mass (p<0.01, r2 = 0.55) as well as change in percentage body fat with race performance (p<0.05, r2 = 0.24).
Conclusions: Ultra-endurance triathletes at the Triple Iron Triathlon Germany 2006 showed a significant decrease in body mass and percentage body fat, where decrease in percentage body fat was associated with race intensity.
Statistics from Altmetric.com
Fat is the main energy-rich substrate for long-lasting endurance performance.1–4 Long-lasting exercise leads to a reduction in adipose subcutaneous tissue2 5 due to oxidation of fatty acids of adipose subcutaneous tissue in the contracting skeletal muscle.6
Ultra-endurance races offer an interesting opportunity to study decrease in body fat, but there seem to be differences between multistage races and non-stop races. In non-stop ultra-endurance races, it has been shown that athletes may undergo an enormous energy deficit2 7 8 and non-stop ultra-endurance performances lead to a considerable decrease in body mass.2 7–9 In contrast, in multistage races with stages during the day and rest at night, body mass has been shown to remain stable10 or even increase.3 However, recent studies of multistage races showed that skeletal muscle mass was reduced during a multistage run,11 whereas fat mass was reduced during a multistage ultra-triathlon.12
For non-stop races, there are no studies showing whether the decrease in body mass is associated with a decrease in fat mass or skeletal muscle mass. For this study, we investigated whether athletes had decrease in body mass in a non-stop ultra-triathlon (the Triple Iron Triathlon Germany 2006), and whether this decrease was due to a reduction in adipose subcutaneous tissue or in skeletal muscle mass.
METHODS
Subjects
All participants of the “Triple Iron Triathlon Germany 2006” in Lensahn, Schleswig-Holstein, Germany, were contacted by a separate newsletter from the organiser 3 months before the start of the race and asked to participate in our investigation. In total, 29 athletes (1 woman, 28 men) intended to start in the race; 25 (1 woman, 24 men) actually entered it. A total of 22 male Caucasian triathletes entered our study, and all gave their informed written consent.
The race
From 28–30 July 2006, the 15th Triple Iron Triathlon Germany took place in Lensahn, Schleswig-Holstein, Germany, comprising 11.6 km swimming, 540 km cycling and 126.6 km running. The race started at 07:00 on 28 July.
Swimming took place in a 50-m heated outdoor pool at a temperature of 25°C, and wetsuits were allowed. After passing the transition area, 67 laps of a hilly course of 8 km/lap had to be cycled in the surroundings of the town. After the cycling section, athletes had to change to the flat run course of 96 laps with 1.31 km per lap in the town of Lensahn. The cycling course was nearly free of road traffic, and the running course was completely free of traffic and illuminated during the night. All athletes had their own support crew to provide nutrition and change of material and equipment. The athletes had to arrive at the finish line within 58 h of the race start.
The weather on the first day was cloudy with no rain, and dry with a mean temperature of 28°C. In the first night, shortly before sunrise, it started to rain. The second day was initially cloudy, then in the afternoon, the sun appeared and the temperature rose to 30°C.
Measurements and calculations
The evening before the start and after arriving at the finish line, body mass, circumferences of upper arm, thigh and calf, and skin-fold thickness at eight regions of the body were measured for each athlete.
Body mass was determined with a commercial scale (Beurer BF 15, Beurer GmbH, Ulm, Germany) to the nearest 0.1 kg. Skin-fold thicknesses of the chest, midaxillary (vertical), triceps, subscapular, abdominal (vertical), suprailiac (at anterior axillary), thigh and calf were measured with a skin-fold calliper (GPM-Hautfaltenmessgerät, Siber and Hegner, Zurich, Switzerland) to the nearest 0.2 mm. Circumferences of the upper arm and calf were measured at the largest diameter of the limb; for the thigh, this was 15 cm above the upper pole of the patella. All circumferences were measured to the nearest 0.1 cm. Skin-fold thicknesses and circumferences of the limbs were measured on the right side of the body.
Every measurement was taken three times by the same person and the mean value was used for calculation. Skeletal muscle mass (SM) was calculated using the following formula:
SM = Ht×(0.00744×CAG2+0.00088×CTG2)+0.00441×CCG2+2.4×sex−0.048×age+race+7.8,
where Ht is height; CAG was skin fold-corrected upper arm girth; CTG is skin fold-corrected thigh girth; and CCG, skin fold-corrected calf girth. Sex was 1 for male, and race was 0 for white.13 Percentage of body fat (%BF) was calculated using the following formula:
%BF = 0.465+0.180(Σ7SF)−0.0002406(Σ7SF)2+0.0661(age),
where Σ7SF is the sum of skin-fold thickness of chest, midaxillary, triceps, subscapular, abdomen, suprailiac and thigh mean.14
Statistical analysis
Values of measured and calculated parameters were compared before and after the race.
Statistical analysis was performed with the R software package.15 The one sample Wilcoxon signed rank test was used to check for significant changes in body mass, body mass index (BMI), percentage body fat, skeletal muscle mass, skin-fold thicknesses, and circumferences of thigh, calf and arm during the race. Spearman rank correlation was used to identify which parameters were responsible for loss of BM. We did not correct for multiple statistical comparisons because this was an exploratory investigation and not one in which specific hypotheses were tested on the basis of pre-existing data. For all statistical tests, significance was set at p = 0.05.
RESULTS
Of the total number of entrants, the single woman and 21 men finished the race successfully within the time limit. From our subject group, 17 men (mean (SD) age 39.2 (7.5) years, height 178 (5) cm, body mass 80.7 (8.9) kg and BMI 25.4 (2.4) kg/m2) finished the race. They prepared for this competition with average training of 18.9 (SD 7.4) (range 6 to 33) hours per week and had an average experience of 18 (range 2 to 55) ultra-endurance races of ⩾24 hours before the start of this race. The winner finished the race within 34 h and 33 min, the slowest finisher of our study group finished after 53 h 46 min. Average race time for our subjects was 45.5 (SD 5.3) h and 36.8 (SD 15.1) min. Table 1 shows the data before and after the race.
Body mass decreased significantly (p<0.001), as did skin-fold thicknesses (p<0.05) with the exception of the chest and thigh. Limb circumferences did not decrease significantly (p>0.05). Table 2 shows the calculated parameters before and after the race.
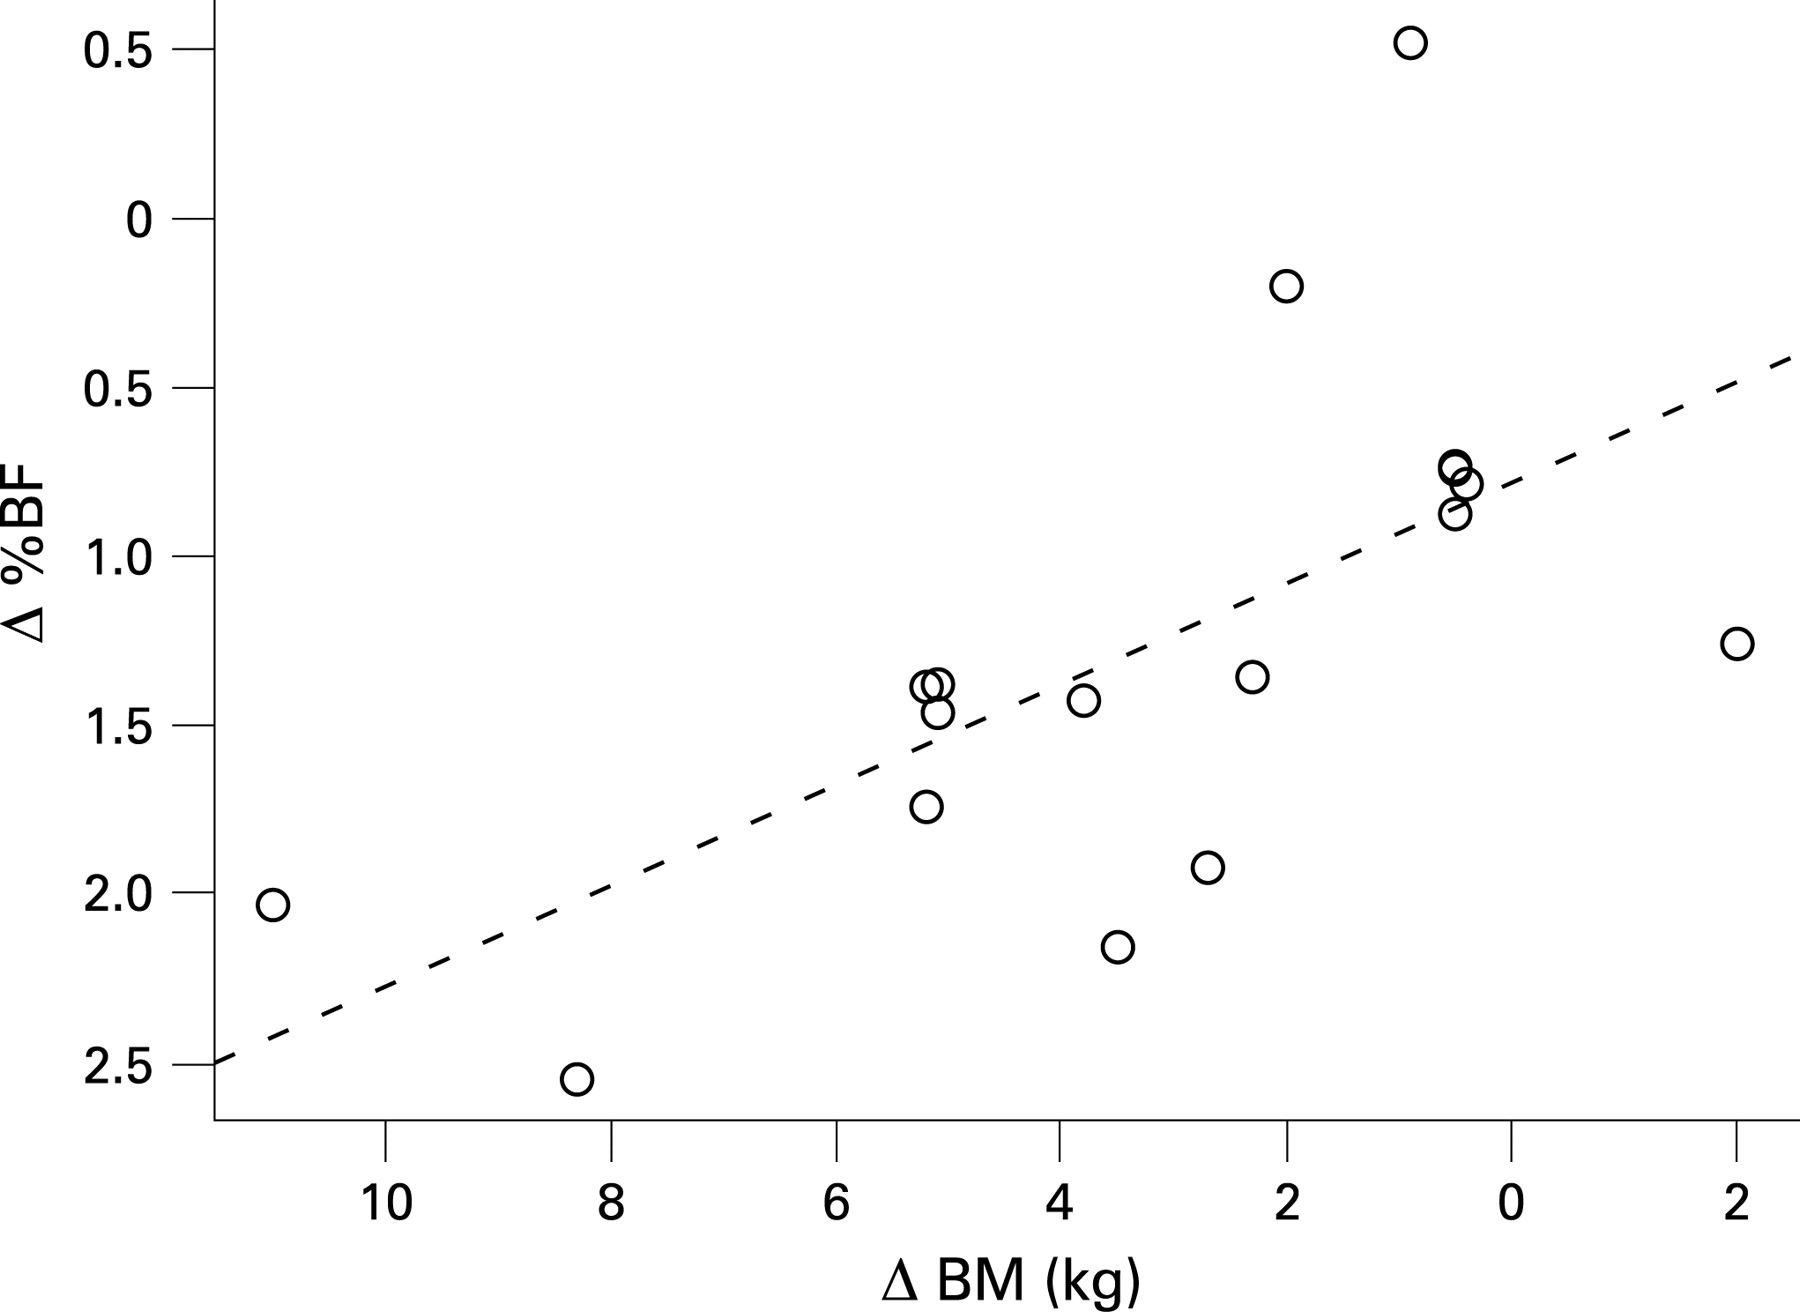
Skeletal muscle mass remained stable. In contrast, percentage body fat and BMI decreased significantly (p<0.01). A significant correlation was found between the loss of percentage body fat and the loss of body mass (p<0.01, r2 = 0.55) (fig 1). Change in percentage body fat is associated with race performance (p<0.05, r2 = 0.24) (fig 2).

DISCUSSION
The main finding of our investigation was that a non-stop ultra-triathlon with a continuous performance over 45 h resulted in a significant decrease in body mass and percentage body fat, whereas skeletal muscle mass remained stable. The decrease in body fat was associated with decrease in body mass and race intensity. A further finding is that the skin-fold thicknesses decreased preferentially in the upper body, whereas that of the thigh remained stable. The adipose subcutaneous tissue also seemed to decrease preferentially in the upper body.
Decrease in body mass during endurance performance
In general, non-stop endurance performances over hours and days or even weeks result in a decrease in body mass;2 7–9 this has been found to be 2 kg in an ultra-cycling race,7 3.3 kg in a Double Iron Triathlon,9 5 kg in the Race Across America8 and 5.7 kg in skiing across the Greenland icecap.2 Our athletes showed an average loss of 3.3 kg body mass (table 1), clearly more than the decrease in body mass that has been measured in an Ironman triathlon, where athletes also showed a significant decrease.16–18 In one Ironman distance, body mass declined by 2.3 kg16 to 2.5 kg.19 A loss of 2.5 kg body mass corresponded to a mean percentage loss in body mass of 3%.20 Our athletes lost 3.3 kg, corresponding to a 3.9% loss of body mass (table 1).
In general, adipose subcutaneous tissue is the main energy source for long-lasting endurance performance1–3 12 and skeletal muscle mass seems to be spared.4 In a previous study of a multistage ultra-endurance run it was shown that fat mass decreased. In a run over 1000 km in 20 days, the fat mass and all skin-fold thicknesses showed tendency towards reduction; only the thigh skin-fold measurement initially increased, but this began to reduce from the fourth day.3 Helge et al also showed that fat mass decreased in an extreme endurance event. Their four subjects lost 5.7 kg body mass, of which 78% was fat and the reminder lean body mass.2 As shown in other studies, skeletal muscle mass may remain stable in ultra-endurance performance,1 4 but in a run of 1000 km in 20 days, skeletal muscle mass initially increased, then decreased in the middle of the distance, and finally stabilised.21 In a recent study in a multistage ultra-endurance run over 5 days, skeletal muscle mass decreased significantly after the first day and remained from then on remained stable.11 Therefore skeletal muscle mass does not seem to be the first energy source during long-lasting ultra-endurance performance.
Fat mass as a source of energy
We found in this study that skin-fold thicknesses decreased preferentially on the upper body, with the only exception being the chest. In the leg, skin-fold thickness decreased non-significantly at the thigh by 0.5 mm, but at the calf, it was reduced significantly by 0.9 mm (table 1). We believe that the decrease in skin-fold thicknesses on the upper body led to the reduction in adipose subcutaneous tissue, as shown by the decrease in percentage body fat (table 2). It is likely that this decrease was a result of the swinging of the arms during running, where fat oxidation seems to be increased compared with cycling. Our previous study22 and that of Achten et al23 found that fat oxidation is higher in running than in cycling.
Reduction in adipose subcutaneous tissue seems to be different in the different regions of the body. Helge et al found that in athletes skiing across Greenland icecap, fat oxidation is increased during submaximum arm exercise after prolonged, low-intensity, whole-body training.2 In their study, a marked increase in fat oxidation during arm exercise was shown. Mobilisation of fatty acids from the femoral and the abdominal adipose subcutaneous tissue during exercise has been shown,5 24 25 but there seem to be differences in the extent of mobilisation of fatty acids from these two regions. According to the results of Boschmann et al, we would expect a greater reduction in the skin fold at the thigh.5 Thy showed that lipolysis of femoral adipose tissue is greater than that of abdominal adipose tissue. Their subjects exercised on a bicycle and therefore used their leg muscles, as did our subjects, but our subjects showed no significant reduction in skin-fold thickness at the thigh. Interestingly, reduction in skin-fold thickness at the suprailiacal region was, at – 25% , the largest change of all measured skin-folds (table 1).
In some situations, skeletal muscle mass seems to deliver energy in ultra-endurance performance.1 7 11 In our subjects, the decrease in percentage body fat was 1.1%, whereas skeletal muscle mass showed no change (table 2). We therefore believe that our athletes did not lose skeletal muscle mass in order to provide energy. During very long endurance exercise it has been shown that the continuous degradation of muscle protein21 26 results in a reduction in the concentration of albumin and total protein.27 In an extreme running race in Alaska, the athletes ingested mainly carbohydrates. They also lost body mass, and with associated ketonuria and proteinuria, it was concluded that proteins were metabolised to support energy expenditure.28 The degradation of proteins may lead to hypoproteinaemic oedema, but in our athletes, circumference at the calf decreased non-significantly by 4 mm and skin-fold thickness decreased significantly by 9 mm (table 1). Therefore, oedema of the leg is not a plausible explanation.
Reduction in fat mass and exercise intensity
The decrease in body mass was associated with a decrease in percentage body fat (fig 1) and this decrease was associated with race performance (fig 2). The ability to utilise fat as fuel is important in ultra-endurance athletes.29 It seems likely that athletes in ultra-distance races rely upon their fat mass as source of energy; at least, those athletes who are able to burn their own body fat stores were more successful in an ultra-endurance race. However, this does not mean that increased adipose subcutaneous tissue automatically leads to better performance in ultra-endurance races. These athletes must train the degradation of their adipose subcutaneous tissue in order to deliver energy. We found that intensity of race performance is associated with decrease in body fat (fig 2). In several laboratory studies, it has been shown that intensity of exercise is important for fat oxidation, and with increasing exercise intensity, fat oxidation also increases. The highest fat oxidation rate in men lies between 65%6 30 31 and 75%22 of maximum oxygen uptake (VO2max).
Does dehydration affect body mass in ultra-endurance performance?
We measured our athletes post race immediately after arriving at the finish line and could not determine whether they were dehydrated or not. Dehydration may lead to a decrease in body mass and could therefore have affected our results. It may be hypothesised that the weight loss in an Ironman triathlon is mainly due to dehydration, but it has been reported that the weight loss in this race probably derives from sources other than fluid loss.19
What is already known on this topic
-
Endurance performance leads to a reduction in adipose subcutaneous tissue.
-
In general, low-intensity exercise is recommended to reduce subcutaneous fat mass.
What this study adds
-
In ultra-endurance performance, decrease in fat mass is associated with race intensity.
-
The higher the intensity, the more adipose subcutaneous fat mass becomes reduced.
Many indices of hydration levels, such as body weight, plasma osmolality, urine osmolality and urine specific gravity, have been used in previous studies.32 During dehydration, we would expect an increase in haematocrit,33 but in fact, ultra-endurance performance leads to hypervolaemia with haemodilution, and hence to a decrease in haematocrit.34–38In a Triple Iron triathlon, haematocrit decreased from its pre-race values.39–41 The phenomenon of hypervolaemia with haemodilution and decrease in haematocrit is explained by a shift of intracellular water to the extracellular space and increased fluid intake during performance.42
The question of whether dehydration really occurs during an ultra-endurance performance still remains. Studies of Ironman and Triple Iron triathlons showed that athletes had a loss of body mass without dehydration. Laursen et al found in their field study with 10 Ironman triathletes that the significant mean decrease of 2.3 (SD 1.2) kg (−3.0 (SD 1.5)%) body mass during the race was not related to urine specific gravity.16 Volk et al examined, using bioelectrical impedance analysis, the hydration status in ultra-endurance triathletes during the Triple Iron Germany 1999 in Lensahn.40 They compared their results of bioelectrical impedance analysis with standard laboratory testing (haematocrit, serum osmolality and serum concentration of sodium). During the cycling stage of the triathlon, haematocrit increased, sodium concentration and plasma volume decreased, and cycling in hot conditions caused a the vectors in the bioelectrical impedance analysis to become steeper and longer. In contrast, after running in the heat, haematocrit decreased, plasma volume increased and the vectors in the bioelectrical impedance analysis showed shortening and a downwards slope to the baseline. After the race, only body mass showed a significant decrease (2 kg). Haematocrit, sodium and osmolality showed no significant changes. This group suggested that there may have been involuntary dehydration during the cycling because the athletes were alone at night, whereas during the run, the support crew had more opportunity to keep the athletes fed and hydrated, therefore, the study could not prove dehydration during a Triple Iron triathlon.
CONCLUSION
A Triple Iron Triathlon within an average finish time of 45 h led to a significant decrease in body mass and percentage body fat in well-trained and very experienced ultra-triathletes, whereas skeletal muscle mass remained stable. The loss of body mass could be explained by the decrease in percentage body fat, which was associated with race performance. Owing to the fact that skin-fold thicknesses significantly decreased in the upper body, it seems that adipose subcutaneous tissue was reduced preferentially in this area.
Acknowledgments
For their help in translation, we thank M Knechtle, Lausanne, Switzerland and M Miller, Stockton-on-Tees, Cleveland, UK, who was a member of an ultra-endurance support crew.
REFERENCES
Footnotes
-
Competing interests: None.