Article Text

Abstract
Aim: This paper provides an overview of the epidemiology of rugby league injuries and associated costs in New Zealand requiring medical treatment.
Method: New Zealand national Accident Compensation Corporation injury data for the period 1999 to 2007 were searched for rugby league injury cases. Data were analysed by demographics, body region, nature/severity of injury, and medical procedure and costs.
Results: A total of 5941 injury entitlement claims were recorded over the study period with a significant decrease observed in the injury rate between the 1999–2000 and 2002–2003 reporting years. The total cost of the injuries for the study period was $42 822 048 (equivalent to £15 916 072). The mean (SD) number of injury entitlement claims per year was 743 (271) and yearly cost was $5 352 760 (£1 989 880) ($2 485 535 (£923 994)). The knee was the most commonly reported injury site (225 per 1000 entitlement claims; $8 750 147 (£3 252 020)) and soft tissue injuries were the most common injury types (474 per 1000 entitlement claims; $17 324 214 (£6 438 599)). Accounting for only 1.8% of total injury entitlement claims, concussion/brain injuries accounted for 6.3% of injury entitlement costs and had the highest mean cost per claim ($25 347 (£9420)). The upper and lower arm recorded the highest mean injury site claim cost of $43 096 (£16 016) per claim. The 25–29 age group recorded 27.7% of total injury entitlement claims and 29.6% of total injury entitlement costs, which was slightly more than the 20–24 age group (27.3% claims; 24.7% costs). Nearly 15% of total moderate to serious injury entitlement claims and 20% of total costs were recorded from participants 35 years or older.
Discussion: This study identified that the knee was the most common injury site and soft tissue injuries were the most common injury type requiring medical treatment, which is consistent with other international studies on rugby league epidemiology. This study also highlights that the rate of injury and the average age of injured rugby league players increased over time. The high cost of concussion/brain injuries is a cause for concern as it reflects the severity of the injuries.
Conclusion: Injury prevention programmes for rugby league should focus on reducing the risk of concussion/brain injury and knee and soft tissue injury, and should target participants in the 20–30 years old age range. More longitudinal epidemiological studies with specific details on injury mechanisms and participation data are warranted to further identify the injury circumstances surrounding participation in rugby league activities.
Statistics from Altmetric.com
Rugby league is an intermittent contact sport that is played internationally at junior,1 amateur,23 semi-professional4 and professional56 levels of participation. By nature, it is an intermittent collision sport that requires the participants to compete with a combination of muscular strength, stamina, endurance, speed, acceleration, agility, flexibility and aerobic endurance.78 As such there is a risk of musculoskeletal injury occurring from the match and training environments due to the number of physical collisions and tackles that occur.1234 Injury may result in hospitalisation, inability to participate in training and match activities and inability to participate in work related activities. This may also result in loss of income to the injured player, financial costs for medical related care and job limitations owing to the severity and type of the injuries that have occurred.
Several published studies on the incidence of injuries in rugby league1234569 have identified changes in the injury incidence as a result of changes in playing season,5610 rule changes11 and different participation levels.1234569 Professional participation has a 1.3-fold to 2.2-fold higher injury rate than amateur participation,12 and semi-professional participants have the highest injury incidence (825 per 1000 player position game hours).412
Despite an increasing number of international studies on rugby league injuries, there is a paucity of studies describing injuries in New Zealand rugby league players. There is limited longitudinal rugby league injury surveillance data and a paucity of studies on the financial costs of injuries that have occurred as a result of participating in rugby league activities. Published studies1314 that have provided an insight into some of the associated costs of rugby league injuries have looked at a limited number of participants via surveys. These studies reported a median direct (£28 ($76))13 and indirect (£77 ($207))13 cost per playing injury as well as long-term job limitations, medical costs and loss of income as a result of injuries that were sustained from participating in rugby league activities.14 No studies to date have undertaken an epidemiological review of the costs of an injury from rugby league participation.
With this in mind the aim of this study was to provide an epidemiological overview of rugby league injuries and associated costs in one country (New Zealand) over 8 years. New Zealand’s national taxpayer funded no-fault injury compensation system administered by the Accident Compensation Corporation (ACC) means that New Zealand is uniquely positioned to provide detailed descriptive epidemiological data including costs associated with treatment. Using this data, comparisons of the rate, site, type, cost and location of rugby league injuries over 1999 to 2007 were conducted.
Methods
People who have a personal injury can make an open access claim to the ACC at the time of seeking medical treatment from over 30 000 registered health professionals throughout New Zealand. When making a claim, information about the injury is collected using a standard ACC 45 injury reporting form to ensure levels of consistency for data recording and analyses. The injured person (unless impaired) completes information about the activity surrounding the injury (eg, location, activity prior, cause, narrative) along with their personal details (eg, age, gender, ethnicity, contact details). The registered health professional completes the form by providing information regarding initial diagnosis and other relevant medical information (eg, surgical procedure). The claim is then filed with the ACC and details are entered into a central database. The ACC covers compensation for the injury (sporting or other) including medical treatment, income replacement, social and vocational rehabilitation and ancillary services (transportation and accommodation) as part of the rehabilitation.15
The ACC makes no disincentive for making claims nor are people risk-rated or penalised for the amount of claims they make.15 Personal injury coverage is guaranteed by the ACC but this is offset by the restriction to sue for personal injury except in rare circumstances for exemplary damages.15 The ACC categorises the rugby league claims made as minor or moderate to serious claims (MSCs). Throughout the study period there were 42 754 rugby league claims costing the ACC $48 704 704 New Zealand dollars (NZD) (equivalent to £18 099 470). MSCs represented 13.9% (5943) of the number of total rugby league claims but 87.9% (NZD $42 822 048 (£15 916 048)) of the costs. For this study we focused on MSCs, rather than minor rugby league claims as defined by the ACC for its sports cost outcome model,15 that occurred between 1 July 1999 and 30 June 2007 as a result of participating in rugby league activities. A potential limitation to the ACC data are the way the data are retrieved to protect client confidentiality by limiting the access to low level results under four injury entitlement claims. Therefore any data less than or equal to three injury claims have been rounded to represent three claims only.
As there were no reliable rugby league participation data collected by New Zealand Rugby League, New Zealand population data were obtained from official government data. This data set provides estimates of resident populations between each 5-year census.16 The population of New Zealand over the study period was approximately 4.1 million people based on the 2006 census.16
ACC data were analysed by various categories: (1) injury site, (2) injury type, (3) age and (4) region/district (see table 1).
Data categories analysed
Ethical consent
Ethical consent for the research was obtained from the Auckland University of Technology Ethics Committee. Informed consent from the injured participants was not obtained as data were collected from the ACC database without individual player identification or follow-up.
Statistical analyses
All the data collected were entered into a Microsoft Excel spreadsheet and analysed with SPSS V16.0. (SPSS Inc, Chicago, Illinois, USA). Injury rates were calculated as the number of injuries per 1000 injury entitlement claims.17 Data are reported as means and standard deviations and with 95% confidence intervals (CIs) where appropriate.18 The injury rates and patterns were compared between reporting years using a one-sample χ2 test. Significant p values reported in the text are <0.001 if they are not specifically stated. Injury rates for two selected periods (2002–2003 and 2006–2007) were compared in more detail. These years were chosen as they reflected the lowest and highest injury claim rates for rugby league over the 8-year period. Injury incidence was not calculated for the study as rugby league participation rates were not available as part of the data analysis. All costs are reported in NZD ($) and UK pounds (£) unless otherwise indicated.
Results
Over the July 1999 to June 2007 period there were 5943 moderate to serious injury entitlement claims recorded for rugby league injury. Initially, the injury entitlement claims and costs decreased (mean (±SD) claims: 8.1 (5.4)%; costs: 1.5% (3.5)%) over the 1999–2000 to the 2001–2002 reported periods. But from the 2002–2003 to the 2006–2007 reporting periods, the injury entitlement claims increased per reporting year (claims: mean 25.9 (19.8)%; costs: mean 43.3% (9.9)%). There was a significant decrease in the injury rate between the 1999–2000 and 2002–2003 reporting years (see table 2) from 105 to 81 per 1000 injury entitlement claims, but a significant increase in the injury rate to 195 per 1000 injury entitlement claims in 2006–2007 compared with 2002–2003. The injury claims and costs varied by reporting year from 539 MSC injury entitlement claims $3 616 427 (£1 341 812) in 2000–2001 to 1162 MSC injury entitlement claims $10 542 550 (£3 911 126) in 2006–2007. The mean number of yearly injury entitlement claims over the study period was 743 (±271) and the mean yearly cost was $5 352 760 (±$2 485 536) (£1 985 045 (±£921 748)). The mean cost per claim for the study period was $7100 (±$945) (£2631 (±£350)). The mean cost of the non-MSC injury entitlement claims was $161 (±$34) (£60 (±£13)).
Total injury rate per 1000 entitlement claims with 95% CIs and percentage of total claims and differences by year
Total injury entitlement claims and costs by district
More injury entitlement claims were recorded in the North Island (761 per 1000 injury entitlement claims; 76.2%) than the South Island (215 per 1000 injury entitlement claims, 21.6%) (χ2 = 1904, df = 1) (see table 3). Over 75% of the costs were for North Island players (North: $32 432 546 (£12 017 242); 75.7%; South: $9 330 145 (£3 457 102) and 21.8%). Despite this, the mean cost per injury entitlement claim was higher in the South than the North Island ($7278 (£2701) vs $7164 (£2658)). In the North Island, Auckland recorded more claims (386 per 1000 injury entitlement claims; 38.7%) and costs ($16 197 746 (£6 005 941); 37.8%) than other North Island districts (χ2 = 7298, df = 8) while Canterbury recorded more claims (152 per 1000 injury entitlement claims; 15.2%) and costs ($9 699 320 (£3 953 815); 15.2%) than other South Island districts (χ2 = 3047, df = 6). Otago recorded 2.2% of claims (22 per 1000 entitlement claims) and 3.5% of total costs ($1 514 433 (£561 114)) but had the highest mean cost per claim for all districts ($11 387 (£4218)).
Total injury rate per 1000 entitlement claims with 95% CIs and percentage of total claims and differences per year by district 1999 to 2007
Total injury entitlement claims and costs by injury site
There were significant differences in the total number of injury entitlement claims for injuries to the head and neck (χ2 = 59, df = 5), upper limbs (χ2 = 304, df = 4), lower limbs (χ2 = 245, df = 5) and chest and back (χ2 = 66, df = 4). The knee was the most commonly recorded injury site followed by the shoulder; ankle and hand/wrist (see table 4). The lower limb recorded 42.4% of the injury entitlement claims and 31.5% of the total injury claim costs ($13 490 695 (£4 999 486)). The mean cost of a lower limb injury entitlement claim ($5358 (£1996)) was lower than the mean cost of an upper limb injury entitlement claim ($5361 (£1988)). Although the upper and lower arm recorded 5.9% of total injury entitlement claims and 4.8% of total injury entitlement costs, the upper and lower arm recorded the highest mean injury entitlement claim cost of $43 097 (£15 979) per claim. This was more than the mean injury entitlement claim cost for the head (except face) ($28 725 (£10 648)), neck, back of head ($23 944 (£8 876)) and back/spine ($23 461 (£8699)). The knee recorded the most total injury entitlement claims (22.5%) accounting for 20.4% of total injury entitlement costs ($8 750 147 (£3 244 247)) with a mean claim cost of $6540 (£2424). This was less than the mean cost of the shoulder injury entitlement claim ($6802 (£2521)).
Total injury rate per 1000 entitlement claims with 95% CIs and percentage of total claims and differences per year by injury site from 1999 to 2007
Total injury entitlement claims and costs by injury type
Soft tissue injuries were the most common rugby league injury entitlement claims lodged while fractures/dislocations were slightly less (see table 5). Accounting for only 1.8% of total injury entitlement claims, concussion/brain injuries accounted for 6.3% of injury entitlement costs ($2 712 139 (£1 012 763)) with the highest mean cost per claim ($25 347 (£9487)). This was more than the mean cost of injury entitlement claims for fracture/dislocations ($6469 (£2422)), soft tissue injuries ($6149 (£2302)) and lacerations/puncture/wounds ($3107 (£1162)).
Total injury rate per 1000 entitlement claims with 95% CIs and percentage of total claims and differences per year by injury type from 1999 to 2007
Total injury entitlement claims and costs by age and gender
There were significant differences in most of the age groups recorded for the total injury entitlement claims and costs. The 25–29 age group recorded 27.7% of total injury entitlement claims and 29.6% of total injury entitlement costs. This was slightly more than the 20–24 age group (27.3% claims; 24.7% costs) (see table 6) (χ2 = 0.134, df = 1, p = 0.71). The 20–24 age group recorded significantly more injury entitlement claims than the 15–19 age group (χ2 = 125, df = 1). Nearly 15% of total MSC injury entitlement claims and 20% of total costs were recorded from participants 35 years or older. The 60–64 age group recorded 0.1% of total injury entitlement claims, 0.3% of total injury entitlement costs but had the highest mean injury entitlement claim cost of $19 392 (£7249) per claim. The most common age group for injury entitlement claims was the 25–29 age group for male and female rugby league participants (see fig 1).

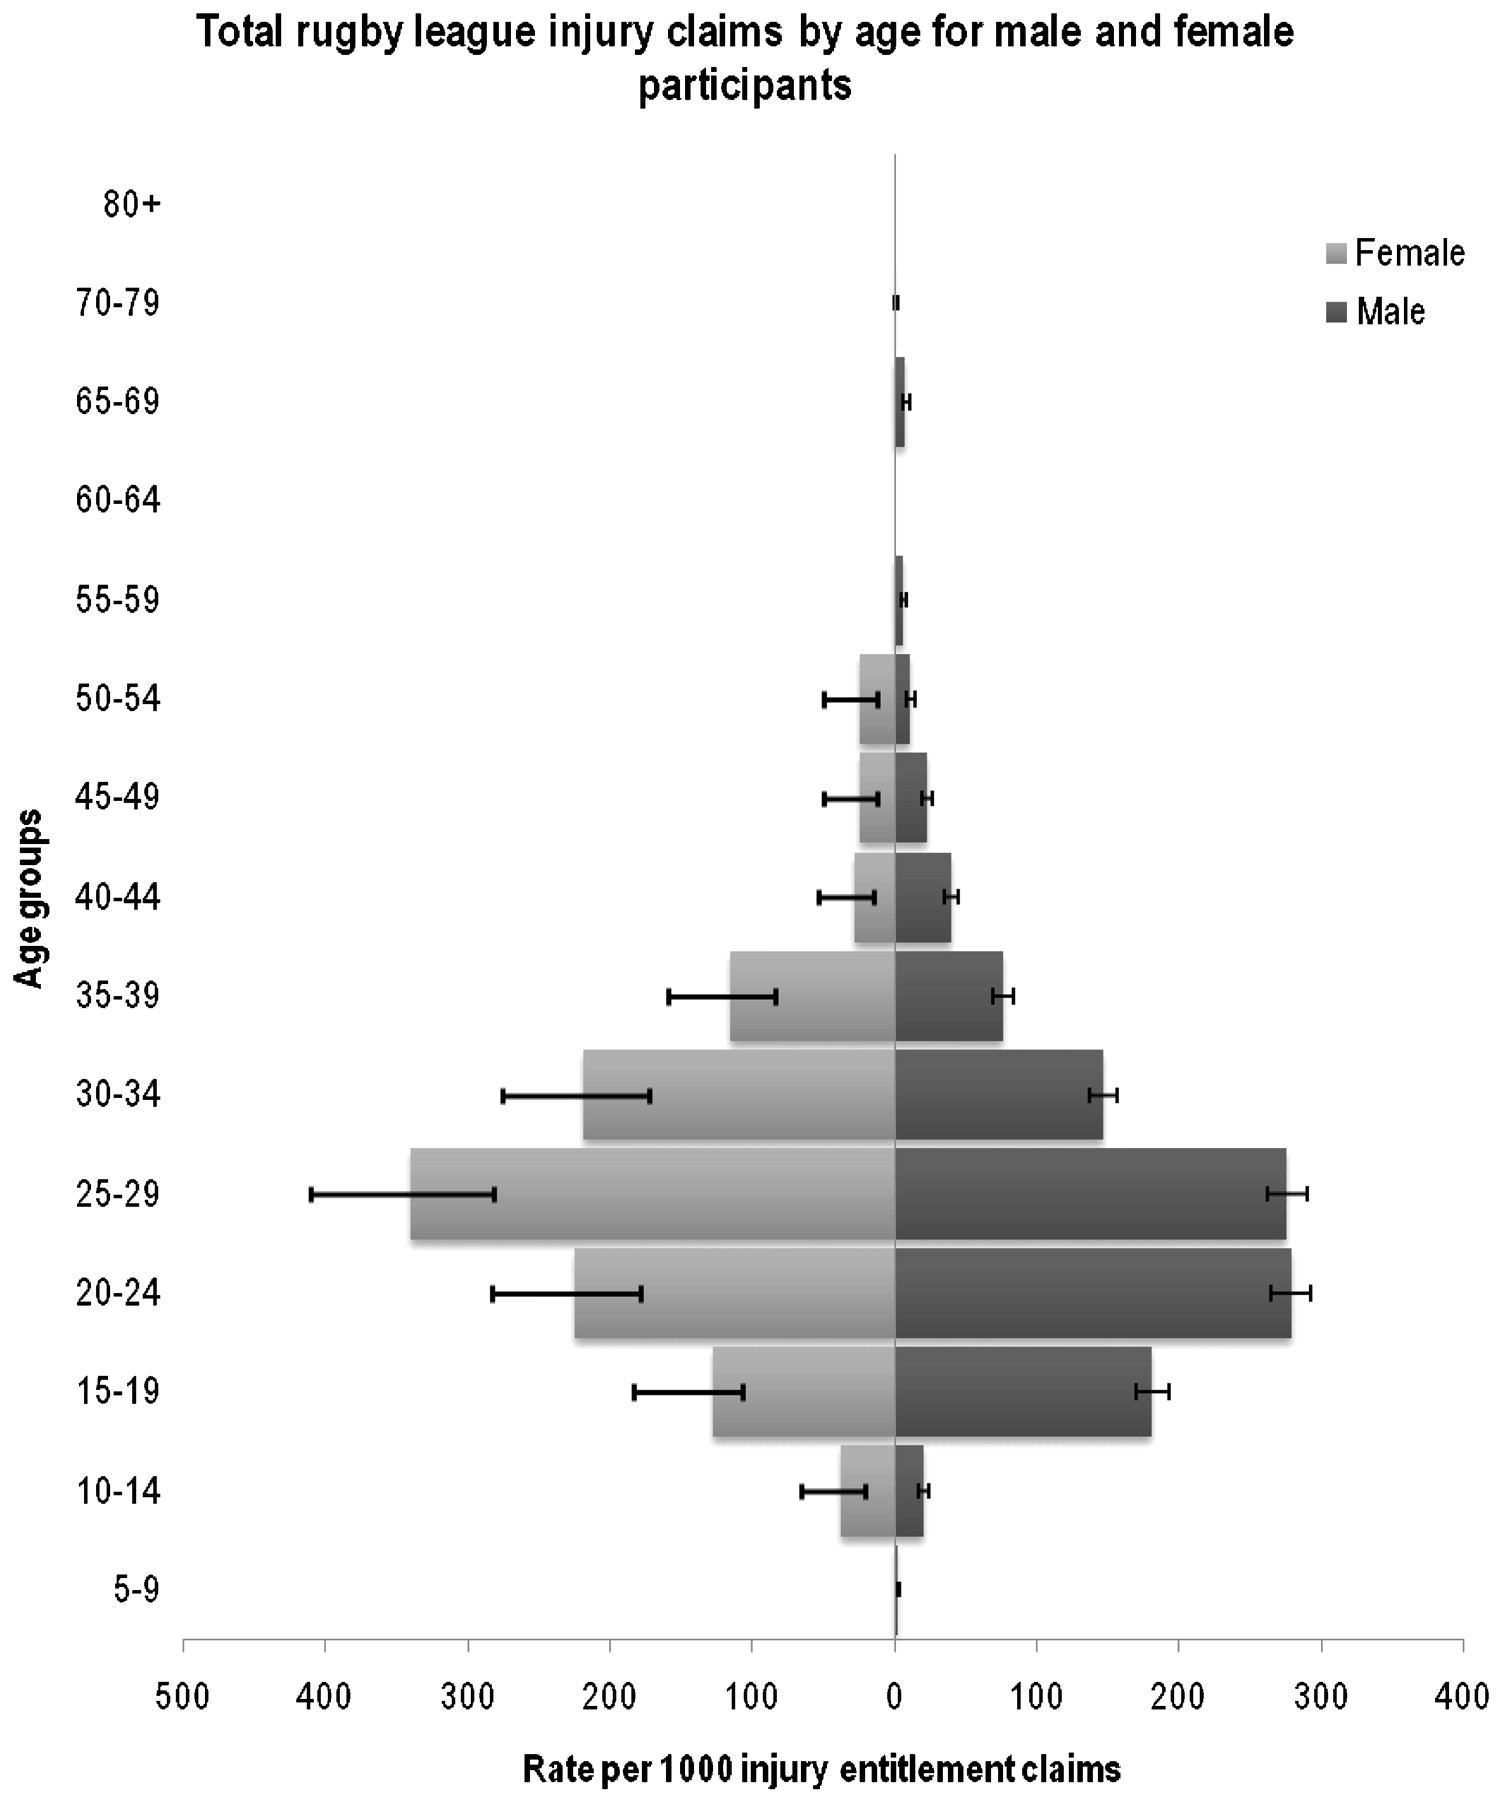
Incidence of rugby league injury entitlement claims with 95% CIs for men and women: 1999–2007.
Total injury rate per 1000 entitlement claims with 95% CIs and percentage of total claims and differences per year by age from 1999 to 2007
Discussion
This study identified the number of injury entitlement claims lodged and the associated costs of the injuries that have occurred from participation in rugby league activities in New Zealand over an 8-year period.
The only recording mechanism for rugby league injuries in New Zealand is through the ACC earnings-related compensations claims files that are lodged when an injury is seen by a healthcare provider in New Zealand. The statistics gathered through the use of this system should not be seen as being reflective of the total incidence of injuries from rugby league participation in New Zealand.19 The results could be biased as they exclude rugby league participants that do not make injury entitlement claims for more minor injuries.19 However, these results do highlight the number of injuries over an 8-year recording period severe enough to require medical reporting. As there were no training or match related data, comparisons between costs of injury entitlement claims and training and match exposure time could not be undertaken. There was no indication as to whether the injury claims recorded were for new, recurrent or exacerbation of a previous injury. As can be seen the mean cost per claim of $7206 (£2678) was greater than the mean (£467 ($1257)), median direct (£28 ($76))13 or median indirect (£77 ($207))13 costs per playing injury previously reported. This difference may be reflective of the limitations of previous studies identified by Gabbett13 in the use of retrospective questionnaires,17 player recall and small sample size.13
When comparing injury entitlement claims and costs for two time periods (2002–2003 and 2006–2007), there are several possible influences for the increase in injury claim incidence. The introduction of the Alliance competitions in 2004 may have resulted in an increase in matches, which would increase exposure and could account for the increase in the number of injuries recorded. Another influence could be the cancellation of the New Zealand Rugby League Academy courses in 2003 which may have seen less people trained and qualified in roles such as coach, manager and trainer. This may have resulted in less primary injury care at the sports fields from sports trainers resulting in more people presenting for treatment to medical providers who would claim to the ACC for treatment costs provided. More research is required to fully establish the reasons why the injury entitlement claims and associated costs resulting from rugby league increased annually for the 2002–2003 to 2006–2007 reporting periods.
The incidence of injuries from rugby league participation has been reported using either a total34 (transient and missed match injuries) or a missed match920 injury definition. Injury incidence has ranged from 5821 to 8234 per 1000 playing hours in published studies using a total injury definition, compared to injury incidence of 1.422 to 19723 per 1000 playing hours in published studies using a missed match injury definition. These differences reflect between 5.2%24 to 31.7%25 of the total injury incidence reported in published studies. As 13.9% of the total injury entitlement claims recorded in this study were for MSCs, this may be reflective of the cost of missed match and/or training injuries as a result of rugby league participation. When comparing the total number (42 754) and cost ($48 704 704 (£18 204 395)) of rugby league injury entitlement claims, the mean total yearly injury entitlement costs of $1473 (±$681) (£551 (±£255)) was similar to previously reported mean costs,13 but higher than the median (direct and indirect) costs13 per playing injury. When comparing the non-MSCs for the same reporting period (36 811; $5 882 686 (£2 198 104)), the mean cost per non-MSC claim was $161 ($34) (£60 (£13)) which was similar to the previously reported median direct and indirect costs.13 This suggests that there are more costs incurred per playing injury than previously identified, or that the costs of treatment in New Zealand are higher than previously reported.13
Although the region of Auckland recorded 38.7% of the total MSC injury entitlement claims and 37.8% of the total MSC costs, the mean cost per MSC injury entitlement claim was less than Otago and Canterbury. Despite this, Otago recorded 2.2% of total MSC injury entitlement claims and 3.5% of total MSC costs. The high cost for Otago and Canterbury either reflects the different treatment costs for the district health boards, or that the injuries are more severe in Otago and Canterbury. Further indicators of the severity of injuries are required apart from our cost-method for approximation of injury severity.
Recent studies on rugby league match3 and training26 injuries identified that a team in Otago recorded more total3 and missed match3 injuries and more training total26 and missed training26 injuries than most,52427 but not all4 published studies on rugby league injuries. Recent research28 has identified that the injury risk rate more than doubled between New Zealand division 1 and division 2 teams for total injuries and tripled for missed match injuries. The increased injury rate was similar for Wellington (division 1) and Otago (division 2) when comparing the percentage of MSC injury entitlement claims (division 1: 7.4%; division 2: 2.2%) and total costs (division 1: 9.0%; division 2: 3.5%) for this study. The percentage of MSC injury entitlement claims for the division 1 region was more than triple that of the division 2 region and the costs more than double. The differences in costs may be reflective of the lower medical support provided at the sideline in the division 2 competition when compared with a division 1 competition while the injuries recorded may be reflective of the different participation standards.
As has been reported in previous studies on rugby league injuries in Australia202930 and New Zealand,22331 the most commonly reported injury region was to the lower limbs. This was similar for lower limb injury MSC injury entitlement claims (42.4%) and costs (31.5%) while the head and neck recorded only 9.2% of claims but 21.8% of costs. The finding that the knee was the most common injury site conflicts with some,1931 but not all,22332 previous studies on rugby league injuries. The face was reportedly the most common injury claim site in a 1992 New Zealand study using ACC compensation claims19 while the ankle was identified as the most common injury site in another early study on New Zealand rugby league injuries.33 More recent New Zealand based studies on rugby league injuries identified the shoulder was the most common injury site recorded.223 This study found that the knee was the most commonly recorded injury site and the highest single injury cost site. The changes in injury site may be reflective of the changes observed in tackling style where traditionally participants tackled low on the body. More recently coaches have been teaching a higher body tackle technique in order to decrease second phase play, such as offloading of the ball and quick play-the-ball, in an attempt to slow down the opposition team’s attacking options. Unfortunately, no information pertaining as to how the injury occurred (ie, tackling, being tackled, collision, running, etc.) is gathered through the ACC data collection system. This is a limitation to this study and further longitudinal research is needed to fully explore if there is any relationship between tackle techniques and the incidence of injuries to the shoulder or head. When comparing mean costs per injury entitlement claim, the mean cost per MSC knee injury entitlement claim was less than the upper and lower arm, head (except face) and neck, back of head. The associated cost of head and neck related injuries highlights the need for more injury prevention programs targeting the head and neck area from the impact forces of collision sports.
Similar to the study conducted by Gabbett,13 the majority of injuries recorded were musculoskeletal in nature. This is similar with all studies conducted on rugby league injuries.34 Soft tissue injuries (sprains, strains, contusions and haematomas) and fracture/dislocations accounted for 91.5% of the total MSC rugby league injury entitlement claims and 80% of the total costs. This is reflective of the nature of rugby league where tackling, being tackled, acceleration, deceleration and change of direction are key components of rugby league at all levels of participation.13 Although soft tissue injuries are the most common they are also easily provided for when an injury occurs. Reduction of swelling through the use of the rest, ice, compression, elevation (RICE) protocol can assist in the reduction of pain and injury severity.35 Injury prevention programs promoting the RICE protocol could be routinely implemented to reduce the severity of soft tissue injuries that occur from rugby league participation.
Of concern was the cost of concussions over the study period. Although only accounting for 1.8% of the total MSC injury entitlement claims, concussions accounted for 6.3% of the total MSC costs and had the highest mean cost per injury type. Concussions have been reported to occur in 40% of all illegal tackles36 with one study33 reporting that all concussions recorded occurred in the tackle. Injury prevention strategies aimed at decreasing concussion in rugby league should include defensive drills,13 tackle technique training.1322 Further research is required on tackle direction, type and sites of contact;37 player fatigue38 and coach education programmes.39
Previous rugby league injury studies,122224 have reported that the incidence of injury increased as the participation age increased. Raftery et al22 identified that there was a sudden change in injury rate at the 11–12 age group, which may have been a result of an increase in participant numbers. The effect of increased participant numbers may also be an explanation for the results of our study. This increase in injury can also be seen at the 10–14 and 15–19 age groups in this study. This may be due to the changes of opportunities and exposure to rugby league in New Zealand with the introduction of the professional club, the New Zealand Warriors, encouraging more young players to participate. The increase in the number of Auckland-based rugby league competitions would account for the higher injury claim rate when compared with the other districts. It is unfortunate that the different participation levels in the districts are not readily available with which to compare the ACC injury data.
Masters rugby league is a recently participated competition for players over the age of 35 years old. Unfortunately no published studies have been conducted on this level of participation. This study identified that 14.9% of total MSC injury entitlement claims and 20.2% of total costs were recorded from participants aged over 35 years. The top four mean cost per MSC injury entitlement claims were recorded in age groups that would primarily participate in the Masters level of competitions. Research into this level of participation is warranted to identify the risks and injury incidence that occur in Masters rugby league.
Conclusions
This study explored the injury entitlement rate, costs, site, type, geographic district and age of injured participants in rugby league in New Zealand. While this is important in understanding what costs are incurred and what injuries were sustained across injury sites, injury types, age categories and regions in the country over a period of years, the data do not present: (1) how the injuries occurred, (2) what participation level the injuries occurred in, (3) whether the injuries occurred as a result of match or training activities, or (4) at what stage of the match the injuries occurred. Further longitudinal epidemiological studies with specific details on injury mechanisms and participation data are warranted to further explore the incidence of injury that occur from rugby league participation in New Zealand.
What is already known on this topic
Injuries that occur from participation in rugby league activities have associated long-term job limitations, medical costs and loss of income.
Musculoskeletal injuries are common in rugby league activities.
What this study adds
This study provides information on the costs, site and number of rugby league related activity injuries in New Zealand over an 8-year period.
The average cost per ACC moderate to serious claim for a rugby league injury is higher than previously reported.
The head and neck body region recorded the highest mean cost per injury claim.
REFERENCES
Footnotes
Competing interests None.
Ethics approval Ethics approval was obtained from the Auckland University of Technology ethics committee.
Provenance and Peer review Not commissioned; externally peer reviewed.