Article Text

Abstract
Patellar tendinopathy (PT) is an injury with a high prevalence in sports. Knowledge of risk factors is essential for developing preventive measures and rehabilitation programmes. However, risk factors associated with PT have not yet been systematically studied. This review was undertaken to identify risk factors associated with PT. The literature was systematically searched to identify articles that investigated risk factors for PT. There was no strong or moderate evidence that any investigated risk factor was associated with PT. For nine risk factors there was some evidence: weight, body mass index, waist-to-hip ratio, leg-length difference, arch height of the foot, quadriceps flexibility, hamstring flexibility, quadriceps strength and vertical jump performance. Based on the present evidence, reducing body weight, increasing upper-leg flexibility and quadriceps strength and the use of orthotics may be beneficial treatment options. However, it should be stressed that the evidence for the nine identified risk factors was only limited. Therefore, there is a clear need for high-quality studies in order to identify the exact risk factors associated with PT.
Statistics from Altmetric.com
Patellar tendinopathy (PT), or ‘jumper's knee’, is an injury that has a high prevalence in sports, especially those involving jumping, with reported prevalences of up to 45% and 32% in elite volleyball and basketball players, respectively.1 It is a painful chronic injury of the patellar tendon that interferes with many athletes' sports career and could even be the primary cause of ending it.2 Because the successful treatment of PT remains challenging, prevention is of the utmost importance. Knowledge of risk factors is essential for developing preventive measures.3 However, factors associated with this injury have not yet been studied in a systematic way. The aim of this study was thus to review the literature and to identify risk factors associated with PT.
Methods
Search strategy and inclusion criteria
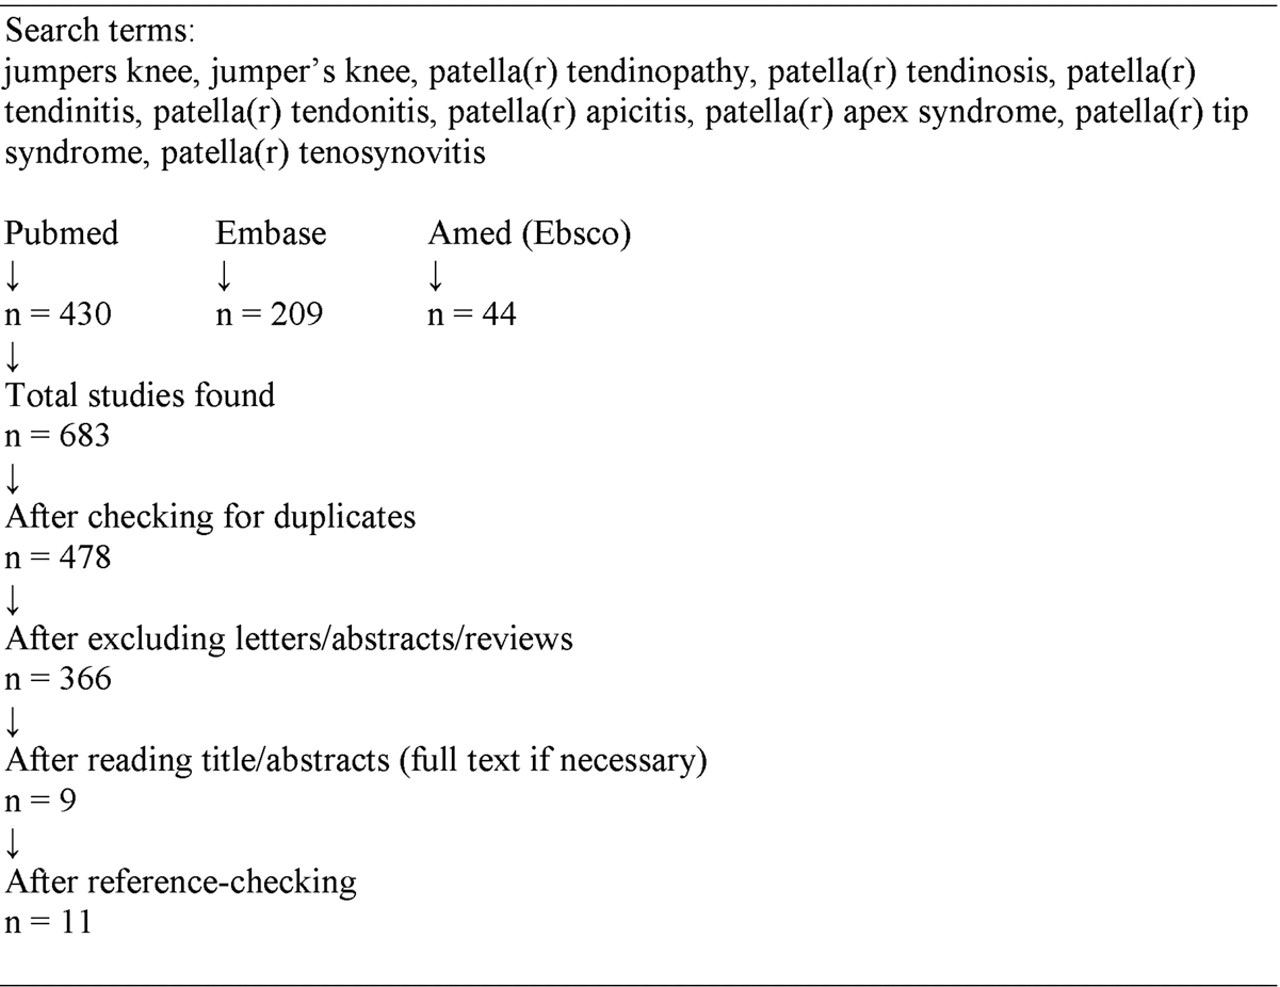
The Cochrane and MEDLINE databases were searched, revealing no systematic reviews about factors associated with PT. A search of the Pubmed, EMBASE and AMED databases was conducted to identify studies that met the inclusion criteria. The search was carried out from the earliest date to August 2010 using the following keywords (MeSH and/or text words): jumpers knee, jumper's knee, patella(r) tendinopathy, patella(r) tendinosis, patella(r) tendinitis, patella(r) tendonitis, patella(r) apicitis, patella(r) apex syndrome, patella(r) tip syndrome, patella(r) tenosynovitis and plural forms. The search was restricted to articles in English. Abstracts, letters and reviews were excluded.
What is already known on this topic
Patellar tendinopathy is a chronic condition that has a high prevalence among jumping athletes and often infl uences an athlete's career negatively. Successful treatment of patellar tendinopathy remains challenging. A large number of risk factors have been linked to patellar tendinopathy.
What this study adds
This study is the first to examine the literature concerning risk factors for patellar tendinopathy systematically. Identifying risk factors in this way can help prevention and rehabilitation.
Studies were included in the systematic review if they contained: empirical research that investigated factors associated with PT and a comparison between a group of patients and a group of controls. Studies focusing solely on biomechanics and radiology/ultrasonography were excluded. Of the studies included, factors that were measured radiographically or ultrasonographically were not taken into account. Three authors (HvdW, MvA and JZ) independently screened titles and/or abstracts of the studies retrieved by the search strategy above. When no abstract was available, or when it was not clear if the study should be included, full-text articles were retrieved in order to determine inclusion or exclusion. Reference lists of included or other relevant articles (ie, recent reviews) were checked for additional references.
Data extraction
Data on study population, study design, groups, diagnosis criteria and investigated factors were extracted and summarised from all the included studies. Investigated factors were divided into four categories: demographics; anthropometrics; sports-related factors and strength/flexibility.
Methodological quality assessment
Two reviewers (SR and IvdA) assessed the methodological quality of the studies by means of a methodological quality assessment list developed and used by Bongers et al,4 which is based on a list developed by van der Windt et al.5 The list was adapted slightly to make it specific for PT, and contains items on information and validity and/or precision in five categories: study objective; study population; outcome measurements; assessment of the outcome and analysis and data presentation. Separate quality assessment lists were constructed for cross-sectional, case–control and prospective cohort studies. The items of the adapted methodological quality assessment list are presented in table 1. Every item was scored as either ‘positive’ (‘+’ for the item being met) or ‘negative’ (‘−’ for the item not being met) by the two reviewers independently. When it was unclear whether a study did or did not meet an item, or if no clear information regarding the item was stated, the item was scored ‘negative’ (−). Results of these two quality assessments were compared, and any disagreement concerning an item was resolved in a consensus meeting. The total quality score of each study was calculated by counting the number of items that were scored positive on the validity/precision items (items 3–16).
Checklist for the assessment of methodological quality of cross-sectional studies, case–control studies and prospective cohort studies
Strength-of-evidence assessment
Assessment of the strength of evidence for investigated factors was based on a method used by Ariëns et al.6 Risk factors were classified into four levels of evidence:
▶ Strong evidence: consistent findings (which implies that at least 75% of the studies investigating a certain factor had to report an association) in multiple cohort and/or case–control studies with a high methodological quality score (above 50 on the methodological quality assessment list).
▶ Moderate evidence: consistent findings in multiple cohort and/or case–control studies, only one of which is a high-score study.
▶ Some evidence: findings of one cohort study or case–control study, or consistent findings in multiple cross-sectional studies, at least one of which is a high-score study.
▶ Inconclusive evidence: concerns all other cases, including inconsistent findings.
Results
Identification of studies
No systematic reviews or randomised controlled trials could be found on this subject.
After checking for doubles the search of the computerised databases identified a total of 478 studies (figure 1). After excluding letters, abstracts and reviews, 366 studies were considered in the selection procedure. Based on the title, abstract and/or full papers, nine studies were included in the review.7– 15 After reference checking two additional studies were included.16 17

Literature search
Description of studies
The 11 included studies consisted of six cross-sectional,10– 13 16 17 three case–control7 14 15 and one prospective cohort study.9 One study consisted of two parts, the first part with a cross-sectional design and the second with a case–control design.8 In seven of the 11 studies the subjects were volleyball or basketball players, with Malliaras et al13 defining subjects as the number of tendons.10,–,12 17 One study used runners as subjects,15 two used athletes of different sports7 14 and one used students following a physical education programme as subjects.9 Table 2 shows the study characteristics of the included studies.
Characteristics of included studies
Quality assessment
The scores of the studies on the methodological quality assessment list are presented in table 3. The average score was 41%.
Scores on the items of the quality assessment list (see table 1), with the total quality score for all positive validity/precision items (3–16) and the percentage of the maximum attainable score (%)
Risk factors
Assessment of the strength of evidence is shown in table 4. Risk factors reported by a single study and not associated with PT in that study are not shown in this table.
Strength of evidence for relationship between associated factors and patellar tendinopathy
Demographics
None of the demographic variables were a risk factor for PT according to the defined strength-of-evidence criteria. There was no association between age and PT in five studies that considered this variable.8,–,10 12 16 Two studies assessed the link between gender and PT, and neither found differences between men and women in the risk of PT.14 16 Gaida et al12 found no differences in menstrual history (age of menarche, number of cycles in the past 12 months and use of oral contraceptives) between women with and without PT.
Anthropometrics
There was some evidence that weight, body mass index (BMI), waist-to-hip ratio, leg-length difference and arch height of the foot are risk factors for PT. None of the six studies that examined height found an association between height and PT.8– 12 17 Three out of eight studies found an association between weight and PT.10 14 17 In those studies subjects with PT were on average heavier than subjects without PT. The five other studies found no association between weight and PT.7,–,9 11 12 Crossley et al14 found that a higher BMI was associated with PT, a finding that concurs with a study by Malliaras et al,13 who also found an association between a higher BMI and PT, albeit only in men. Another study, which calculated a height-to-weight ratio, found no association between this ratio and PT.7 Waist girth and hip girth were associated with PT in men in one study (hip girth only in men with bilateral PT),17 but not in another study that only included women.12 A higher waist-to-hip ratio, the combination of these two variables, was associated with PT in women with unilateral PT12 and in men with bilateral PT.17 No difference was found in skinfolds between subjects with and without PT.11 Several studies investigated the association between leg-length difference and PT. Crossley et al14 found the leg-length difference to be greater in subjects with PT compared with controls, the symptomatic leg on average being the longer one. Kujala et al7 also reported a larger leg-length difference in subjects with PT. The study of Witvrouw et al,9 however, found no association with leg-length difference. A longer tibia length relative to stature was found by Gaida et al12 in subjects with unilateral PT. Kujala et al7 found no difference between controls and subjects with PT in Q-angle displacement during knee flexion. In another study there was no difference in Q-angle at rest between these two groups either, and no difference in the medial tibial intercondylar distance.9 Arch height of the foot differed between subjects with and without PT.14 Subjects with PT had a lower foot arch height. One study that investigated the arm span to height ratio found no association between this ratio and PT.11
Sports-related factors
None of the sports-related factors were identified as risk factors for PT. Two studies found no difference in the number of years playing between volleyball players with and without symptoms.10 13 Three studies found the amount of training and playing to be a significant risk factor for PT.8 12 16 Three other studies found no association between the amount of training and competition and PT in volleyball players10 13 and in runners.15 Strength training was not associated with PT in two studies,8 16 whereas in another study10 (in which more strength training was associated with PT) it was. Two studies found no association between the amount of jump training and PT.8 10 Ferretti et al16 showed that the incidence of PT is higher in players who play on concrete compared with those who play on parquet or linoleum. Kraus et al15 found no difference in the percentages of running on hard surfaces between injured subjects and healthy controls. No differences were found for warm-up time and stretching time,8 or for stretching time during warm-up and after training.10
Strength/flexibility
Of the strength/flexibility variables, quadriceps flexibility, hamstring flexibility, quadriceps strength and vertical jump performance were factors for which there was some evidence according to the defined strength-of-evidence criteria. Witvrouw et al9 found differences in flexibility between subjects with PT and controls. Controls had a higher quadriceps and hamstring flexibility compared with subjects with PT. No differences were found in hamstring flexibility in another study.14 Four studies looked at differences in sit-and-reach scores, which is a measure of hamstring and low back flexibility. Cook et al11 found differences in sit-and-reach scores between subjects with unilateral PT and controls in women and between subjects with bilateral PT and controls in men. These groups had lower sit-and-reach scores than controls. Gaida et al,12 Malliaras et al13 and Crossley et al14 found no differences in scores on a sit-and-reach test. The ankle dorsiflexion range was found to be smaller in subjects with PT in one study,13 but not in another.14 Crossley et al14 reported that normalised peak knee extensor moment was lower in subjects with unilateral PT compared with controls, but not for bilateral PT.14 Other studies found no differences in knee flexion and extension torques,7 concentric and eccentric strength,12 15 hamstring and quadriceps strength,9 or ankle plantar flexion strength13 between groups. No differences between groups were found in calf endurance,14 speed, endurance and agility11 and the hamstring–quadriceps quotient, which describes the imbalance between knee flexors and extensors.15 Cook et al11 found that women with PT jumped higher than women without PT, but they found no differences in men. A better performance on jump tasks of subjects with PT was also shown by other studies.8 10 Gaida et al12 and Malliaras et al,13 however, found no differences in jump height. Crossley et al14 found no differences on a speed hop test and a distance hop test.
Discussion
The aim of this study was to review the literature concerning risk factors associated with PT. The number of included studies was low and the studies were heterogeneous in investigated factors: over 40 potential risk factors were investigated, therefore conducting a meta-analysis was impossible.
Although a number of risk factors are considered to be related to PT, no strong or moderate evidence could be obtained for any of the investigated factors. For nine factors there was some evidence for an association with PT: weight; BMI; waist-to-hip ratio; leg-length difference; arch height of the foot; quadriceps flexibility; hamstring flexibility; quadriceps strength and vertical jump performance. For all the other investigated factors the evidence was inconclusive.
Although the exact pathophysiology of tendinopathy is unclear, several theories have been developed,18 the main one being a mechanical theory. According to this theory, because of a failed healing process, micro injuries in the tendon resulting from overload can eventually lead to matrix and cell changes as well as altered mechanical properties of the tendon. All nine identified risk factors influence the loading of the patellar tendon in some way, and could be explained within the framework of a mechanical pathophysiological theory.
The apparent association of weight and BMI with PT can be explained by a higher body mass theoretically leading to a higher loading of the patellar tendon, which increases changes of overload. A higher waist-to-hip ratio was also associated with PT and indicates a higher abdominal fat distribution compared with gluteofemoral fat distribution. The effect of a higher waist-to-hip ratio may be purely mechanical, as in the case of weight. However, the effect may also be non-mechanical. Fat distribution is controlled by a number of hormones (such as oestrogen and progesterone). Because of the higher waist-to-hip ratio in subjects with PT, it has been suggested that hormones playing a role in fat distribution may also play a role in tendinopathy.12 17 Another non-mechanical explanation for the higher waist-to-hip ratio in subjects with PT is that an increase of free fatty acids and pro-inflammatory cytokines resulting from elevated abdominal adiposity may negatively influence tendon health.17 19
The possible association between leg-length difference and PT may be caused by the fact that the longer leg is the preferred take-off leg in jumping more often, as suggested by Kujala et al.7 Crossley et al14 state that the leg-length differences found in their study are too small to be considered functionally important. The differences found by Kujala et al7 are even smaller. Therefore, although there is some evidence that leg-length difference is related to PT, whether this link is clinically relevant remains a question.
A lower arch height of the foot in subjects with PT concurs with a study by Williams et al,20 who found low-arched runners were more likely to develop knee and soft tissue injuries than high-arched runners, who were more likely to develop ankle and bone injuries. They found a greater peak knee flexion angle in runners with a low foot arch, and postulate that greater quadriceps muscle force is needed to prevent further knee flexion. One can hypothesise that something similar happens during jumping.
Quadriceps and hamstring flexibility may be associated with PT because decreased flexibility increases tendon strain during joint movements, and may therefore lead to tendon overload,9 which is in line with the mechanical theory.
Lower quadriceps strength may be caused by atrophy as a result of inactivity brought about by PT, yet it may also be the cause of PT. Longitudinal studies are needed to determine the causal relationship.
There was some evidence that vertical jump performance was better in subjects with PT, which contrasts with the mentioned lower quadriceps strength. This may have two reasons. First, although jump performance and quadriceps strength are related factors, there is more to jump performance than quadriceps strength alone. Second, for both factors only some evidence for an association with PT exists, leaving the possibility of an association for only one of those two factors. Further research into these factors is required.
There may be several reasons for not finding strong or moderate evidence for any of the investigated factors. First, the number of studies was low, as was their overall methodological quality. Furthermore, and this may be related to the former, results were often conflicting. Also, most studies used univariate statistical techniques to test for differences between groups, often even without correction for multiple testing. Using more sophisticated statistical procedures such as multiple logistic regression helps to identify risk factors while accounting for other pertinent variables. Finally, PT is likely to have a multifactorial aetiology, therefore identifying risk factors may be more difficult.
The nine identified risk factors could potentially be relevant for prevention and rehabilitation. With the present evidence, reducing weight (which is associated with BMI and waist-to-hip ratio) may be a beneficial intervention in the case of overweight. According to Kountouris and Cook,21 addressing dysfunctions in the muscle/tendon complex and in the pelvic and lower limb kinetic chain are an important part of tendinopathy rehabilitation; the present study suggests that upper-leg flexibility and quadriceps strength may be important factors to focus on in such an approach. They also suggest that foot arch height may be addressed by orthotics to influence the lower-limb absorbing function; this may also be an option for leg-length differences. However, when applying the present findings for prevention and rehabilitation purposes one should bear in mind that the evidence for the nine identified risk factors was limited.
A limitation of the review is that when studies were assessed for strength of evidence, results were not split for each subgroup. A positive association for a subgroup (eg, subjects with unilateral PT) was taken as a positive association for the whole study. This was done because evidence for most investigated factors was scarce and a splitting into subgroups makes it even harder to identify risk factors. The evidence for differences between men and women and between bilateral and unilateral tendinopathy is also limited.
Further research into risk factors for PT is required, as no strong or moderate evidence was found for an association between PT and any of the investigated factors. Future research should at least include the nine variables for which some evidence was found. Ideally, these studies should be prospective and use multivariate statistical techniques. Most studies in this review used elite-level athletes, therefore future research should also include recreational athletes to make the results more generalisable.
Conclusion
We studied risk factors for PT that have been described in the literature. The number and overall methodological quality of the included studies was low. The aetiology of PT seems to be multifactorial. Nine factors—weight, BMI, waist-to-hip ratio, leg-length difference, arch height of the foot, quadriceps flexibility, hamstring flexibility, quadriceps strength and vertical jump performance—were identified as possible risk factors for PT, although there was only some evidence. There is a clear need for high-quality studies that are prospective and longitudinal and that use more sophisticated statistical methods in order to identify the exact risk factors associated with PT.
References
Footnotes
-
Competing interests None.
-
Provenance and peer review Not commissioned; not externally peer reviewed.