Article Text

Abstract
Objective To study whether field performance tests can make a valid distinction between non-functionally overreaching (NFO) athletes and control athletes.
Design Monthly field performance tests were used to determine a performance decrement (PD) throughout a season. Athletes with a minimum of 1 month PD were compared with control athletes without a PD on mood characteristics and resting levels of stress hormones.
Setting Sporting field and sports medical laboratory.
Participants 129 young elite athletes, 77 soccer players and 52 middle-long distance runners were followed prospectively during the 2006–2007 season. Fifteen of them were invited to the laboratory. Eight athletes showed a performance decrease lasting longer than 1 month, and seven athletes without a performance decrease acted as their controls.
Main outcome measures Performance changes over time were measured using field tests. Profile of Mood States and resting levels of adrenocorticotrophic hormone (ACTH) and cortisol in blood were measured in the laboratory.
Results PD athletes showed several symptoms typical of the non-functional state of overreaching (OR). The PD group scored higher on depression and anger than controls. They also showed a specific pattern of correlations between negative mood subscales (tension, fatigue and depression), which was absent in controls. ACTH levels at rest were similar, but lower cortisol levels in PD athletes pointed at a blunted cortisol response. Cortisol levels were decoupled from ACTH levels only in PD athletes.
Conclusions Implementing performance-related criteria in field tests can help coaches and sports physicians to distinguish NFO athletes from athletes with balanced workload and recovery.
Statistics from Altmetric.com
According to the consensus statement of the European College of Sport Science on the prevention, diagnosis and treatment of the overtraining syndrome (OTS,) a gold standard for diagnosis of this syndrome is still lacking.1 The statement characterises OTS as long-term performance decrease with a multifactorial aetiology in athletes. The statement comes with a checklist that provides a diagnosis per exclusionem. Similar to previous checklists,2 3 it helps physicians to determine whether or not athletes might suffer from OTS and exclude other possible causes of a longterm underperformance.
The European College of Sport Science statement defines the term ‘overtraining’ as a process of intensified training that may result in short-term or functional overreaching (FO), non-functionally overreaching (NFO) or OTS. The distinction between FO and NFO is based on the duration of the symptoms until performance returns to normal levels. Recovery to normal performances should incur within days to weeks in FO, whereas in NFO it may take several weeks to months. OTS will last several months or years. As a consequence, a follow-up of athletes is necessary to finalise the diagnosis per exclusionem.
The estimated incidence of OTS is low to moderate.4,–,6 Inducing OTS for research purposes is however ethically unacceptable for many reasons. Thus, many studies attempting to explore the early signs of the overtraining process rely on inducing a state of overreaching (OR) by means of short periods of intensified training. Such studies, however, rarely match the normal situation of athletes. In addition, many studies have been conducted without a proper indication of performance changes as an outcome.7 Cross-sectional studies focusing on the diagnostic parameters of OTS, generally include samples of athletes from sports medical clinics where athletes experiencing overtraining have a high representation.8,–,11 These studies do not reveal any information about the early development of overtraining because they focus on the end stages of the process. Longitudinal studies within sports environments to evaluate the onset of the overtraining process by monitoring training load and performances, combined with cross-sectional case-control studies to identify markers of overtraining, are scarce. Consequently, only experience-based, non-specific and open-ended advice to coaches can be provided by monitoring physical performances, mood, training load and diseases.1,–,3
Despite the process of intensified training, performance will only improve if both excessive overload and incomplete recovery are avoided. Within the process that initiates a general state of OR, athletes and coaches will most likely stress the importance of an unwanted transition from a state of FO into a state of NFO. The latter is characterised by performance decrements (PDs), and psychological and hormonal disturbances.1 7 Hypothalamic–pituitary–adrenal axis-related plasma levels of adrenocorticotrophic hormone (ACTH) and cortisol, as well as growth hormone levels, have been shown to be reduced in OR.12,–,15 Ronsen et al14 and Meeusen et al15 developed double maximal physical exercise tests that could differentiate between responses of these hormones in healthy and overtrained athletes. It would be of great help to sports physicians, coaches and athletes if a field monitor validated by these parameters could identify the onset of the overtraining process.
Although the time to recover from a performance drop is a key criterion to help distinguishing FO athletes from NFO athletes, the duration of this time frame is an element of constant debate.16 On the basis of the assumptions in the model introduced by Meeusen et al,1 we hypothesise that the transition from FO to NFO will take place if the underperformance period exceeds the duration of 1 month. Therefore, we tested cross-sectionally if such a PD in young elite athletes (PD athletes hereafter) marks the onset of additional symptoms typical to the non-functional state of OR, that is, deteriorated mood and altered hormone profiles.
Methods
Subjects
Of 77 young elite soccer players (mean age 16.5 years, range 15–18 years) and 52 young elite middle- and long-distance runners (mean age 17 years, range 16–21 years), 15 athletes (eight PD athletes and seven controls) were included in this study during the 2006–2007 season. Selection of these athletes during one competitive season took place on a monthly basis, using performance changes measured in sport-specific field tests. PD athletes were invited to the laboratory if they showed a persistent performance decrease lasting at least 1 month, that is, measured at two consecutive field tests. Control athletes were invited to the testing laboratory if they did not show a performance decrease for at least 1 month. The study was approved by the Dutch Central Committee on Research Ethics involving Human Subjects. All participants and both parents if participants were <18 years old provided written informed consent.
Field performance tests
Interval shuttle run test for soccer players
To determine performance in soccer players, a submaximal interval shuttle run test (ISRT) was used.17 18 During the entire season, submaximal intensity was set at 70% of the maximal number of runs achieved at the start of the season. An elevated heart rate response indicated a state of OR.3 19 During the outdoor ISRTs, players alternately ran for 30 s and walked for 15 s. Running speed increased from 10 km/h every 90 s up to 15 km/h depending on baseline maximal running performance. Heart rate (in beats per minute) was recorded at 5-s intervals (Polar, Kempele, Finland; Suunto, Vantaa, Finland). The tests were performed every month at the start of a training session as a substitute for the warm-up. Athletes with an elevated heart rate response of ≥5 bpm20 and a relative heart rate increase of at least 5% persisting for at least 1 month (and measured at consecutive field tests) were included as OR related3 19 performance decreased athletes (PD athletes).
Zoladz test for runners
The Zoladz test proved to be a reliable and valid method of measuring performance capacity in track and field.21 During the test, athletes ran for 6 min in four heart rate zones (zones 4, 3, 2 and 1 at, respectively, 20, 30, 40 and 50 bpm below maximal heart rate). Maximal heart rate was determined using an all-out 400-m run at the start of the season. Between the 6-min runs, subjects walked for 2 min. The total distance in each zone was measured;21 but for further analysis, the distance obtained in submaximal zone 3 was used. To include track and field PD athletes similar to the method used in soccer players, a runner’s performance had to drop a minimum of 5% at two consecutive (monthly) tests compared with a previous test.22
Profile of Mood States
Validity and reliability of a Dutch translation of the original 65-item, six subscales version of the Profile of Mood States (POMS) has been evaluated in a previous study.23 Participants respond on a five-point Likert scale ranging from 0 (not at all) to 4 (extremely). This validated version contains 32 items and five subscales: tension, depression, anger, fatigue and vigor. The five-factor model again showed to be adequate. In a second study, the one-factor model (Total Mood Score) was rejected.24 Hence, in this study, we used the shortened version of the POMS, consisting of five subscales and 32 items. The POMS was administered to subjects in the laboratory before lunch time (11:30–12:30).
Hormones
At least 2 h after a standardised meal (approximately 71% carbohydrate, 19% protein, 10% fat), which was planned between 11:00 and 12:00, blood samples were drawn under resting conditions in supine position from an antecubital vein in Dickinson vacutainer tubes (Becton Dickinson, Franklin Lakes, New Jersey, USA). SSTII tubes were used for cortisol, and K2E EDTA tubes for ACTH. Samples were immediately stored on ice and transported to the hospital for subsequent analysis. Plasma cortisol levels were determined by radioimmunoassay and plasma ACTH levels by chemiluminescence immunoassay.
Statistical analyses
Statistical analyses were performed with SPSS V.16 (SPSS Inc, Chicago, Illinois, USA). Differences in mood scores and hormone levels between PD and control athletes were tested using analysis of variance. Pearson’s correlation coefficients (R) were used to verify the coherence between the mood subscale scores and to test the linear relationship between ACTH and cortisol, that is, the coupling of ACTH to cortisol levels. Because of the small numbers of participants, non-parametric equivalents (Mann–Whitney U test and Spearman’s rank correlation (r)) were also applied. The significance level was set at p<0.05.
Results
Subjects and field performance
A total of eight PD athletes were invited to the laboratory: one long-distance runner and seven soccer players (mean (SD): age 16.9 (1.1) years, height 174.6 (6.5) cm, body weight 70.4 (6.4) kg). The control group consisted of seven athletes: four middle-long distance runners and three soccer players (mean (SD): age 18.7 (1.6) years, height 183.0 (9.4) cm, body weight 68.7 (6.5) kg). Controls were slightly, but significantly, older than PD athletes (Mann–Whitney U=8.5, p=0.023).
PD soccer players showed an average 6% increase of their submaximal heart rate response (10 bpm (SD 5)) during the ISRT, compared to their mean reference submaximal heart rate of 172 bpm. The PD long-distance runner was tested in heart rate zone 1 instead of zone 3 because of excessive fatigue. He showed an 8% performance decrease in zone 1 (1050 m at baseline and 970 m after two consecutive monthly tests) compared with a 3% increase in the control runners.
Mood states
The average subscale scores indicated an unfavourable mood state in PD athletes (table 1). The differences with controls were only significant for anger (F=12.8, df=14, p=0.00) and depression (F=3.0, df=14, p=0.05). This was confirmed non-parametrically (anger: Mann–Whitney U=5.5, p=0.01, Depression: Mann–Whitney U=10.5, p=0.04).
Mean scores and mean rank* scores of five mood subscales
The correlations between the five mood states in table 2 are specified by significance or borderline significance. As expected, fatigue and vigor were negatively associated in both groups. In the PD group, depression was associated with fatigue and tension. In addition, fatigue and tension correlated highly in the PD group. Among the controls, anger, but not depression, was associated with fatigue and tension. In contrast with the PD group, fatigue and tension did not correlate in the control group.
Pearson's correlation coefficient and Spearman's rank correlation* between Profile of Mood States scales in PD athletes† and control athletes‡
Hormones
Table 3 shows the hormone levels of the participants. No significant differences in ACTH levels between PD athletes and controls could be found. Only cortisol showed a significant difference between both groups (F=6.2, p=0.03), with lower values in the PD group. Non-parametrically tested, this difference was confirmed (Mann–Whitney U=7.5, p=0.01).
Mean levels of ACTH and cortisol (mean rank scores in brackets)
Relation between ACTH and cortisol
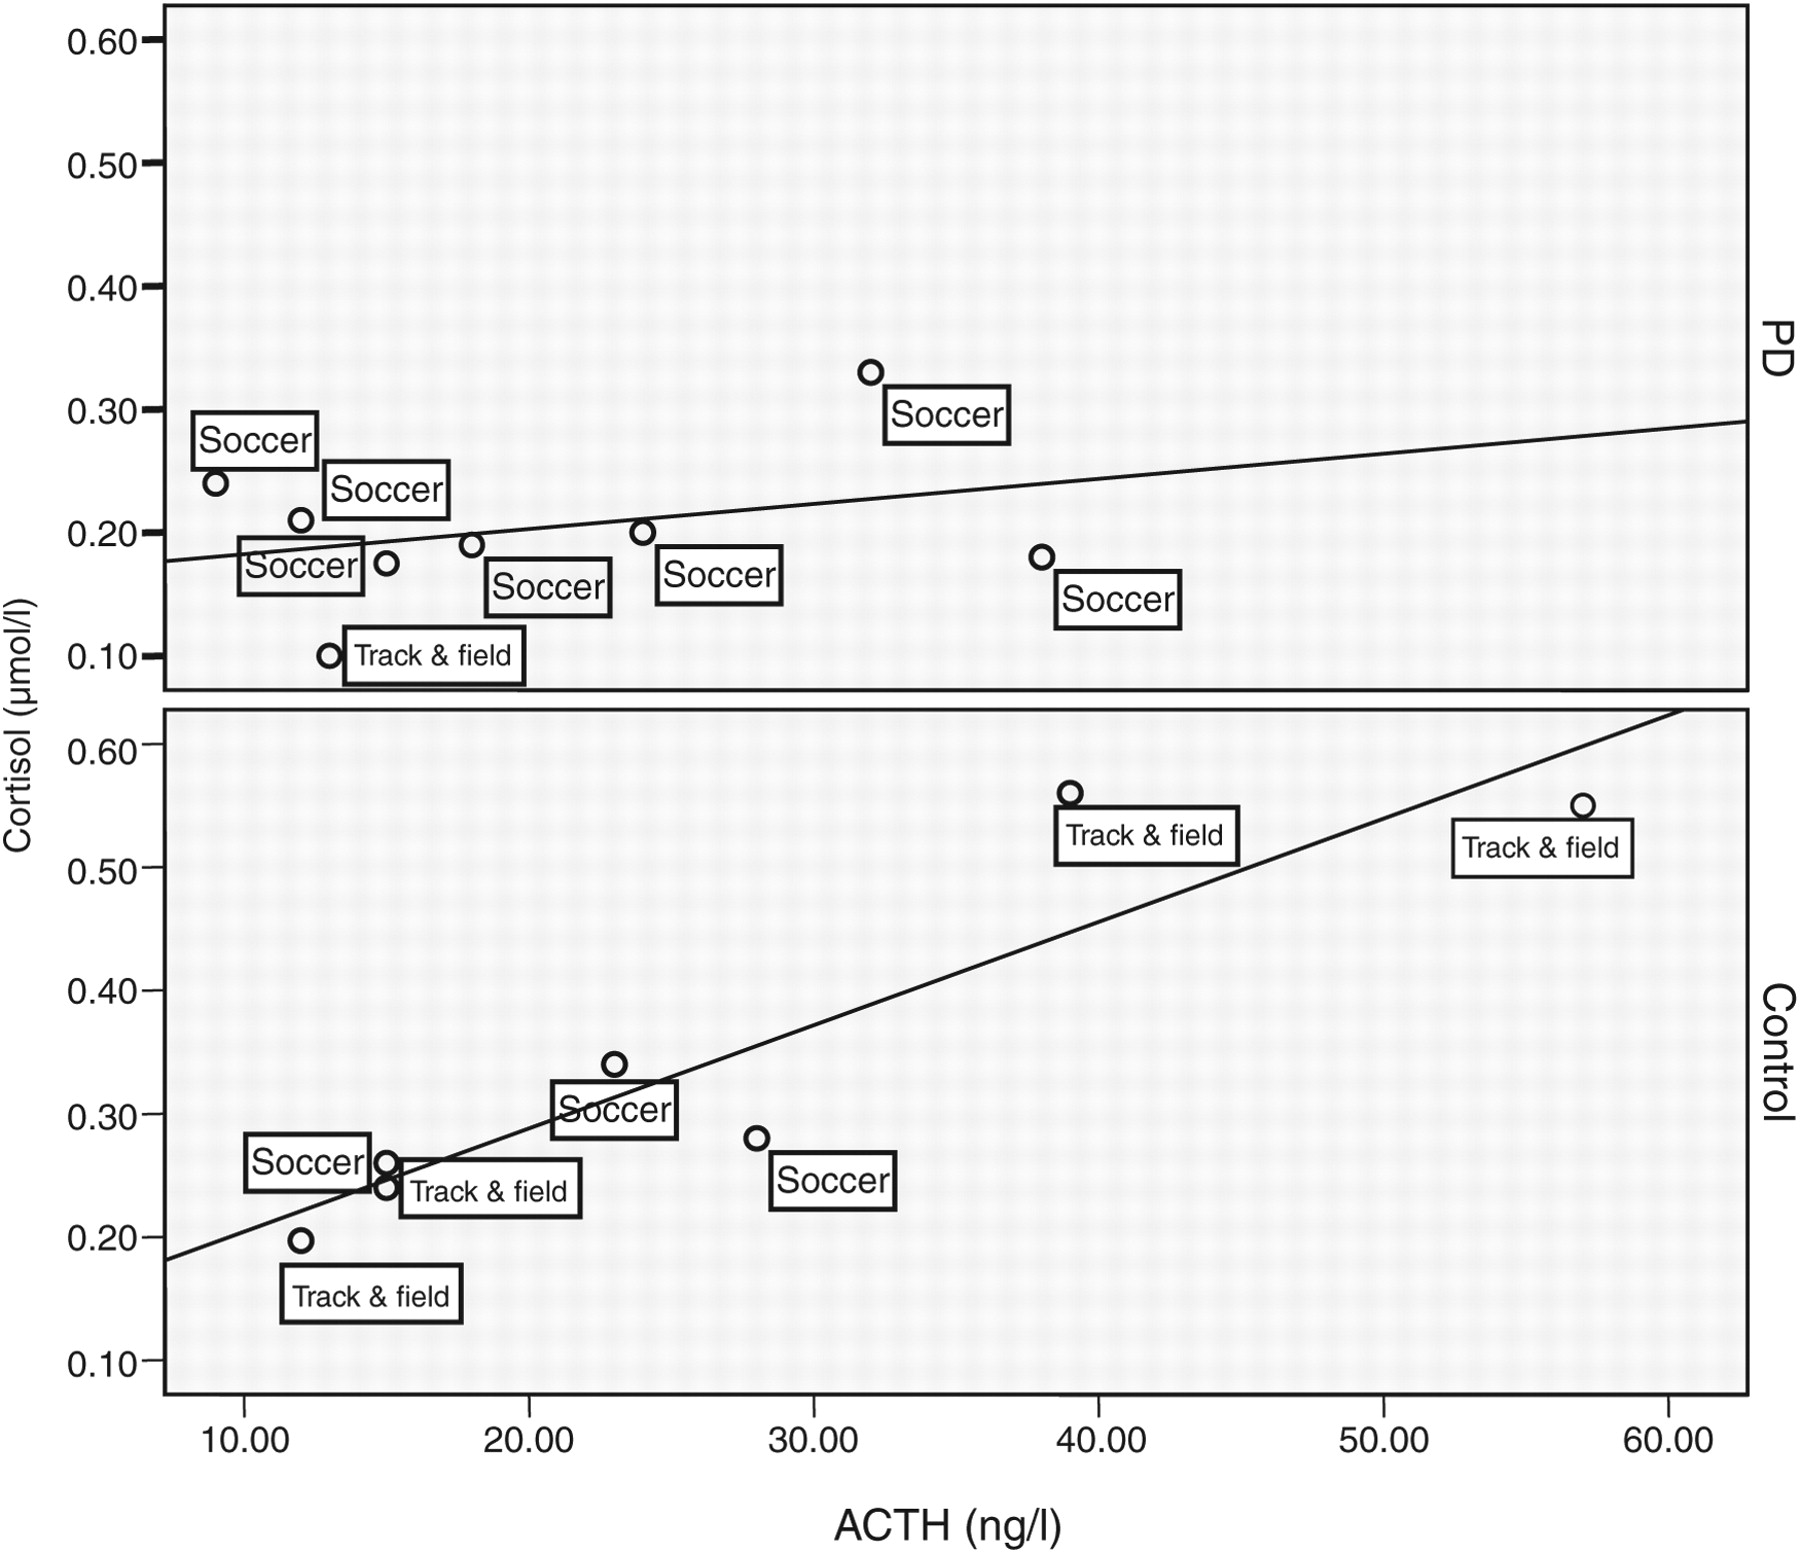
No significant linear relationship between ACTH and cortisol levels was found in the PD group (see top part of fig 1), indicating no coupling between the levels of these hormones. In contrast, control athletes showed a linear relationship between both hormones (see bottom part of fig 1). ACTH accounted for 83% of the variance in cortisol (R=0.91, p=0.00 (two-sided); r=0.92, p=0.00 (two-sided)). Even when leaving out the two top-right track and field athletes from the control group, the explained variance in cortisol by ACTH was still 81%.

The relationship between adrenocorticotrophic hormone (ACTH) and cortisol in performance decrement (PD) athletes and control athletes.
Discussion
In this study, we found that a performance decrease in young elite athletes of at least 1 month coincided with a worse mood state and lower resting cortisol levels in blood being decoupled from ACTH levels. We used sports-specific field testing as key indicators of a structural performance drop in athletes. The ISRT17 18 is based on the interval performance resembling the physical workload in soccer with frequent acceleration and short but frequent periods of (relative) rest. The sports Zoladz test21 mainly relies on aerobic performances with the ability to recover from a steadily increasing workload that is typical for middle-long distance runners. To evaluate performance changes, we tested at a submaximal level. Testing at submaximal level greatly increased support from the coaches to facilitate ISRT or Zoladz tests because the tests were less time-consuming and did not interfere with the intensity and training frequency of up to six times a week in both sports. Submaximal field tests could however have been one of the explanations for the small number of players included with PDs because such tests are considered as less sensitive to performance changes than maximal tests.7 Furthermore, several athletes experiencing a performance drop of at least 1 month could not participate in the laboratory study because of international matches, test matches, school exams and injuries. With some athletes, a PD could not be confirmed a second time because the coaches sent them on leave to recover from fatigue and poor performance. Unfortunately, small numbers of subjects in overtraining and OR studies are not uncommon.10 11 25,–,28
The POMS has been used in many studies to monitor mood state in athletes, and several reviews have reported consistent results.3 7 29 In the taper study by Hooper et al,30 high scores on the subscales depression, tension, anger and fatigue measured with the long version of the POMS31 were considered as markers of ‘staleness’ (a synonym for OR or overtraining). Halson et al32 found a clear increase of the total mood score of the POMS-65 (the extended variant of the POMS) with the introduction of a 2-week intensified training period and, subsequently, a drop after 2 weeks of recovery. However, mood state could be worsened during overload phases without leading to a PD.33,–,35 Consequently, in OR and overtraining research, the use of the POMS should be combined with performance assessment.7
We also observed a worse mood state in PD athletes compared to controls, as shown by significantly higher anger and depression scores (table 1). Nuissier et al36 reported a five times higher anger score and an eight times higher depression score in physical education students with the highest negative mood scores than their colleagues with the lowest negative mood scores. Therefore, although statistically significant, the differences in mood scores between our PD and control athletes were not as dramatic as seen in other studies.
Our study is unique in using the coherence of the different mood subscale scores to distinguish PD athletes from controls. Based on the concept of the POMS, it is expected that the subscales anger, depression and tension share a common factor with fatigue. This common factor contrasts with the subscale vigor. Thus, a negative correlation between fatigue and vigor could be expected. Such a correlation was present in controls and PD athletes, although in the latter group it was borderline significant only (see table 2). Anger and depression scored higher in the PD group compared to controls, and they also seemed to be the starting point in a cluster of associations typical to either PD athletes or controls (fig 2). This creates psychological profiles of both groups, seemingly mirrored yet with very distinct if, for example, we consider the lack of an association between tension and fatigue in controls.

Spearman rank correlations* between POMS subscales in performance decrement athletes and control athletes. *Nonsignificant Spearman rank correlations from table 2 are omitted from this figure.
Because ACTH levels in PD athletes did not differ from ACTH levels in controls, the lower levels of cortisol in the PD subjects may indicate a blunted response to ACTH stimulation. Handziski et al37 studied ACTH and cortisol profiles in 30 elite soccer players during a 6-week preparation period, before the start of the season. This period is considered as physically the most demanding one and coincides with a high injury risk.38 Despite that our PD athletes were well advanced into the season, the general hormone levels resembled that of athletes shortly after the 6 weeks heavy overload phase in the Handziski study.37
The blunted response to ACTH resulting in low resting levels of cortisol in the PD group has not been observed in previous studies with overreached athletes.39,–,41 Nevertheless, Snyder et al12 reported lower resting levels of cortisol level in endurance athletes (cyclists) after a short period of intensified training, although a generally reduced performance was not found. Urhausen et al13 also reported reduced cortisol levels in short-term overtrained athletes, with a markedly reduced performance.
The diurnal rhythm of cortisol parallels the release of ACTH from the anterior pituitary. Physical and mental stress increases the release of ACTH and, consequently, will lead to higher levels of cortisol. In healthy subjects, ACTH and cortisol are correlated positively,42 but in depressed patients this correlation is non-existent.43 In a study on high- and low-risk alcoholism, the low-risk group showed a high correlation between ACTH and cortisol, whereas ACTH and cortisol showed a decoupling because both hormones were not correlated in the high-risk group.44 Decoupling of cortisol and ACTH levels in our PD athletes was found as well (see fig 1). The decoupling was not dominated by soccer players, nor did the two extreme track and field athletes have a decisive influence on the strong correlation between ACTH and cortisol in controls. We also checked if the type of sports had a decisive overall effect on the decoupling phenomena. Without any of the track and field athletes and after adding 11 different soccer players without a performance decrease from the same study population but tested during the 2007–2008 season, we analysed 14 soccer players in the control group and the remaining seven PD soccer players. Again, in the control group, ACTH correlated significantly with cortisol (R=0.72, p=0.00 (two-sided); r=0.75, p=0.00 (two-sided)). No correlation was observed in the PD soccer players. Evidently, our data are not suited to fully explain at which level of the hypothalamic–pituitary–adrenal axis the decoupling of ACTH and cortisol originates. However, we hypothesise that a reduced overall sensitivity of the adrenal cortex to ACTH is the most likely explanation.
What is already known about this topic
Recently, non-functional overreaching (NFO) was presented as the prestage of the overtraining syndrome. In contrast with athletes characterised by functional overload symptoms and temporary performance decrements, NFO athletes share prolonged periods of reduced performance, psychological distress and hormonal disturbances. No screening instruments for NFO are available in the sports practice.
What this study adds
Repeated field performance tests showed that a prolonged reduction of performance coincided with worsened mood scores, different mood profiles, a blunted cortisol response and a decoupling of ACTH to cortisol levels. Field performance tests may develop into valid screening instruments of NFO in athletes.
Considering the mood and hormonal differences between the control and PD athletes, we postulate that characteristics of PD athletes adequately fit the description of NFO athletes as described by Meeusen et al.1 Compared with athletes without a lengthy performance drop (controls), we found higher levels of anger and depression in athletes with an underperformance period exceeding the duration of 1 month. Depression scores were associated with fatigue and tension scores. In the underperforming athletes, cortisol levels were reduced and decoupled from ACTH levels. These results support the assumption that field performance tests can be useful in distinguishing NFO athletes from athletes with a proper load and recovery balance, thereby preventing athletes from developingthe OTS.
References
Footnotes
-
Funding ZonMw, Den Haag, The Netherlands.
-
Competing interests None.
-
Ethics approval This study was conducted with the approval of the Central Committee on Research Ethics involving Human Subjects.
-
Provenance and peer review Not commissioned; externally peer reviewed.
Detail has been removed from this case description/these case descriptions to ensure anonymity. The editors and reviewers have seen the detailed information available and are satisfied that the information backs up the case the authors are making.