Article Text

Abstract
Objective To define the optimal cut-off for low aerobic fitness and to evaluate its accuracy to predict clustering of risk factors for cardiovascular disease in children and adolescents.
Design Study of diagnostic accuracy using a cross-sectional database.
Setting European Youth Heart Study including Denmark, Portugal, Estonia and Norway.
Participants 4500 schoolchildren aged 9 or 15 years.
Main Outcome Measure Aerobic fitness was expressed as peak oxygen consumption relative to bodyweight (mlO2/min/kg).
Results Risk factors included in the composite risk score (mean of z-scores) were systolic blood pressure, triglyceride, total cholesterol/HDL-cholesterol ratio, insulin resistance and sum of four skinfolds. 14.5% of the sample, with a risk score above one SD, were defined as being at risk. Receiver operating characteristic analysis was used to define the optimal cut-off for sex and age-specific distribution. In girls, the optimal cut-offs for identifying individuals at risk were: 37.4 mlO2/min/kg (9-year-old) and 33.0 mlO2/min/kg (15-year-old). In boys, the optimal cut-offs were 43.6 mlO2/min/kg (9-year-old) and 46.0 mlO2/min/kg (15-year-old). Specificity (range 79.3–86.4%) was markedly higher than sensitivity (range 29.7–55.6%) for all cut-offs. Positive predictive values ranged from 19% to 41% and negative predictive values ranged from 88% to 90%. The diagnostic accuracy for identifying children at risk, measured by the area under the curve (AUC), was significantly higher than what would be expected by chance (AUC >0.5) for all cut-offs.
Conclusions Aerobic fitness is easy to measure, and is an accurate tool for screening children with clustering of cardiovascular risk factors. Promoting physical activity in children with aerobic fitness level lower than the suggested cut-points might improve their health.
Statistics from Altmetric.com
There are many simple anthropometric (eg, body mass index; BMI) and physiological measures (eg, aerobic fitness level) that may predict the onset and progression of cardiovascular and metabolic diseases, yet widespread screening of schoolchildren is not in place.1 2 BMI, known to be associated with cardiovascular disease, is an accepted measure for this purpose.2 However, aerobic fitness level is still not well recognised as a screening tool in paediatric populations.
A growing body of evidence suggests that aerobic fitness level is inversely associated with the presence of clustering of cardiovascular risk factors among children and adolescents1 3 4 and cardiometabolic events later in life.5 By assessing aerobic fitness simple risk stratification can be performed in the school setting and a strategy for selecting children ‘at risk’ for potential further investigation can then be created.
Most of the published cut-offs defining low aerobic fitness in childhood have been based on population distributions (<10th, 25th, 50th percentiles for sex and age-specific distribution).5 6 Although the choice of percentile cut-offs is usually arbitrary and vulnerable to changes over time, as the population distribution changes, these cut-offs are strongly correlated to health outcomes.1 7 Correlation analysis is a useful technique for describing associations between aerobic fitness and metabolic risk and for making recommendations for prediction equations. Nevertheless, correlation analysis cannot describe the nature and extent of misclassifications when the purpose is to identify individuals at risk.8 Therefore, the accuracy of a diagnostic test to distinguish between the presence and absence of a certain health condition or trait will depend on the cut-off chosen and not only the degree of closeness between the predictor and the predicted variable. Cut-off points could in principle be arbitrary, biologically based, which would make sense if the association between the exposure and outcome was not linear or they could be the best trade-off between selecting individuals at risk and minimising misclassification (the number of false-positive and false-negative individuals).
A threshold value that accurately distinguishes between healthy and ill individuals is the most significant decision in the area of clinical diagnosis.9,–,11 It is also of importance as a screening tool to detect individuals at risk in public health settings. Receiver operating characteristic (ROC) analysis is a useful tool to assist in taking this decision. By applying ROC analysis, this study aimed to define the optimal cut-off for low aerobic fitness and to evaluate its ability to predict clustering of cardiovascular risk factors among children and adolescents.
Methods
Study population and design
This study used cross-sectional data from the European Youth Heart Study (EYHS) from which 9-year-old and 15-year-old schoolchildren were randomly selected from Denmark (city of Odense) in 1997/8, Estonia (city and county of Tartu) in 1998/9, Portugal (island of Madeira) in 1999/2000 and Norway (national sample) in 2005/6. Study protocols were identical in all countries and conformed to the international guidelines on biomedical research.
The overall participation rate was 73% in Portugal, 75% in Denmark, 76% in Estonia and 81% in Norway. Of 5591 individuals who participated in the study, 4500 individuals with complete information on anthropometrics, blood sampling and aerobic fitness were included. A comparison of the respondents (4500) and non-respondents (1091) showed that girls and non-white children were more likely to have incomplete data. Furthermore, no differences in age, school grade and parents' civil status between respondents and non-respondents were observed. Complete information on the cohort is presented elsewhere.12 13
Aerobic fitness assessment
In the Norwegian cohort all children were tested with direct measurement of peak oxygen consumption (VO2) with a MetaMax III X oxygen analyser (Cortex Biophysics, Leipzig, Germany). Linear regression was used to calculate an equation to transform performance (maximal power output) into peak VO2. In the remaining cohorts, aerobic fitness was determined by a maximum cycle ergometer test (Monark 839 Ergomedic, Varberg, Sweden). The workload was preprogrammed to increase every third minute until exhaustion. Initial workload and increments for the 9-year-old children were 20 or 25 watts (W), depending on whether the child's body mass was below or above 30 kg. Initial workload and increments for the 15-year-old adolescents were 40 or 50 W for girls and boys, respectively. Heart rate was registered continuously (Polar Vantage NV; Polar Electro Oy, Kempele, Finland). Criteria for exhaustion included a heart rate of 185 beats/min, failure to maintain a pedaling frequency of at least 30 revolutions/min, and a subjective judgement by the observer that the child could no longer keep up, even after vocal encouragement. The maximal power output (Wmax) was calculated as the power in the last fully completed workload plus the power increment of the last step multiplied by the time proportion completed of the last step. Aerobic fitness was expressed as the maximal power output per kilogram of body mass. This measure has a low test–retest coefficient of variation (2.5–4.8%)1 and it has been validated against the direct measurement of VO2 in a subsample of the study population showing high correlation with peak VO2 (r>0.90, p<0.001). The maximal power output was converted to peak VO2 (mlO2/min/kg) using the following equations:12

where sex=0 for girls and sex=1 for boys.
Blood sampling and other measures
Venous blood samples were obtained in the morning after an overnight fast and were stored at −80°C until analysis. Total cholesterol, high-density lipoprotein (HDL) cholesterol and triglyceride were measured by enzymatic methods. Insulin and glucose were analysed by enzyme immunoassay and hexokinase methods, respectively.13 Insulin resistance was estimated according to the homoeostasis model assessment as the product of fasting glucose (mmol/l) and insulin (μU/ml) divided by the constant 22.5.14
Body mass was measured in light clothing to the nearest 0.1 kg using a calibrated beam balance scale. Height was measured without shoes to the nearest 0.5 cm using a transportable Harpenden stadiometer. The sum of the thickness of four skinfolds (biceps, triceps, subscapular and suprailiac) was measured using a Harpenden calliper, with the mean of three measurements used at each site, in accordance with procedures described by Lohman et al.15 The jaws of the calipers were placed around the skinfolds 1 cm below where it was held by the thumb and first finger. Care was taken not to get muscle inside the skinfold. Measurements were performed on the left side of the body with the child standing, except for the measurement over the triceps, which was done with the knee flexed at 90° and the muscle relaxed. During EYHS testing, both intertester and intratester reliability data were recorded for skinfold measurements. The data suggest that intertester (0.835–0.999) and intratester (0.915–0.996) reliability were within acceptable limits and it is unlikely that significant between-country testing errors have been introduced. Intertester and intratester reliability data are fully described elsewhere.13
Maturation was assessed according to Tanner staging,16 and classified as at prepubertal (Tanner 1), pubertal (Tanner 2–4) and postpubertal stage (Tanner 5). Girls were staged according to breast development and boys according to pubic hair growth. The judgement was performed by experienced personnel (physician or an exercise physiologist) of the same gender as the participant. Privacy was maintained at all times.
Clustering of cardiovascular risk factors
z-Scores by sex and age were computed for all risk factors: systolic blood pressure, triglyceride, total cholesterol/HDL-cholesterol ratio, homoeostasis model assessment and the sum of four skinfolds. Skewed variables were log-transformed, before z-scores were constructed. z-Scores of the individual risk factors were added up to construct a clustered risk score of cardiovascular and metabolic markers, which again was standardised. The mean of the composite risk score was therefore zero by definition. Children with values greater than 1.0 SD in the continuous composite risk score variable were defined as being at risk.17
The rationale for using the composite risk score approach and defining children with greater than 1 SD at risk is thoroughly described elsewhere.17 18 Briefly, a preliminary analysis was done by categorising risk factors and defining the upper quartile to be at risk. If risk factors are independently distributed, the number of children with a specific number of risk factors will follow a binominal distribution. If more children are observed than expected from a binominal distribution with a high number of risk factors, it means that the risk factors are not independently distributed in these children, which could be referred to as a syndrome. We found the risk factors were not independent in 14% of the children.1 9 Therefore, we defined 1 SD above the mean in summed z-score to be at risk, which corresponds to 14.5% of the sample.
Analysis
The ability of aerobic fitness to discriminate between the absence and presence of clustering of risk factors was evaluated through ROC analyses. The optimal cut-off, which maximises the sum of sensitivity and specificity, was derived for each sex and age group.9 Sensitivity is the percentage of all cases, which are selected by our cut-off point (how well do we pick up cases), and specificity is the percentage of cases among the unexposed (how many cases did we not pick up). If we decrease the cut-off point for aerobic fitness we will identify fewer cases (lower sensitivity), but we will get fewer false positives (higher specificity). When we do ROC analysis, we simply plot.
The area under the curve (AUC) quantifies the screening performance over all cut-offs and can take values between 0 and 1, in which 1 is a perfect screening test and 0.5 is a test equal to chance. It is expected that the lower limit of 95% CI of the AUC would not include the value of 0.5.11
The diagnostic accuracy of the optimal cut-off to identify children at risk was evaluated based on different probability values, such as AUC, positive predictive values (PPV) and negative predictive values (NPV) and the percentage of children correctly classified (efficiency). Cut-offs referring to the 10th, 25th and 50th percentiles for sex and age-specific distribution were also considered. The ability of each cut-off to classify children correctly at risk was then compared.
Differences between sexes were tested with analysis of variance. Finally, logistic regressions were used to evaluate the odds ratio of having clustering of risk factors in each cut-off for aerobic fitness. We first did a preliminary analysis of the association between the composite risk factor score and aerobic fitness in which we adjusted for the stage of puberty, but the partial R-value for fitness only changed from −0.443 to −0.445 after adjustment for puberty, and we therefore decided to present all analyses without adjustment for puberty. The standardised coefficient for puberty was 0.033. Analyses were performed using STATA.
Results
The age ranges of the 9-year-old and 15-year-old schoolchildren were 8.2–11.3 and 14.1–17.3 years, respectively. For the 9-year-olds, 70% of girls and 79% of boys were prepubertal. For the 15-year-olds, 42% of the girls were pubertal and 58% were postpubertal, whereas 1%, 32% and 67% of the boys were prepubertal, pubertal and postpubertal, respectively. Boys were taller, had higher mean values of aerobic fitness, systolic blood pressure and glucose and lower values of insulin, total cholesterol and sum of skinfolds compared with girls in both age groups. Furthermore, 15-year-old boys were heavier and presented with significantly lower mean values of HDL-cholesterol than girls. Nine-year-old girls had higher values of triglyceride and lower values of HDL-cholesterol compared with boys of a similar age (table 1).
Characteristics of the study sample
Approximately 14.5% of the study population had clustering of risk factors, and no differences between sexes and age groups were observed. However, in the stratified analysis by country, Denmark had the most adverse risk profile and Portugal had the lowest risk. The percentage of children with clustering of risk factors was 27.1% in Denmark, 13.2% in Estonia, 11.8% in Norway and 9.4% in Portugal. There were also significant differences in the aerobic fitness level across countries. Denmark had the highest aerobic fitness level for each sex and age group, whereas Portugal had the lowest level. Even though Portuguese children had a higher level of body fat and lower level of aerobic fitness compared with Danish children, they still showed lower blood pressure and a better lipid profile and, therefore, lower z-scores (data not shown). More details about the differences among countries are described elsewhere.1 17 19
ROC analyses
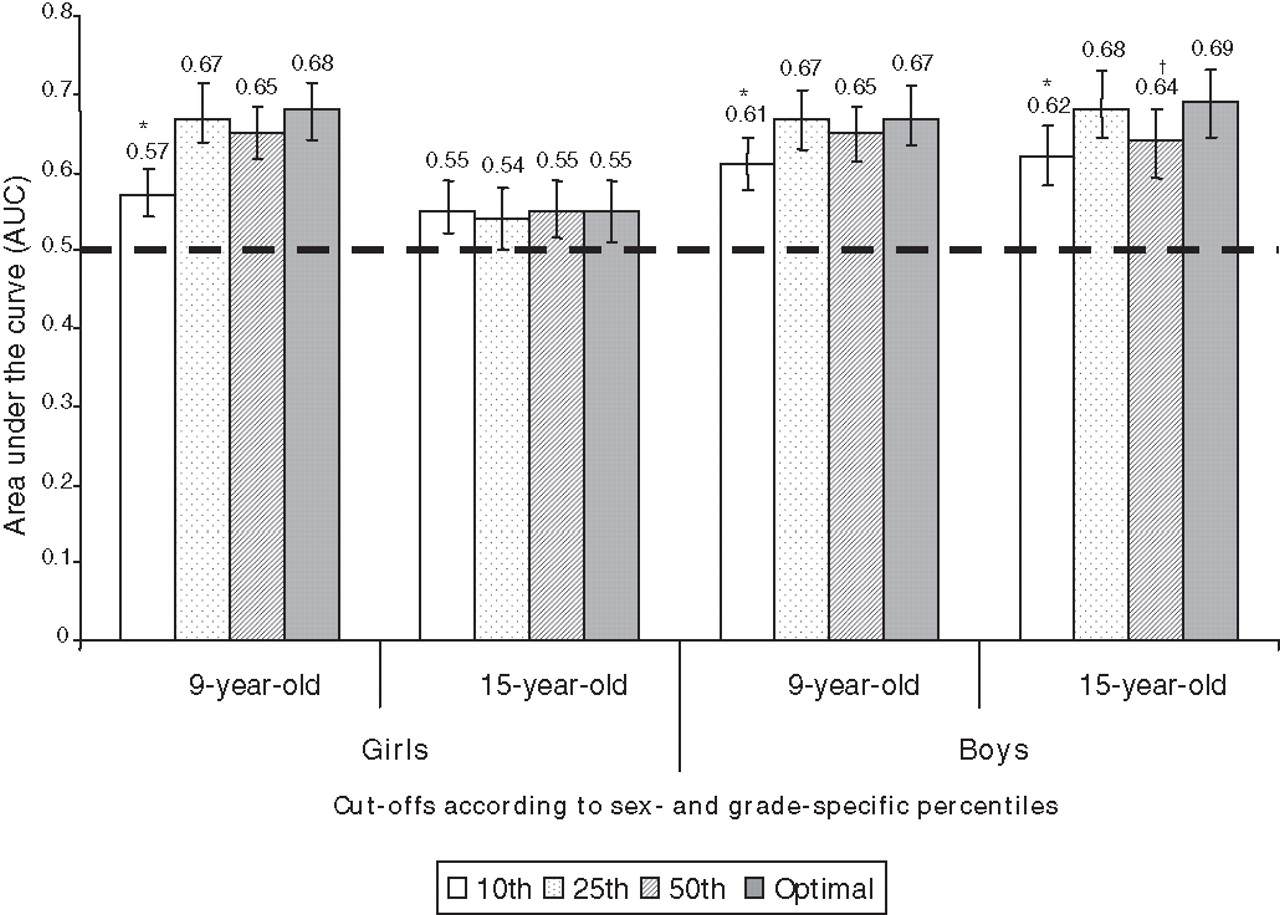
The ROC analyses showed a significant discriminatory accuracy of aerobic fitness to identify children and adolescents at risk, as AUC for all cut-offs were above 0.5, except for the 25th percentile among 15-year-old girls (figure 1).

The sex and age-adjusted area under the curve for the prediction of clustering of risk factors. Significant difference between the optimal cut-off and percentiles cut-offs *p<0.001; †p<0.05. Reference: optimal cut-off. 10th, 25th and 50th percentiles for fitness. Error bars indicate 95% CI.
The optimal cut-off performed significantly better than the 10th percentile for all sex and age groups, expect for 15-year-old girls. Most cut-offs were slightly below the 25th percentile of sex and age-specific distribution. For 9-year-old boys, the optimal cut-off was above the 25th percentile. The optimal cut-offs for the 9-year-old girls were 37.4 mlO2/min/kg and 33.0 mlO2/min/kg for the 15-year-old girls, whereas for boys the optimal cut-offs were 43.6 mlO2/min/kg and 46.0 ml/min/kg for the 9 and 15-year-olds, respectively.
Diagnostic characteristics
Optimal cut-offs, and cut-offs referring to the 10th and 25th percentiles showed low sensitivity and high specificity regardless of sex and age groups. When using the optimal cut-offs, sensitivity ranged from 29.7% to 55.6% and specificity from 79.3% to 86.4%. A shift in the trade-off between sensitivity (range 57.9–75.5%) and specificity (range 51.3–54.6%) was observed when using cut-offs referring to the 50th percentile (table 2).
Diagnostic characteristics of cut-offs for aerobic fitness according to sex and age groups
How well do cut-off points predict clustered risk and misclassify subjects?
All cut-off approaches presented higher NPV than PPV for boys and girls in both age groups. To illustrate, table 2 shows the probability that a 9-year-old boy, classified as being at risk by using the optimal cut-off, was truly at risk was 32.3% (PPV), whereas the probability of a boy classified as healthy by aerobic fitness was truly healthy was 90.2% (NPV).
Despite the modest PPV, the probability that a person classified as being at risk by aerobic fitness had indeed clustering of risk factors was higher for 15-year-old boys than girls. However, no appreciable sex differences were observed among the 9-year-olds across cut-off approaches.
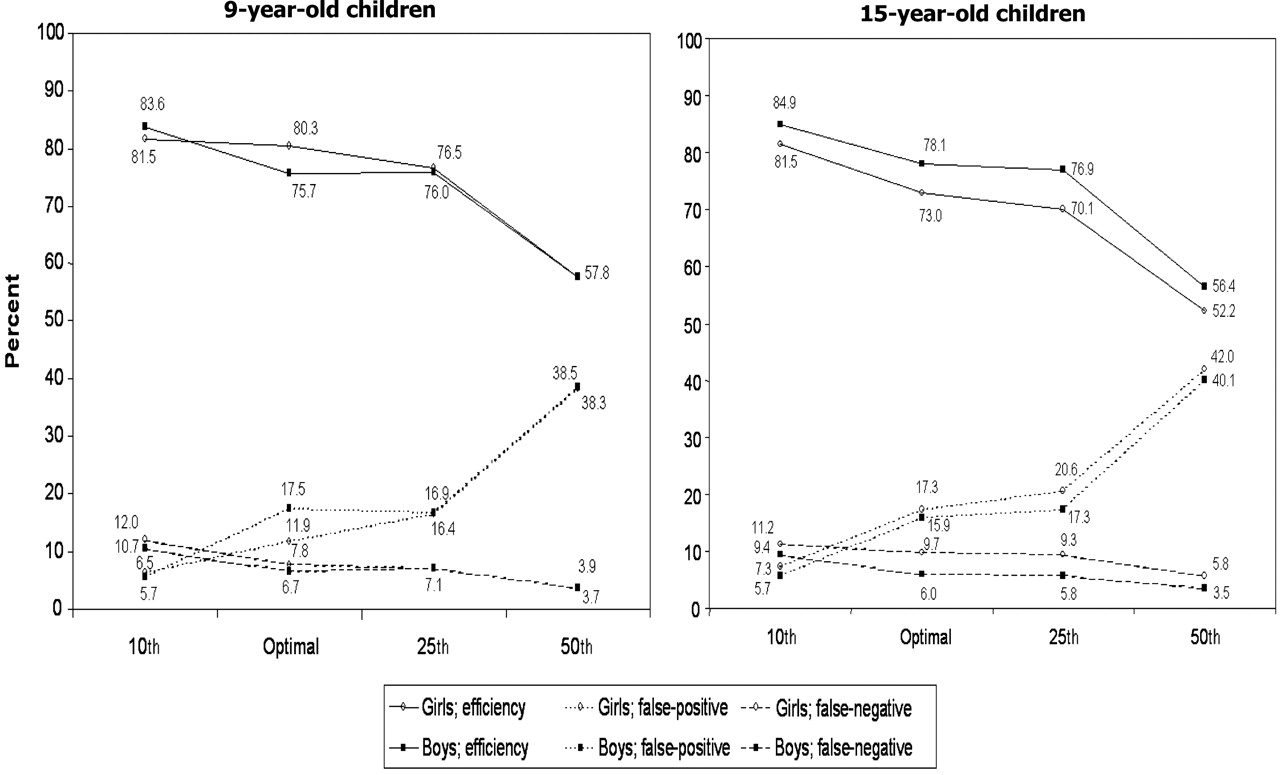
The fraction of children correctly classified was higher using the 10th percentile and the optimal cut-off compared with the 25th and 50th percentiles for most sex and age groups (figure 2). Although the efficiency was higher using the 10th percentile compared with the optimal cut-off, there was an imbalance between the percentage of false-positive and false-negative cases between the two cut-off approaches. The fraction of false-negative cases was lower when using the optimal cut-off compared with the 10th percentile. On the other hand, the fraction of false-positive cases was higher when using the optimal cut-off compared with the 10th percentile.

Type and extent of misclassifications according to sex and age groups. Efficiency: fraction correctly classified. Nine-year-old: girls (n=1181); boys (n=1219); 15-year-old: girls (n=1051); boys (n=1049). 10th, 25th and 50th percentiles for fitness.
Odds ratio for being at risk
Independently of the cut-off used to define low aerobic fitness, the likelihood of having clustering of risk factors was statistically significant (p<0.0001) even after controlling for sex, age, puberty stage and country. The optimal cut-off showed the highest likelihood for being at risk (OR 4.2, 95% CI 3.5 to 5.1) compared with the others (figure 3). Stratified analyses indicated similar findings in each sex and age group (data not shown).

Associations of different cut-offs for aerobic fitness with clustering of cardiovascular risk factors. Logistic regressions were performed independently for each cut-off. Analyses adjusted for sex, age, puberty stage and country. p<0.0001 for all cut-offs. 10th, 25th and 50th percentiles for fitness. Error bars indicate 95% CI.
Discussion
Previous studies from the EYHS have shown that aerobic fitness was inversely associated with metabolic risk.1 7 17 19 This study builds on these earlier findings by examining the predictive ability of different cut-offs for aerobic fitness in detecting children at risk. The main findings of this study were that the sex and age-adjusted AUC for most cut-offs were significantly higher than would have been expected by chance (AUC >0.5). Although examination of AUC is an important step in understanding prediction utility, it is by no means the only estimate that should be used. Furthermore, it is important to consider the efficiency and type of misclassifications.11
The use of cut-offs
The 10th percentile and the optimal cut-off showed the highest efficiency, but there was a trade-off between the fraction of false-positive and false-negative cases between the two approaches. As long as the prevalence of a particular event is little pronounced in populations, the absolute number of true positives is lower than true negatives. Consequently, misclassification becomes higher when applying cut-offs with higher sensitivity than specificity. Although highly specific cut-offs increase efficiency, they produce a major imbalance between the two types of misclassifications, and thus the false-positive rate is significantly lower than the false-negative rate.20 21 In addition, the number of false-positive and false-negative cases may have different consequences depending on the clinical and public health settings of interest.
Considering that regular aerobic exercise is not harmful for children and may increase the aerobic fitness level22 23 and reduce cardiovascular risk,5 6 false-positive cases (eg, failing to identify children as high risk who really are at high risk) are of greater concern than false-negative cases (eg, increasing physical activity level of low-risk children). However, in certain settings, minimising the number of false-positives is preferable due to the social stigma of being mislabelled as ‘at risk’, but neglects a high percentage of true-positive cases in need of health attention.
It is valuable to note that aerobic fitness has a strong genetic component,24 and that part of the variability in health-related fitness is not accounted for by physical activity. However, studies have shown that the aerobic fitness level is also determined by individual physical activity level.22 25 It has been observed that aerobic fitness decreases to a level close to 30 mlO2/min/kg in children if they are sedentary regardless of their genetic profile.26
Comparison with other studies
National and international aerobic fitness test data have been used to develop percentile tables for boys and girls of all ages.5 27 Normative standards based on percentile data are easy to interpret and allow comparisons relative to other children in a group, but do not provide information concerning how the values relate to health. Therefore, normative standards are based on the children and adolescents' current level of aerobic fitness rather than the level they should achieve. For instance, consider whether it is good for a child to achieve an average fitness level if the average child has a level of fitness that is unhealthy. Another limitation is that percentiles, particularly those set at a high level, might discourage children whose aerobic fitness levels are moderate or low, even though the aerobic fitness levels of those children may be adequate in other contexts (eg, health status).27 A potential solution to this problem is to use health-related cut-offs.
The European Group of Pediatric Work Physiology, based on expert opinions, suggested cut-offs for aerobic fitness in adolescents: VO2 peak of 35 mlO2/min/kg for girls and 40 mlO2/min/kg for boys.28 The Cooper Institute for Aerobics Research proposed cut-offs for children and adolescents, based on extrapolation of threshold values for adults into childhood.27 The cut-offs proposed by the Cooper Institute (table 3) were not created from the relation of the current aerobic fitness level to health risk in childhood, and further studies are needed to validate the proposed cut-offs, for instance by using prospective health outcomes or current cardiometabolic risk markers. Nevertheless, the linkage of aerobic fitness to health outcomes during childhood may be complicated because cardiovascular morbidity is rare in children.
Cut-offs for low aerobic fitness in children and adolescents
Ruiz et al29 used a Swedish and Estonian population of children (n=873) and Lobelo et al30 used a population-based sample of US adolescents (n=1247) in an attempt to link cut-offs for aerobic fitness to current health outcomes. However, the accuracy of aerobic fitness to predict clustering of risk factors was mainly interpreted by AUC. Therefore, the purpose of the present study was to extend the analyses performed previously in a large population of European children and adolescents. As expected, cut-offs proposed by the previous literature27,–,30 were relatively similar to those presented in this study (table 3). Fifteen-year-old boys had the highest cut-off for aerobic fitness, whereas 15-year-old girls had the lowest cut-off. This pattern is in unison with other studies,27,–,30 and it is plausible that aerobic fitness increases in boys during puberty and decreases markedly in adolescent girls due to sex hormones and fat distribution.6 31
Strengths and limitations
There are several strengths to this study, such as the large number of clinical risk factor measurements, the use of a sample comprising boys and girls ranging from 8.2 to 17.3 years (n=4500), which represent southern (Portugal), northern (Denmark and Norway) and eastern (Estonia) Europe and, with very different physical, socioeconomic and cultural environments. The inclusion of four different European countries made it possible to derive optimal cut-offs for the whole sample and for each country. Stratified analyses by country showed that although optimal cut-offs for aerobic fitness tended to be higher in Denmark and lower in Portugal, cut-offs were surprisingly similar despite the fact that the risk profile in each country differed markedly.
One of the limitations of this study was that children were not used to cycle in Madeira/Portugal. Therefore, the cycle ergometer test seems to be less suitable for Portuguese children, and this might explain why they showed the lowest aerobic fitness level compared with the other countries.
This study lacks refined measurements of adiposity in children and adolescents and anthropometric measurements were used instead. The major drawback with the skinfold technique lies in the extensive expertise one must have in taking readings accurately and with consistency. However, skinfolds were measured by trained professionals and standard methods of data collection were applied in all study locations to ensure comparability of results.13
In addition, there is a lack of consensus regarding the definition of the metabolic syndrome in children, which poses problems for researchers and clinicians. The new International Diabetes Federation (IDF) definition of paediatric metabolic syndrome is a clinically accessible diagnostic tool, avoiding measurements that may only be available in a research setting.32 However, the IDF definition lacks diagnostic criteria for children under the age of 10 years. Therefore, a z-score approach, which captures information from both cardiovascular and metabolic risk factors, was chosen in this study. The z-score has the advantage that information is not reduced by dichotomisation of each risk factor, and the strength of an association between exposure and outcome is stronger when the z-score is used.1 19 33 However, there is debate about the usefulness of the metabolic syndrome for assessment and management of cardiovascular risk. Although it is unknown whether clustering of risk factors enhances the prediction of severe morbidity and mortality in children because these events rarely occur during childhood or adolescent ages, it is known that both individual and composite risk factors associated with the metabolic syndrome track from childhood to adulthood.34 Another limitation is the use of a cross-sectional design. We were not able to investigate whether the proposed cut-offs would predict an adverse metabolic profile later in life.
Implications for practice and policy
Health-related fitness cut-offs for children and adolescents can be used as a risk stratification tool to identify target populations for health promotion policies and disease prevention in public health and clinical settings. Although criterion-based measurement of aerobic fitness (ie, gas-analysed VO2max) is difficult and expensive to assess, estimation from aerobic performance (ie, maximum cycle ergometer test) is easy and reliability is sufficient for this purpose. As schools are seen as a window of opportunity for promoting lifestyle change, a health-related fitness cut-off can be adopted by the school system to encourage high-risk children to engage in physical activity.
In conclusion, aerobic fitness is easy and relatively cheap to measure, and yet it is an accurate tool for screening children with clustering of cardiovascular risk factors. The optimal cut-offs for aerobic fitness derived in this study, which indicate the best tradeoff between sensitivity and specificity in predicting clustering of risk factors, were similar to thresholds proposed by the previous literature.27,–,30 However, longitudinal studies linking a low aerobic fitness level in childhood to prospective health outcomes are necessary to support the optimal cut-offs presented here.
What is already known on this topic
▶ A low fitness level is associated with the presence of clustering of cardiovascular risk factors already in childhood.
▶ There is no standard definition of a low fitness level in children and adolescents.
What this study adds
▶ Cut-offs defining low aerobic fitness linked to health outcomes during childhood and adolescence are proposed based on pooled data from four European countries.
▶ The definition of low aerobic fitness is less arbitrary and more international than others.
▶ Health-related fitness cut-offs for children and adolescents allow the identification of target populations for health promotion policies and disease prevention at early ages.
Acknowledgments
The authors acknowledge the members of the EYHS group for making their data available.
References
Footnotes
-
Funding The EYHS is supported by the following grants from Denmark: Danish Heart Foundation, Danish Medical Research Council, Health Foundation, Danish Council for Sports Research, Foundation of 17 December 1981, Foundation in Memory of Asta Florida Bolding nee Andersen, and Faculty of Health Sciences, University of Southern Denmark, TRYG-foundation; from Estonia: Estonian Science Foundation grants 3277 and 5209; from Portugal: European Social Fund and from Norway: Directorate of Health and the Norwegian School of Sport Sciences.
-
Competing interests None.
-
Patient consent Obtained.
-
Ethics approval Ethics approval was obtained in each of the four countries before the commencement of the study. Written informed consent was obtained from all children's parents or guardians.
-
Provenance and peer review Not commissioned; externally peer reviewed.