Article Text

Abstract
Electrocardiographic changes in athletes are common and usually reflect benign structural and electrical remodelling of the heart as a physiological adaptation to regular and sustained physical training (athlete's heart). The ability to identify an abnormality on the 12-lead ECG, suggestive of underlying cardiac disease associated with sudden cardiac death (SCD), is based on a sound working knowledge of the normal ECG characteristics within the athletic population. This document will assist physicians in identifying normal ECG patterns commonly found in athletes. The ECG findings presented as normal in athletes were established by an international consensus panel of experts in sports cardiology and sports medicine.
- Athletics
- Physiology
- Adaptations of skeletal muscle to exercise and altered neuromuscular activity
Statistics from Altmetric.com
Introduction
Sudden death from intrinsic cardiac conditions remains the leading cause of mortality in athletes during sport.1 ,2 A resting 12-lead ECG is utilised as a diagnostic tool in the evaluation of both symptomatic and asymptomatic athletes for conditions associated with sudden cardiac death (SCD). The purpose of pre-participation cardiovascular screening is to provide medical clearance for participation in sport through routine systematic evaluations intended to identify pre-existing cardiovascular abnormalities, and thereby reduce the potential for adverse cardiac events and loss of life.3 Many pre-participation screening programmes include an ECG. Physicians responsible for the cardiovascular care of athletes should be knowledgeable of the physiological cardiac adaptations to regular exercise that are manifested on the ECG.
ECG changes in athletes are common and usually reflect the electrical and structural remodelling or autonomic nervous system adaptations that occur as a consequence of regular and sustained physical activity (ie, athlete's heart). In fact, up to 60% of athletes demonstrate ECG changes (in isolation or in combination) such as sinus bradycardia, sinus arrhythmia, first-degree atrioventricular (AV) block, early repolarisation, incomplete right bundle branch block (IRBBB) and voltage criteria for left ventricular hypertrophy (LVH).4 The extent of these changes is also dependent on the athlete's ethnicity, age, gender, sporting discipline and level of training and competition.5–7 Accordingly, the ability to identify an abnormal ECG suggestive of underlying cardiac disease is based on a sound understanding of ECG normality within a broad spectrum of athletic populations.
Concerns for the physician when interpreting an athlete's ECG include both missing a dangerous cardiac condition and generating false-positive interpretations that cause needless further investigations, increased economic cost and potentially unnecessary activity restriction for the athlete.8 This paper focuses on the physiological ECG adaptations commonly found in athletes to help physicians distinguish normal ECG changes from abnormal ECG findings related to a pathological cardiac condition associated with SCD. Abnormal ECG findings in athletes suggestive of underlying cardiac disease are presented separately.9 ,10
Overview of athlete's heart
Regular and long-term participation in intensive exercise (minimum of 4 h/week) is associated with unique electrical manifestations that reflect increased vagal tone and enlarged cardiac chamber size. These ECG findings in athletes are considered normal, physiological adaptations to regular exercise and do not require further evaluation (box 1).
Normal ECG findings in athletes
-
Sinus bradycardia (≥30 bpm)
-
Sinus arrhythmia
-
Ectopic atrial rhythm
-
Junctional escape rhythm
-
First-degree AV block (PR interval>200 ms)
-
Mobitz type I (Wenckebach) second-degree AV block
-
Incomplete RBBB
-
Isolated QRS voltage criteria for LVH
-
▸ Except:QRS voltage criteria for LVH occurring with any non-voltage criteria for LVH such as left atrial enlargement, left axis deviation, ST segment depression, T wave inversion or pathological Q waves
-
-
Early repolarisation (ST elevation, J-point elevation, J waves, or terminal QRS slurring)
-
Convex (‘domed’) ST segment elevation combined with T wave inversion in leads V1–V4 in black/African athletes.
These common training-related ECG alterations are physiological adaptations to regular exercise, considered normal variants in athletes, and do not require further evaluation in asymptomatic athletes.
AV, atrioventricular; bpm, beats per minute; LVH, left ventricular hypertrophy; RBBB, right bundle branch block.
Increased vagal tone
Common consequences of increased vagal tone include sinus bradycardia, sinus arrhythmia and early repolarisation (figure 1). Other, less common markers of increased vagal tone are first-degree AV block and Mobitz type I second-degree AV block.

ECG of a 29-year-old asymptomatic soccer player demonstrating sinus bradycardia, early repolarisation with ST elevation (arrows) and peaked T waves, and voltage criteria for left ventricular hypertrophy. These are common findings related to regular training. This figure is only reproduced in colour in the online version.
Sinus bradycardia is defined as a heart rate of <60 beats/min and is present in up to 80% of highly trained athletes.6 ,11 Heart rates ≥30 beats/min are considered normal in highly trained athletes. Sinus arrhythmia is also common, particularly in younger athletes.
Early repolarisation consists of concave ST segment elevation most commonly observed in the precordial leads and present in up to 45% of Caucasian athletes and 63–91% of black athletes of African-Caribbean descent (hereto referred to as ‘black/African’ athletes).11–13 Black/African athletes also commonly demonstrate a repolarisation variant consisting of convex ST segment elevation in the anterior leads (V1–V4) followed by T wave inversion. On the basis of current data, T wave inversions preceded by ST segment elevation are present in leads V1–V4 in up to 13% of black/African athletes and do not require further assessment in the absence of symptoms, positive family history or abnormal physical examination.12 ,13
A junctional (nodal) rhythm or wandering atrial pacemaker may be observed in up to 8% of all athletes under resting conditions.11 First-degree AV block (4.5–7.5%) and less commonly Mobitz type I second-degree AV block are also seen in athletes and a result of increased vagal tone.6 ,11 ,14
Increased cardiac chamber size
Voltage criterion for LVH is present in approximately 45% of male athletes and 10% female athletes.6 ,11 ,15 Increased QRS voltage is more common in black/African athletes.13 Although there are several voltage criteria to define LVH, the Sokolow-Lyon criterion is used most commonly. The Sokolow-Lyon voltage criterion for LVH is defined as the sum of the S wave in V1 and the R wave in V5 or V6 (using the largest R wave) as >3.5 mV (35 small squares with a standard amplification of the ECG at 10 mm/1 mV). The isolated presence of high QRS voltages fulfilling the Sokolow-Lyon voltage criterion for LVH is regarded as a normal finding in athletes related to physiological increases in cardiac chamber size and/or wall thickness and does not in itself require additional evaluation (figure 1). However, the additional presence of non-voltage criteria for LVH such as left atrial enlargement, left axis deviation, ST segment depression, T wave inversion or pathological Q waves should raise the possibility of pathological LVH and should prompt further evaluation.
IRBBB (commonly characterised as an rSR′ pattern in V1 with QRS duration <120 ms) is commonly present in athletes (12–32%) and thought to reflect an increase in right ventricular (RV) size secondary to regular training.6 ,11–14
Normal ECG findings in athletes
Sinus bradycardia
The normal heartbeat is initiated by the sinus node which is located high in the right atrium near the junction of the superior vena cava and the right atrial appendage. To be classified as sinus rhythm, three criteria must be met: (1) there must be a P wave before every QRS complex, (2) there must be a QRS complex after every P wave and (3) the P wave must have a normal axis in the frontal plane (0–90°s). Assuming an intact sinus node, the heart rate is set by the balance between the sympathetic and parasympathetic nervous systems. In healthy adults, sinus rhythm < 60 beats/min is considered as ‘sinus bradycardia’ (figure 2). In well-trained athletes, resting sinus bradycardia is a common finding due to increased vagal tone. In endurance athletes, aerobic training also may induce intrinsic adaptations in the sinus node with decreased automaticity resulting in a high prevalence of sinus bradycardia.16 ,17 In the absence of symptoms such as fatigue, dizziness or syncope, a heart rate ≥30 beats/min should be considered normal in a well-trained athlete. Sinus bradycardia disappears with an increase in heart rate during physical activity.

ECG demonstrates sinus bradycardia with a heart rate of 40 bpm. The three required features of sinus bradycardia include: (1) P wave before every QRS complex, (2) QRS after every P wave and (3) normal P wave axis (frontal plane 0–90°s). This figure is only reproduced in colour in the online version.
Sinus arrhythmia
The heart rate usually increases slightly during inspiration and decreases slightly during expiration (figure 3). This response called sinus arrhythmia can be quite exaggerated in children and in well-trained athletes resulting in an irregular heart rhythm which originates from the sinus node. It has been estimated that up to 55% of well-trained athletes have sinus arrhythmia.6 ,11 This should not be confused with sinus node dysfunction (sick sinus syndrome). Differentiating features that suggest sinus node dysfunction include lack of rhythmic changes in the heart rate, abrupt sustained rate increases and decreases and an inappropriate rate response to exercise (both a slowed acceleration and an inappropriately rapid deceleration), as well as any association with clinical symptoms such as exercise intolerance, presyncope and syncope. While the heart rhythm is quite irregular in sinus arrhythmia, the P wave axis remains normal in the frontal plane. Accelerating the heart rate with physical activity normalises the heart rhythm. Sinus arrhythmia is considered as a normal finding in an athlete.

ECG demonstrates sinus arrhythmia. Note the irregular heart rate that varies with respiration. The P waves are upright in leads I and aVF (frontal plane) suggesting a sinus origin. This figure is only reproduced in colour in the online version.
Junctional escape rhythm
A junctional or nodal rhythm occurs when the QRS rate is faster than the resting P wave or sinus rate which is slowed in athletes due to increased vagal tone (figure 4). The QRS rate for junctional rhythms is typically less than 100 beats/min, and the QRS complex usually narrow unless the baseline QRS has a bundle branch block. Sinus rhythm resumes with increased heart rates during exercise.

ECG of a 28-year-old asymptomatic Caucasian handball player demonstrating a junctional escape rhythm. Note the constant RR interval between beats. This figure is only reproduced in colour in the online version.
Ectopic atrial rhythm
In an ectopic atrial rhythm, P waves are present but are a different morphology compared to the sinus P wave. Ectopic P waves are most easily seen when the P waves are negative in the inferior leads (II, III and aVF; figure 5). The atrial rate is typically less than 100 beats/min. There also may be more than two different P wave morphologies known as a wandering atrial pacemaker. Ectopic atrial rhythms occur due to a slowed resting sinus rate from increased vagal tone in athletes, and sinus rhythm replaces the ectopic atrial rhythm when the heart rate is increased during exercise.

ECG shows an ectopic atrial rhythm. The atrial rate is 63 beats/min and the P wave morphology is negative in leads II, III and aVF (arrows), also known as a low atrial rhythm. This figure is only reproduced in colour in the online version.
First-degree AV block
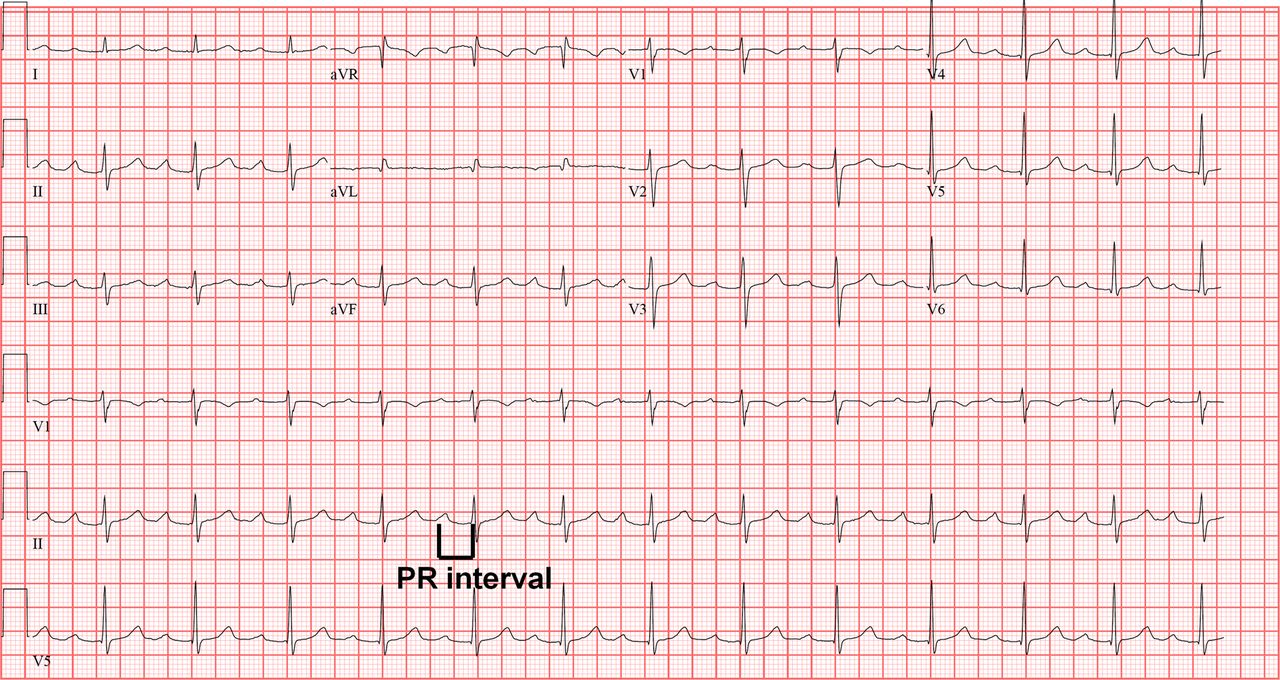
In first-degree AV block, the PR interval is prolonged (>200 ms) but is the same duration on every beat (figure 6). This represents a delay in AV nodal conduction in athletes, due to increased vagal activity or intrinsic AV node changes, and typically resolves with faster heart rates during exercise.

ECG shows first-degree AV block (PR interval >200 ms). The PR interval is measured from the beginning of the P wave to the beginning of the QRS complex. This figure is only reproduced in colour in the online version.
Mobitz type I (Wenckebach) second-degree AV block
In Mobitz type I second-degree AV block, the PR interval progressively lengthens from beat to beat, until there is a non-conducted P wave with no QRS complex (figure 7). The first PR interval after the dropped beat is shorter than the last conducted PR interval before the dropped beat. This represents a greater disturbance of AV nodal conduction than first-degree AV block, but with exercise there should be a return of 1:1 conduction.

ECG shows Mobitz type I (Wenckebach) second-degree AV block demonstrated by progressively longer PR intervals until there is a non-conducted P wave (arrows) and no QRS complex. Note the first PR interval after the dropped beat is shorter than the last conducted PR interval prior to the dropped beat. This figure is only reproduced in colour in the online version.
Incomplete right bundle branch block
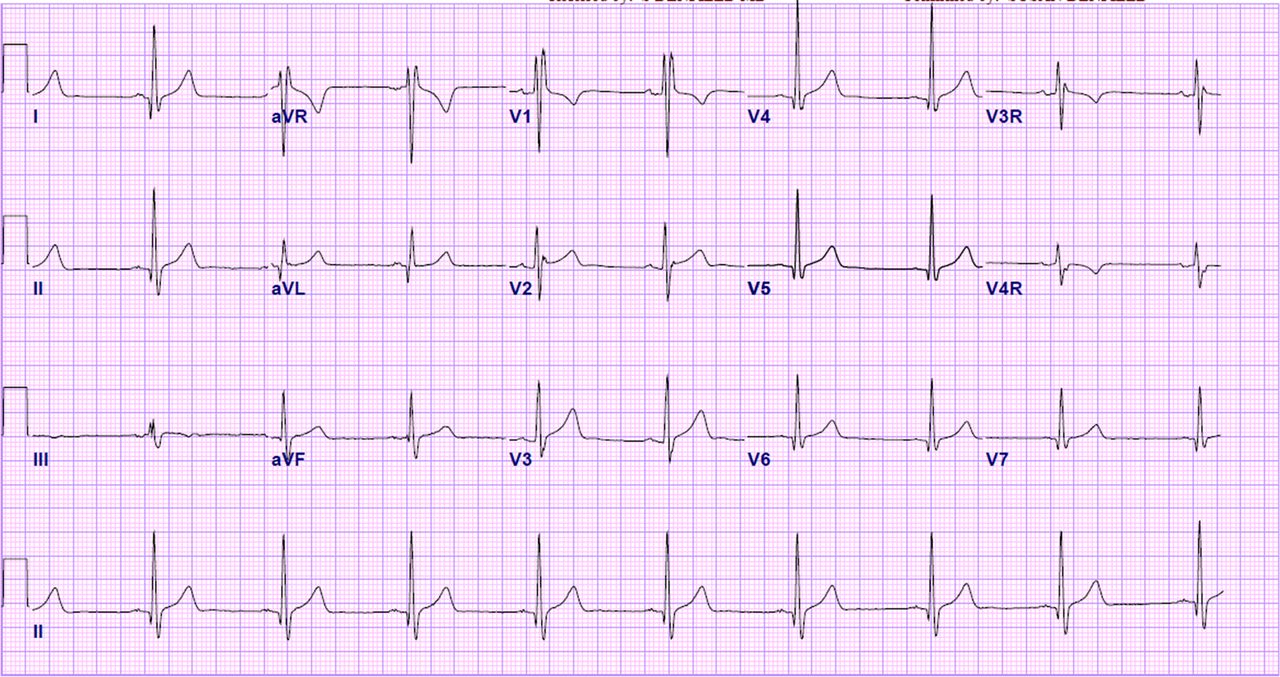
IRBBB is defined by a QRS duration <120 ms with an RBBB pattern: terminal R wave in lead V1 (rsR′) and wide terminal S wave in leads I and V6 (figure 8). IRBBB is seen in less than 10% of the general population but is observed in up to 40% of highly trained athletes, particularly those engaged in endurance training and mixed sport disciplines that include both aerobic and anaerobic components.14 ,18 ,19 It has been suggested that the mildly delayed RV conduction is caused by RV remodelling, with increased cavity size and resultant increased conduction time, rather than an intrinsic delay within the His-Purkinje system itself.20

ECG demonstrates incomplete right bundle branch block (IRBBB) with rSR′ pattern in V1 and QRS duration of <120 ms. IRBBB is a common and normal finding in athletes and does not require additional evaluation. This figure is only reproduced in colour in the online version.
The occurrence of IRBBB in an asymptomatic athlete with a negative family history and physical examination does not require further evaluation. During the physical examination, particular care should be devoted to the auscultation of a fixed splitting of the second heart sound because IRBBB can be an associated ECG finding in patients with an atrial septal defect.
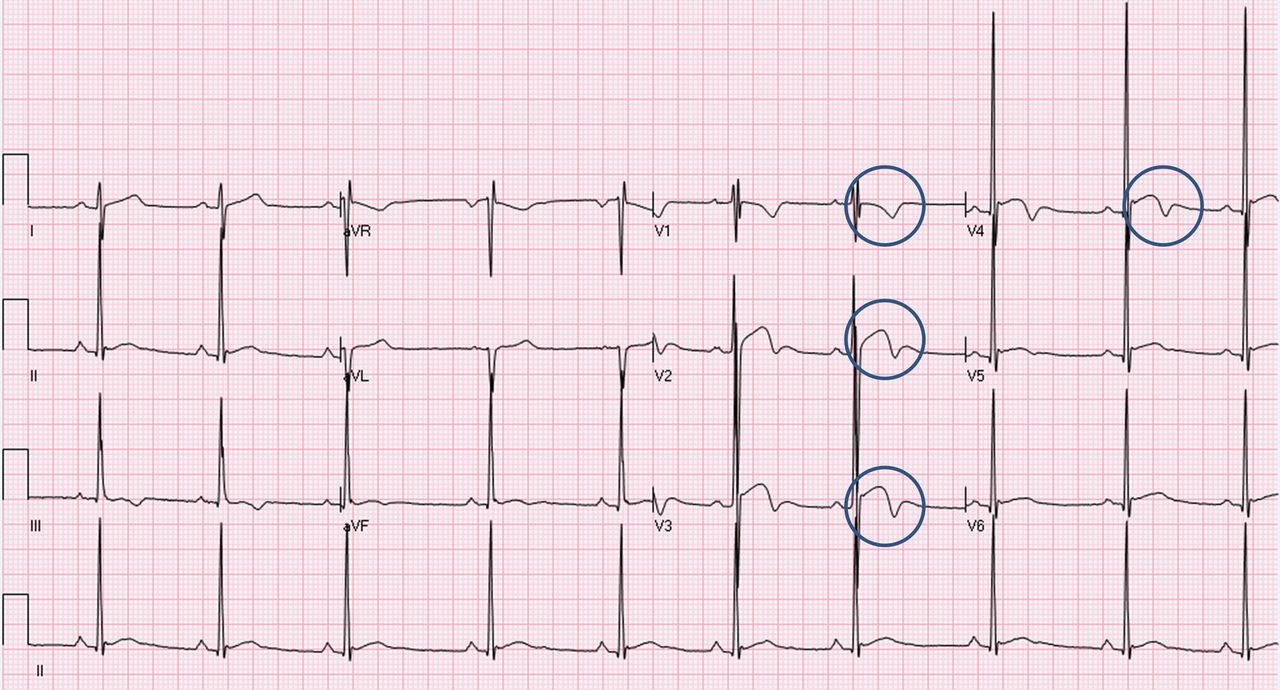
IRBBB may be seen in patients with arrhythmogenic RV cardiomyopathy (ARVC).21 However, in ARVC, the IRBBB pattern is usually associated with other ECG abnormalities, such as T wave inversion involving the mid-precordial leads beyond V2, low limb-lead voltages, prolonged S wave upstroke and/or premature ventricular beats with a left bundle branch block (LBBB) morphology (figure 9).
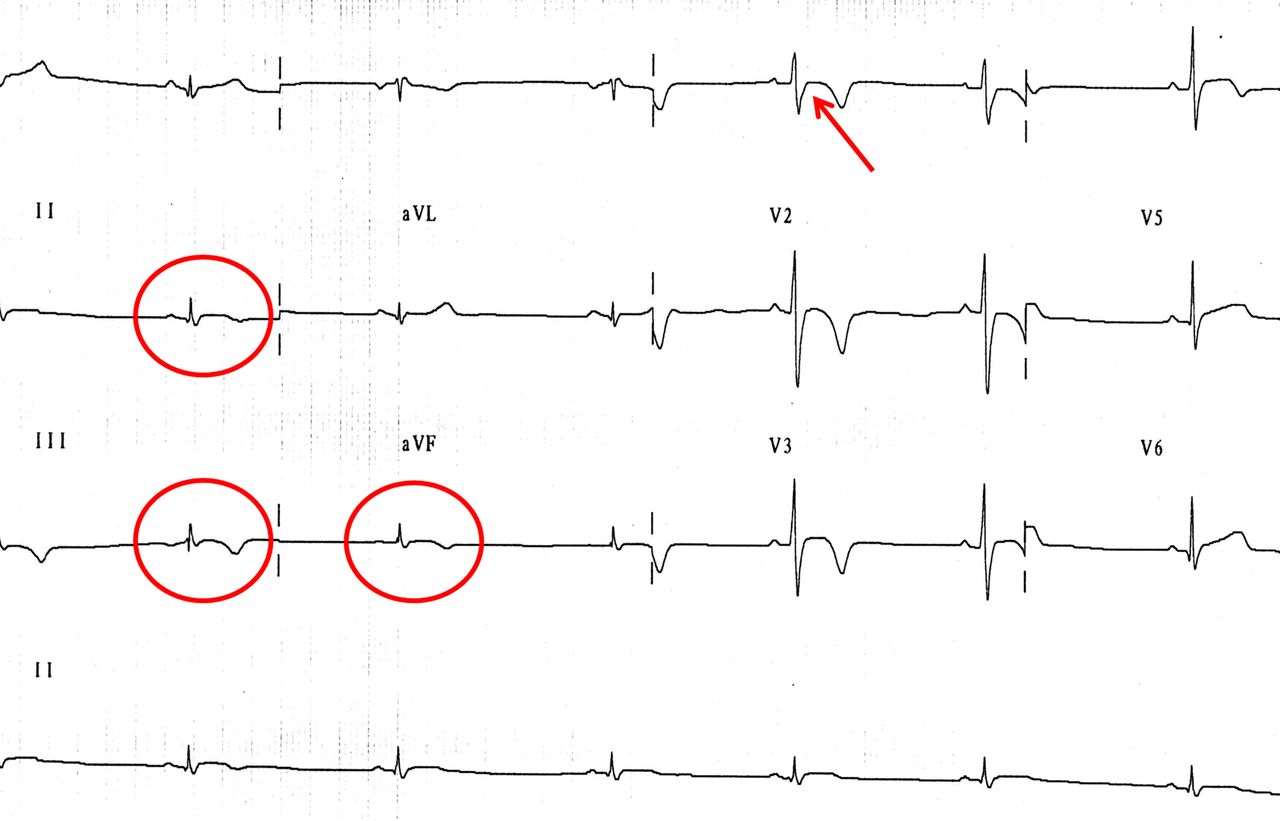
ECG from a patient with arrhythmogenic right ventricular cardiomyopathy showing delayed S wave upstroke in V1 (arrow), low voltages in limb leads < 5 mm (circles) and inverted T waves in anterior precordial leads (V1–V4) and inferior leads (III and aVF). This figure is only reproduced in colour in the online version.
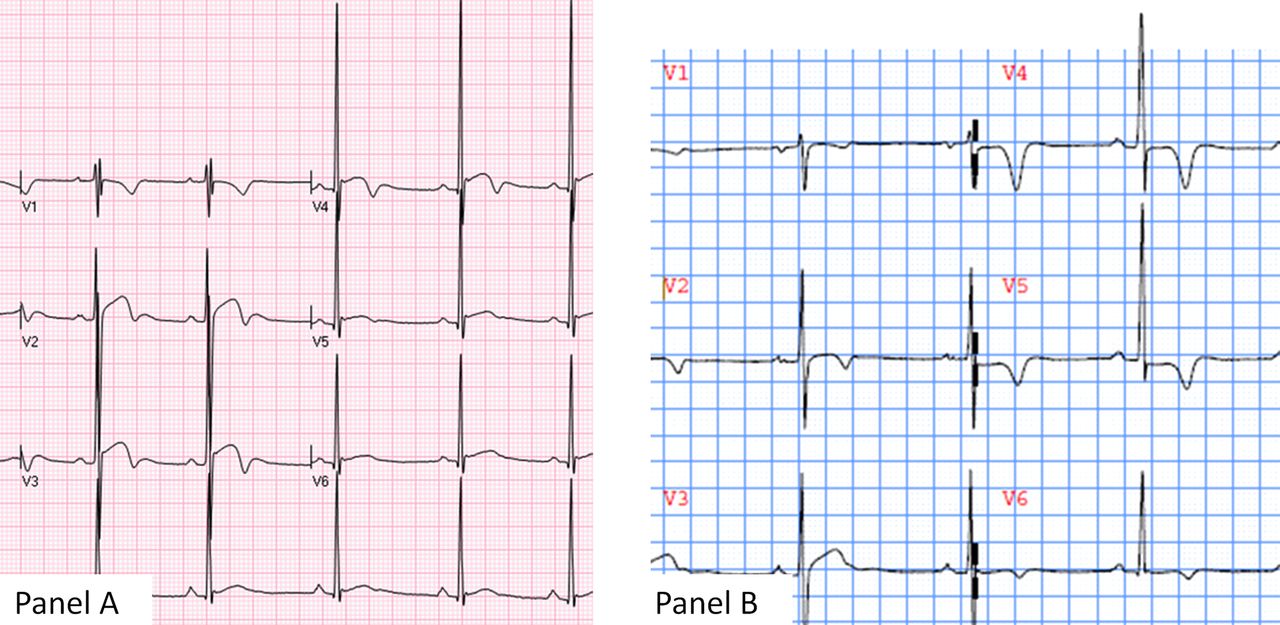
In some cases, IRBBB may be confused with a Brugada-ECG pattern, which is characterised by a high take-off and downsloping ST segment elevation followed by a negative T wave in ≥2 leads in V1–V3.22 Unlike the R′ wave in IRBBB, the ‘J wave’ seen in a Brugada-ECG pattern does not indicate delayed RV activation, but reflects early repolarisation with J point elevation and a high take-off with downsloping ST segment followed by a negative T wave (figure 10).

(A) Brugada-ECG pattern mimicking IRBBB. The ‘J wave’ (arrows) of Brugada-ECG is confined to right precordial leads (V1 and V2) without reciprocal ‘S wave’ (of comparable voltage and duration) in leads I and V6 (arrowheads). (B) IRBBB in a trained athlete. The RV conduction interval is mildly prolonged (QRS duration=115 ms) with a typical rSR′ pattern in V1 (arrow). Note also the reciprocal ‘S wave’ in V6 (arrow).
Early repolarisation
Early repolarisation is an ECG pattern consisting of ST elevation and/or a J wave (distinct notch) or slur on the downslope of the R wave (figure 11). Traditional examples of early repolarisation referred to ST elevation, but newer definitions also include J waves or terminal QRS slurring (figure 12).23
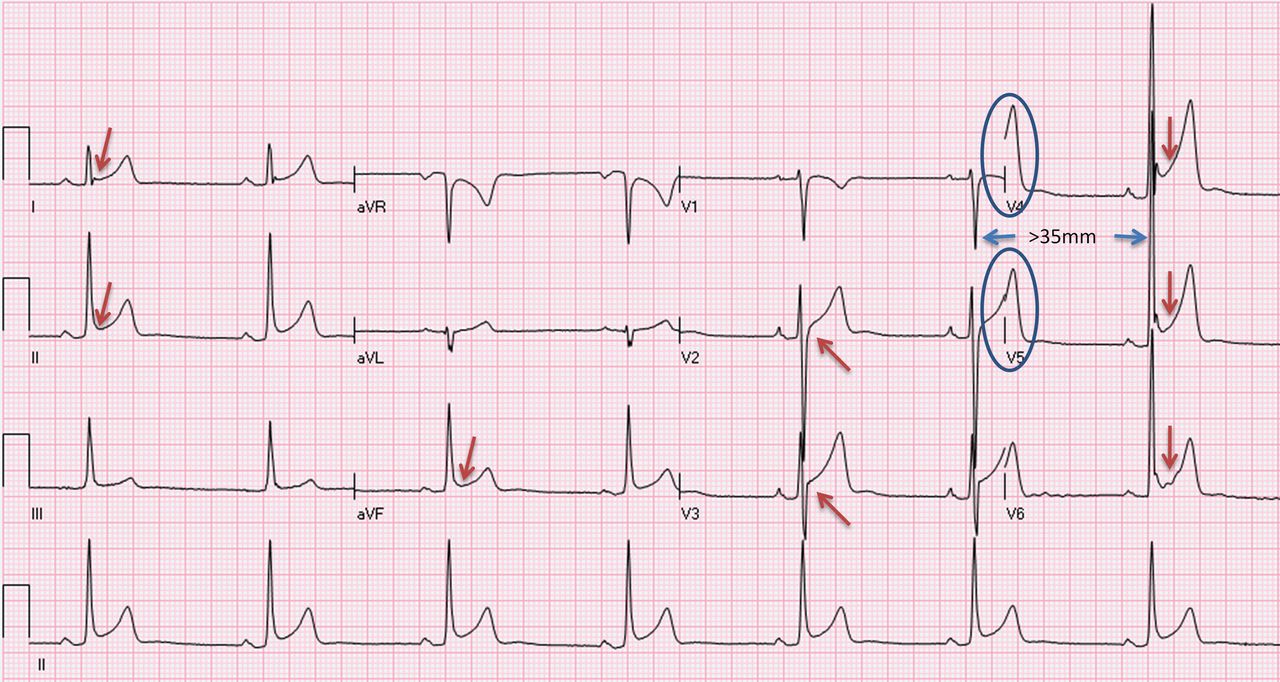
ECG from a 29-year-old asymptomatic soccer player demonstrating early repolarisation (J-point and ST elevation) in I, II, aVF, V2–V6 (arrows) and tall, peaked T waves (circles). These are common, training-related findings in athletes and do not require more evaluation. This figure is only reproduced in colour in the online version.

(A and B) Classic definition of early repolarisation based on ST elevation at QRS end (J-point). Examples without (A) and with (B) a J wave. (C and D) New definitions of early repolarisation showing slurred QRS downstroke (C) and J-wave (D) without ST elevation.
Early repolarisation is a common finding in trained athletes and considered a benign ECG pattern in apparently healthy, asymptomatic individuals.24 ,25 Depending on how it is defined, early repolarisation is reported in up to 35–91% of trained athletes and is more prevalent in young males and black/Africans.12 ,13 ,25 ,26 Early repolarisation is most common in the precordial leads but can be present in any lead.27–29 Commercially available computer diagnostic ECG programmes commonly misreport early repolarisation patterns in athletes as acute ischaemia/myocardial infarction or pericarditis.
The early repolarisation pattern in athletes typically involves a concave and ascending/upward ST segment elevation.24 ,28 Late QRS slurring or notching with horizontal ST segment elevation in the inferolateral leads has been associated with an increased risk of arrhythmic death in one study of middle-aged, non-athletic Finnish citizens.30 However, a significant percentage of young competitive athletes (25–30%) show early repolarisation with similar morphological features in either the inferior or lateral leads.27–29 These findings are more common in athletes at times of peak fitness, suggesting early repolarisation is a dynamic process and is at least in part a direct result of exercise training.29 To date, no data support the presence of an association between early repolarisation and SCD in athletes. Although further investigation is warranted to fully characterise the prognostic implications of early repolarisation in competitive athletes, all patterns of early repolarisation, including inferolateral subtypes, should be considered normal variants in athletes.24
QRS voltage criteria for LVH
The most commonly used voltage criterion for LVH is the Sokolow-Lyon index. However, ECG QRS voltage may not be a reliable predictor of LVH. The limitation of the ECG in identifying ventricular hypertrophy is due to the reliance of measuring the electrical activity of the heart by electrodes on the surface of the body. Consequently, anything between the left ventricular myocardium and the surface electrodes will affect the voltage. ECG QRS voltage, therefore, can be influenced by a variety of factors other than LV size or mass. Males, athletes and black/African individuals have higher QRS voltage, while obesity, older age and pulmonary disease may cause lower voltage.31
The goal of identifying clinically relevant LVH by voltage criteria alone is particularly problematic in children. The standards for QRS voltage have been derived from studies of populations of clinically normal children. Furthermore, the limited studies do not consistently include referencing to body size, gender or ethnicity. Lastly, correlation with echocardiography is limited, and reference standards from autopsy or MRI are not available.31
In athletes, intensive conditioning is also associated with morphological cardiac changes of increased cavity dimensions and wall thickness that are reflected on the ECG. These changes constitute physiological LVH in trained athletes and usually manifests as an isolated increase in QRS amplitude (figure 13).32 ECGs with increased QRS amplitudes meeting ECG voltage criteria for LVH are prevalent and present in up to 45% of athletes and 25% of sedentary young adults.11 ,14 As a result, the accuracy of increased QRS voltage as an indicator of pathological LVH is poor.
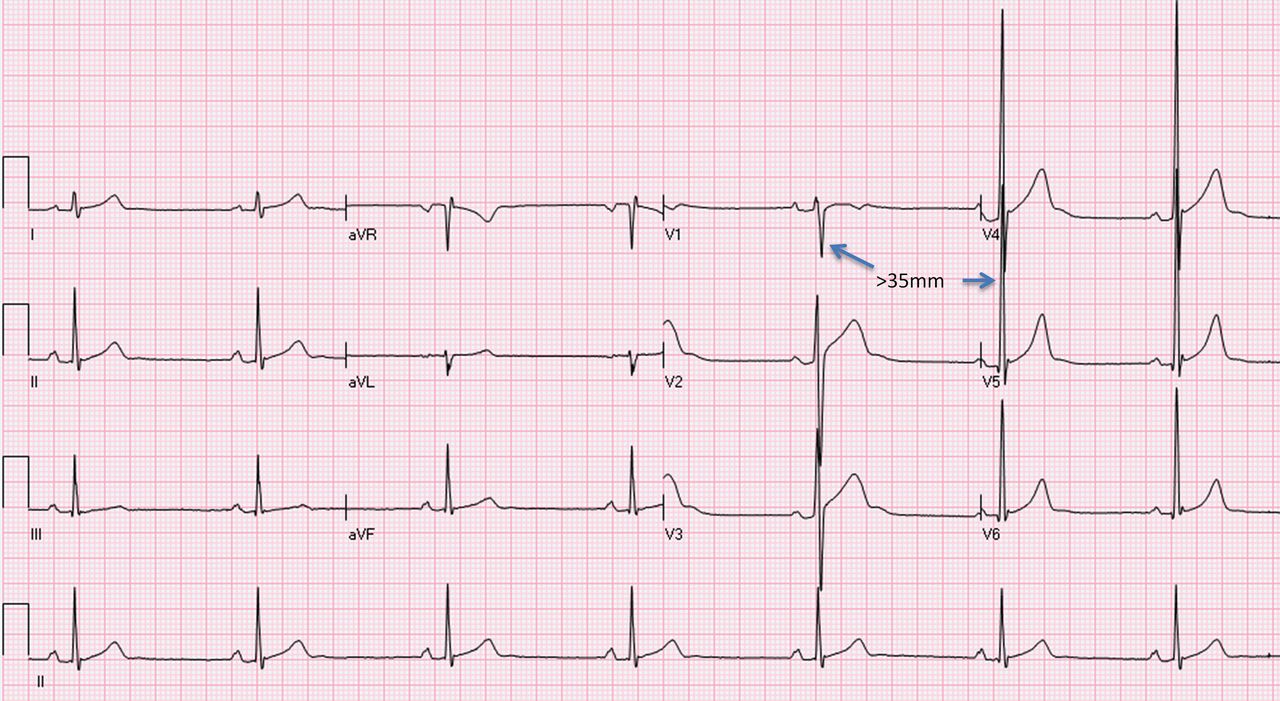
ECG from a 19-year-old asymptomatic soccer player demonstrating voltage criteria for left ventricular hypertrophy (S-V1+R-V5>35 mm). Note the absence of left atrial enlargement, left axis deviation, ST depression, T wave inversion, or pathological Q waves. Increased QRS amplitude without other ECG abnormalities is a common finding in trained athletes and does not require additional testing. This figure is only reproduced in colour in the online version.
Increased QRS voltage and HCM
Several studies have evaluated athletes and young adults with isolated increased QRS voltage using echocardiography or cardiac MRI and none had hypertrophic cardiomyopathy (HCM).11 ,14 ,33–35 Furthermore, increased QRS voltage in the absence of other ECG abnormalities is uncommon in subjects with HCM being present in less than 2% of individuals with the disease.36 However, when other ECG abnormalities such as ST depression, T wave inversion, pathological Q waves, left axis deviation or left atrial abnormalities are present, the possibility of HCM should be investigated by additional testing (figure 14). Therefore, isolated increased QRS voltage on the ECG in the absence of other abnormalities in an asymptomatic athlete with a negative family history is not a reliable indicator of LVH or HCM and does not require further evaluation.
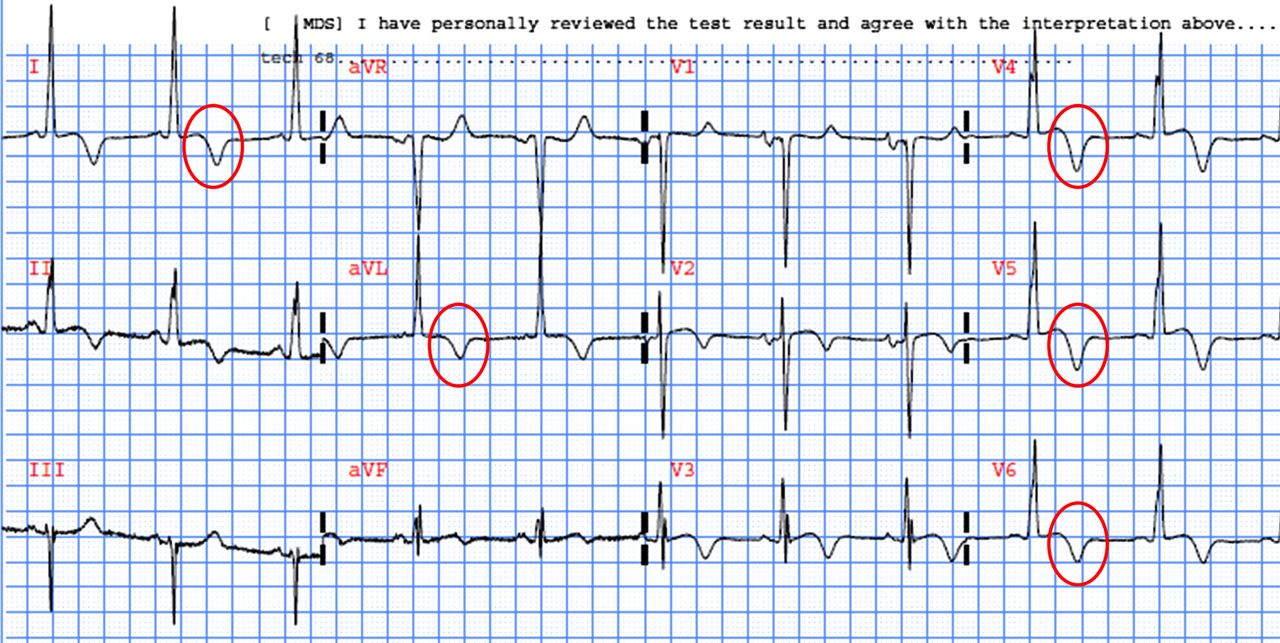
Abnormal ECG from a patient with hypertrophic cardiomyopathy. In addition to voltage criteria for left ventricular hypertrophy, note the deep T wave inversions extending to the lateral leads (I and aVL, V5–V6). These findings are abnormal, not related to regular training and require additional evaluation. This figure is only reproduced in colour in the online version.
Repolarisation findings in black/African athletes
Growing attention has been paid to ethnic-related differences in morphological and ECG features of the athlete's heart. Notably, there are specific repolarisation patterns in black/African athletes that are normal variants and should be distinguished from abnormal findings suggestive of a pathological cardiac disorder.
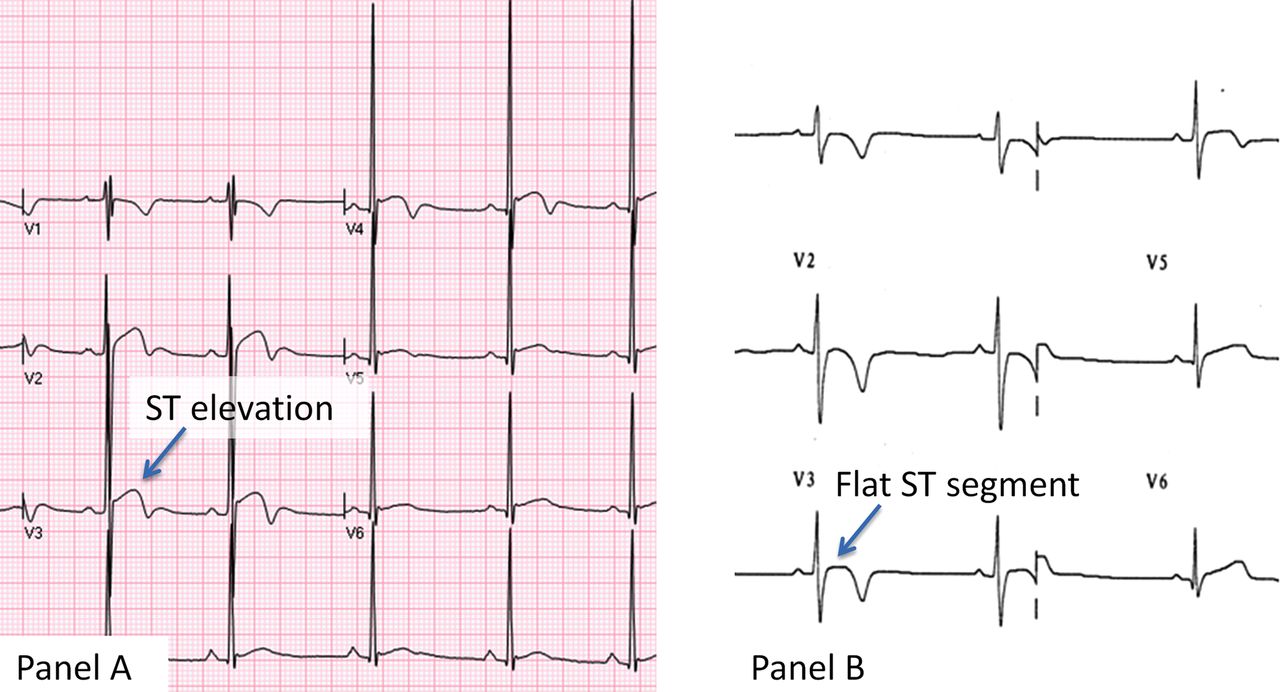
As aforementioned, early repolarisation is common in athletes and usually characterised by an elevated ST segment with upward concavity, ending in a positive (upright ‘peaked’) T wave (figure 11). There is also a normal variant early repolarisation pattern found in some black/African athletes, characterised by an elevated ST segment with upward convexity (‘dome’ shaped), followed by a negative T wave confined to leads V1–V4 (figure 15). The presence of either repolarisation pattern in an asymptomatic black/African athlete does not require additional testing.
ECG from a 24-year-old asymptomatic black/African soccer player demonstrating ‘domed’ ST elevation followed by T wave inversion in leads V1–V4 (circles). This is a normal repolarisation pattern in black/African athletes. This figure is only reproduced in colour in the online version.
Differentiating normal repolarisation variants from pathological findings
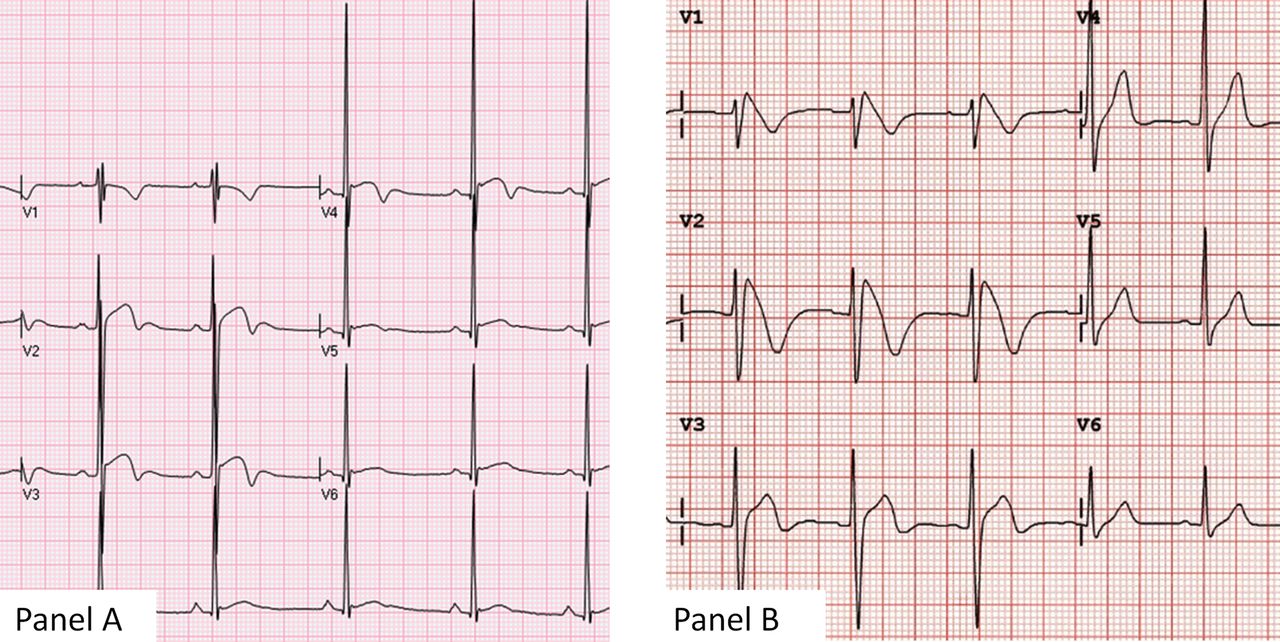
The presence of early repolarisation and T wave inversion in the anterior leads in black/African athletes probably represents a specific, ethnically dependent adaption to regular exercise. More than two-thirds of black athletes exhibit ST segment elevation and up to 25% show T wave inversions.12 ,13 However, normal repolarisation changes in black/African athletes do not extend beyond V4. Thus, T wave inversion in the lateral leads (V5–V6) is always considered as an abnormal finding and requires additional testing to rule out HCM or other cardiomyopathies (figure 16).

(A) Normal variant repolarisation changes in a black/African athlete characterised by domed ST segment elevation and T wave inversion in V1–V4. (B) Pathological T wave inversion and ST depression in the lateral leads. T wave inversion in V5–V6 is always an abnormal finding and requires additional testing to rule out cardiomyopathy. This figure is only reproduced in colour in the online version.
Repolarisation variants in black/African athletes also must be distinguished from pathological repolarisation changes in the anterior precordial leads found in ARVC and Brugada-pattern ECGs. In ARVC, the ST segment is usually isoelectric prior to T wave inversion, in contrast to the ‘domed’ ST segment elevation which is the hallmark feature of the normal repolarisation variant in black/African athletes (figure 17). In Brugada-pattern ECGs, the high take-off and downsloping ST segment prior to T wave inversion distinguishes this from the ‘domed’ ST segment elevation preceding the negative T wave in black/African athletes (figure 18). Pathological repolarisation changes in the anterior precordial leads suggesting either ARVC or Brugada-pattern require additional testing.

(A) Normal variant repolarisation changes in a black/African athlete characterised by domed ST segment elevation and T wave inversion in V1–V4. (B) Pathological T wave inversion in V1–V3. Note the isoelectric ST segment. The absence of ST segment elevation prior to T wave inversion makes this ECG abnormal. Additional testing is required to rule out arrhythmogenic right ventricular cardiomyopathy. This figure is only reproduced in colour in the online version.

(A) Normal variant repolarisation changes in a black/African athlete characterised by domed ST segment elevation and T wave inversion in V1–V4. (B) A downsloping ST segment elevation followed by T wave inversion in V1–V2 suggestive of a Brugada-pattern ECG. Note the high-take off and absence of upward convexity (‘dome’ shape) of the ST segment distinguishing this from the repolarisation variant in black/African athletes. This figure is only reproduced in colour in the online version.
Conclusions
Fundamental to the cardiovascular care of athletes is an understanding of the physiological cardiac adaptations in athletes that are manifested on the ECG. The ECG can provide valuable information when interpreted properly, accounting for the electrical and structural changes that are a common result of regular training. Distinguishing ECG findings related to athlete's heart from changes suggestive of an underlying pathological disorder is critical to the identification of athletes at risk of SCD.
Additional resources
For a free online training module on ECG interpretation in athletes, please visit:http://learning.bmj.com/ECGathlete. For the November 2012 BJSM supplement on ‘Advances in Sports Cardiology’, please visit:http://bjsm.bmj.com/content/46/Suppl_1.toc.
References
Footnotes
-
Competing interests None.
-
Provenance and peer review Commissioned; internally peer reviewed.
-
▸ References to this paper are available online at http://bjsm.bmjgroup.com