Article Text

Abstract
This review systematically summarises factors associated with patellofemoral pain syndrome (PFPS). A systematic literature search was conducted. Studies including ≥20 patients with PFPS that examined ≥1 possible factor associated with PFPS were included. A meta-analysis was performed, clinical heterogeneous data were analysed descriptively. The 47 included studies examined 523 variables, eight were pooled. Pooled data showed a larger Q-angle, sulcus angle and patellar tilt angle (weighted mean differences (WMD) 2.08; 95% CI 0.64, 3.63 and 1.66; 95% CI 0.44, 2.77 and 4.34; 95% CI 1.16 to 7.52, respectively), less hip abduction strength, lower knee extension peak torque and less hip external rotation strength (WMD –3.30; 95% CI –5.60, –1.00 and –37.47; 95% CI –71.75, –3.20 and –1.43; 95% CI –2.71 to –0.16, respectively) in PFPS patients compared to controls. Foot arch height index and congruence angle were not associated with PFPS. Six out of eight pooled variables are associated with PFPS, other factors associated with PFPS were based on single studies. Further research is required.
Statistics from Altmetric.com
Introduction
The most frequently diagnosed condition in adolescents and adults with knee complaints is patellofemoral pain syndrome (PFPS).1 A general practitioner (GP) registers (on average) five or six patients a year with PFPS and women have a higher incidence than men.2 ,3 In sports medicine PFPS is diagnosed in about 25% of all running injuries.4 Treatment for PFPS is especially promising for the short term; long-term results for treatment of PFPS are less successful.1 ,5 ,6 After 7 years, 30% of the non-recovery PFPS patients had persistent complaints.6
PFPS is a commonly used term to describe a condition of anterior knee pain, which covers all the problems related to the anterior part of the knee.7 Although there is no consensus on the terminology, various synonymous are used for PFPS.8 ,9 PFPS is commonly described as a pain in/around the patella. This pain increases after prolonged sitting, squatting, kneeling and stair climbing.10
It is suggested that the aetiology of PFPS is multifactorial.1 ,7 However, there is no agreement with regard to which factors contributing to or relating to PFPS.11 The risk factors for PFPS are outlined in a systematic review on risk factors for PFPS.12 This review concludes that being women and having lower knee extension strength in both men and women seem to be risk factors for the future development of PFPS. However, only seven studies were included in this review and the majority of the research done on factors associated with PFPS is done by case–control studies. Several case–control studies also described the association between PFPS and muscle strength, but malalignment, LE muscle imbalance, delayed onset of vastus medialis obliquus (VMO), overuse, trauma, cartilage damage, muscular flexibility and vascular disturbance are also discussed as possible causes for PFPS.7 ,13–19 Two systematic reviews have summarised the available evidence for kinematic gait characteristics and for the VMO and vastus lateralis (VL) timing.20 ,21 Another review, focusing on hip muscle weakness, concludes that females with PFPS demonstrate a decrease in abduction, external rotation and extension strength compared to controls.22 However, there is a lack in overview of all the factors studied in case–control studies and therefore there is need for one review encompassing all factors.
The lack of a clear classification of the factors contribute to or are related to PFPS could be a possible reason for the less successful outcomes of long-term complaints in patients with PFPS. Therefore, the aim of this study is to systematically summarise the factors associated with PFPS, described in case–control studies.
Methods
Criteria for considering studies for this review
Type of studies
Case–control or cross-sectional studies writing in English, French, German, Swedish or Dutch, including a minimum of 20 patients with PFPS, were eligible. The choice of including studies with a minimum of 20 patients with PFPS was primarily based on the likeliness of publication bias occurring in case–control studies with small numbers of subjects. To reduce this chance, studies with <20 patients with PFPS were excluded.
Type of participants
Adolescents and adults suffering from PFPS and not receiving operative treatment or arthroscopy were included. Owing to the lack of consistent terminology for PFPS, all definitions for PFPS and its synonyms were included. Patients with chondromalacia patella (CP) were included if the authors intended CP to be a description for PFPS. Studies focusing on other named knee pathologies (such as Osgood Schlatter disease, Sinding Larsen-Johansson's disease, tendinitis or bursitis, plural of neuroma's (sic), intra-articular pathologies, plica syndromes and more rarely occurring pathologies) were excluded. No limitations on age and setting were applied.
Type of outcome measurement
Only studies including at least one possible factor associated with PFPS were included in this review.
Search for relevant studies
The primary search was conducted in Pubmed (MEDLINE), Embase, Web of Science (WoS), MEDLINE (OVID) and the Cochrane Central Register up to 3 of November 2010. The following keywords were used: Arthralgia AND knee joint OR anterior knee pain OR (patell* OR femoropatell* OR femoro-patell* OR retropatell*) AND (pain OR syndrome OR dysfunction) AND risk factor OR association OR relative risk OR. Supplementary online appendix 1 presents the full Pubmed, Embase, WoS and MEDLINE (OVID) search. References of included studies, but also of excluded studies due to the small sample size and systematic reviews on patellofemoral pain, were screened for relevant citations.
Data collection and analysis
Selection of studies
Two reviewers (NL and MM) independently selected the articles based on title and abstract, according to the criteria. For the selected references a final decision about inclusion was made based on the full-text article. These articles were reviewed independently. In the case of disagreement, conditions of entrance were discussed until consensus was reached.
Methodological quality
A quality assessment list was created using criteria from the Dutch Cochrane Centre (http://www.cochrane.nl/en/index.html). Table 1 presents the criteria for the quality score: the list is divided into three topics with a total of eight items. Two reviewers (NL and MM) independently measured the quality of the studies by scoring each of the study criteria as ‘positive’, ‘unclear’ or ‘negative’. Positive scored criteria received one point. Disagreements were solved by discussion and Cohen's kappa was calculated to measure inter-rater agreement. The quality score of each study was calculated by summing up the total number of positive criteria.
Quality assessment list
Data extraction
One reviewer (NL) extracted relevant data from the studies. Information on study design (type of study, author and year of publication), study population (number of cases/controls enrolled and analysed), characteristics of the groups (gender, age and definition of PFPS), definition of the factors investigated and assessment method were extracted, applying a standardised form. Other comments that could not be arranged within the items described above, and might be important for this review, were described in ‘notes’.
Studies are presented in the following sub-divisions: static measures, kinematic measures, kinetic measures, muscle function measures and other measures.
Statistical analysis
A meta-analysis was performed to establish factors associated with PFPS that had a consistent definition, and whether results were reported for the same outcome measures. Statistical heterogeneity was tested with the χ2 and I2 test. We chose for a random effects model for inspection of the forest plot. Weighted mean differences (WMD) with matching 95% CI were calculated for the pooled data. For the meta-analysis the software package Review Manager 5 was used. If a meta-analysis was not possible due to clinical heterogeneity, data were analysed descriptively. For the articles that supplied adequate data, the mean difference (MD) with matching 95% CI was calculated. If the SD was not reported, we estimated the SD comparing MD's and group sample sizes (PFPS and control group) of comparable studies. For dichotomous data OR or relative risk (RR) with matching 95% CI was calculated or abstracted from the individual studies. If a meta-analysis was not possible due to clinical heterogeneity, data were analysed descriptively. If separate data were present for both legs, only the data from the symptomatic leg in the case group were extracted. In the control group random data from one leg were extracted. If data were presented in figure form or were missing (eg, SD), the corresponding author was contacted and was asked for the raw original data. If the corresponding author did not have the raw data or did not respond, we measured the mean outcomes with (if given) accompanying SD.23 Significant differences were based on calculated MDs with matching 95% CI. If studies did not provide sufficient information to calculate the 95% CI, information on significant differences (p<0.05) between the groups were extracted from the studies (supplementary online appendix 2).
Results
Characteristics of the included studies
The database search resulted in 4664 potentially relevant articles. From titles and abstracts, 213 articles were extracted for full-text review (this was not possible for three articles). A total of 47 studies met the inclusion criteria (figure 1).13 ,20 ,24–72 Multiple publications with identical data were found for Dierks et al,31 ,73 Jensen et al,36 ,66 Powers et al50 ,69 and Willson et al,57 ,71 ,72 combined information were used for the quality measurement and data extraction. But only the most prominent or first published articles were used for citation of these studies (supplementary online appendix 3).
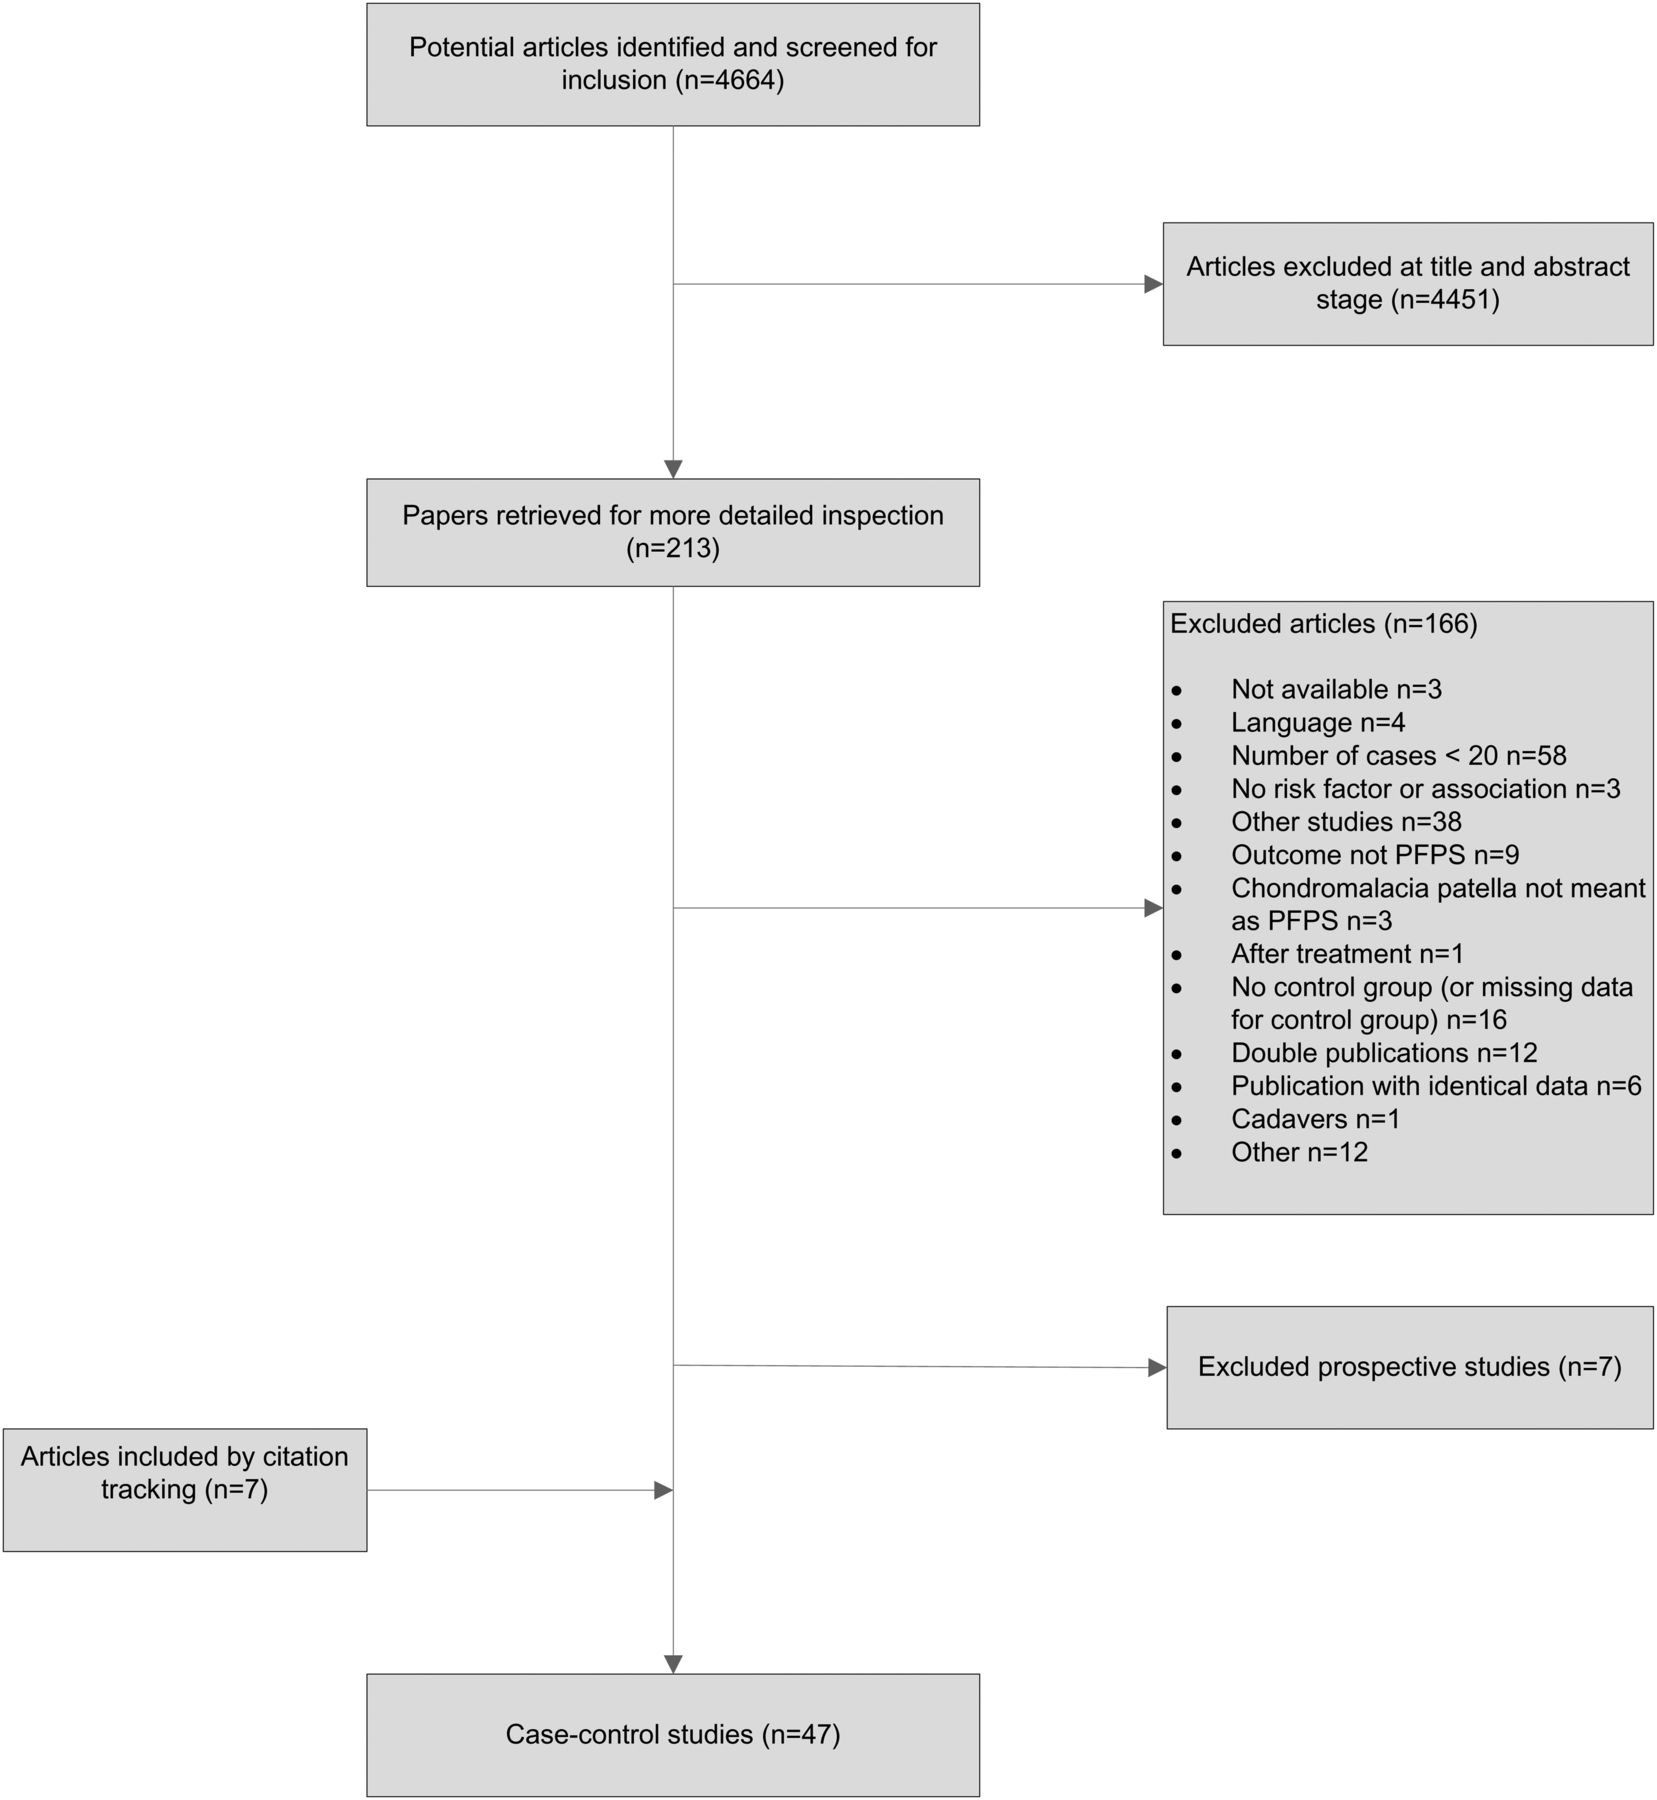
Flow-chart of the process to select the relevant studies. This figure is only reproduced in colour in the online version.
Methodological quality
The two reviewers agreed on 88% of the items among the 47 included studies (332 from 376 items). All initial disagreements were discussed until a consensus was reached. The quality score ranged from 2 to 7 and the median quality score for the 47 studies was 6. Only 12 studies scored positive on item 2 including more than 50 cases and 34 studies (72%) scored positive on the representativeness of the study population. Remarkable was that all studies described a clear definition of outcome measure (variable that might be associated with PFPS), except for the study from Al-Rawi et al.61 In only five studies the outcome assessor was blinded on health status (PFPS versus controls) of the subjects20 ,37 ,39 ,46 ,61 (table 2).
Methodological quality
Factors associated with PFPS
Static measures
Foot and ankle characteristics
Foot and ankle characteristics were reported in seven studies, including 47 variables.20 ,24 ,31 ,40 ,54 ,58 ,65 The ratio of the dorsum height (at 50% foot length) divided by the truncated foot length, expressed as the arch height index, was measured in three studies31 ,54 ,58 and pooling was possible for two.31 ,58 No association between arch height index and PFPS was found after pooling (WMD 0.01; 95% CI −0.01 to 0.03) (figure 2)31 ,58 and Thomeé et al54 also found no significant difference between both study groups. Ten variables for the measurement of foot posture in PFPS patients were reported in one study. A significantly greater pronated foot posture in relaxed stance was found in PFPS patients compared to controls in eight measurement methods (supplementary online appendix 2).20 No significant difference was found between the number of PFPS patients with pes cavus or pes planus and the control subjects.65 Three variables for static rear foot angles were described in one study and data for men and women were reported separately; however, none were significantly different.40

Forest plot: association patellofemoral pain syndrome and arch height index. This figure is only reproduced in colour in the online version.
Leg length differences
Two studies examined leg length differences between PFPS patients and control subjects expressed by five variables.58 ,61 Absolute and relative leg length differences were measured in one study. Both were not associated with PFPS.58 Leg length differences of half till 1 cm, shorter or longer, in the dominant leg were not associated with PFPS as well as no differences in leg length at all.61
Q-angle in weight bearing position
Nine studies described the relation between quadriceps angle (Q-angle) and PFPS.28 ,34 ,47 ,48 ,54 ,57 ,58 ,60 ,65 Pooled data showed a significantly larger Q-angle in the PFPS group compared to the control group (WMD 2.08 95% CI 0.64 to 3.63) (figure 3) Significantly more PFPS patients had a Q-angle larger than 20° (p value <0.001) compared to controls in one study.65 Another study examined the Q-angle at 0° and at 30° knee flexion and found no difference in Q-angle between PFPS patients and controls in both measurements.54

Forest plot: association patellofemoral pain syndrome and Q-angle in weight-bearing position (°). This figure is only reproduced in colour in the online version.
Malalignment
Misalignments by genu varum and genu valgum were not associated with PFPS in one study.65
Patella
Differences in physical examination and radiographic examination of the patella between PFPS patients and controls were examined in 12 studies, including 39 variables.13 ,33 ,37–39 ,45 ,50 ,52 ,55 ,60 ,64 ,65 Pooling was possible for three variables. Pooled data showed that PFPS patients had a significantly larger patellar tilt angle (WMD 4.34 95% CI 1.16 to 7.52) (figure 4) and a significantly larger sulcus angle (WMD 1.61 95% CI 0.44 to 2.77) (figure 5). After pooling no significant difference was found between congruence angle in PFPS patients and controls (figure 6). Due to missing data, the study from Eckhoff et al, was not pooled. However, this study also found no association between the sulcus angle and congruence angle and PFPS.33 Three studies evaluated the association between bisect offset and PFPS, and conflicting results are found.50 ,52 ,64 In one study PFPS patients had a greater bisect offset compared with controls (MD 0.07 95% CI 0.01 to 0.13)52 and in another study 10% larger differences in bisect offset were found between PFPS patients and controls during knee flexion between 0° and 50° (p value: 0.03).64 No association between bisect offset and PFPS was found in the study by Powers et al.50

Forest plot: association patellofemoral pain syndrome and patellar tilt angle (°). This figure is only reproduced in colour in the online version.

Forest plot: association patellofemoral pain syndrome and sulcus angle (°). This figure is only reproduced in colour in the online version.

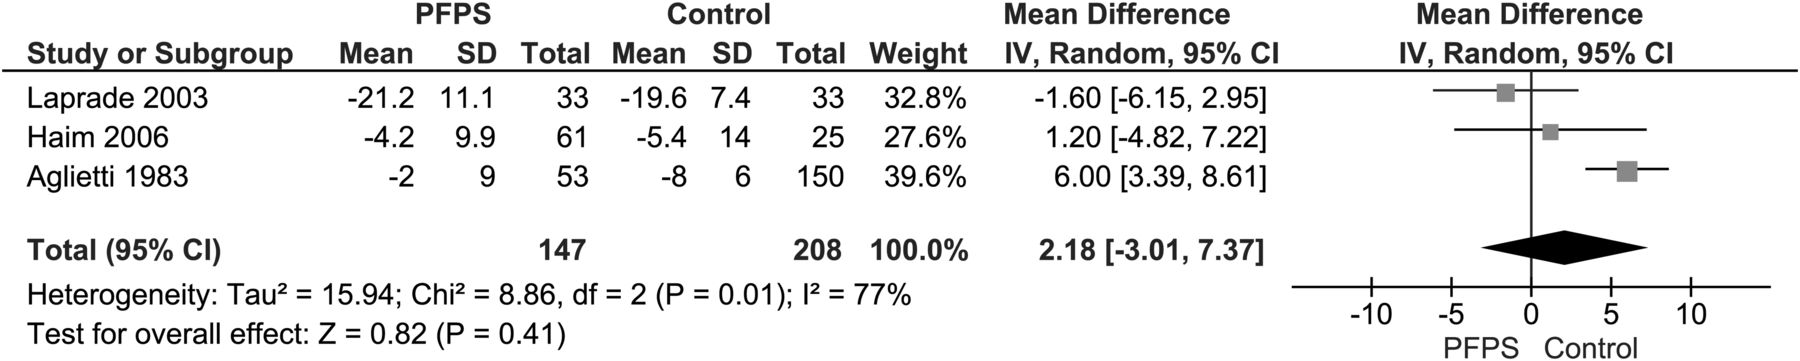
Forest plot: association patellofemoral pain syndrome and congruence angle (°). This figure is only reproduced in colour in the online version.
Salsich et al also evaluated the contact area of total patellofemoral joint, representing the length of cartilage contact on the medial and lateral facets and patellar width, using MRI. Both were significantly smaller in the PFPS group compared to the control group (MD −28.70; 95% CI −54.59, −2.81 and −2.90; 95% CI −4.85 to −0.95, respectively).52 Significantly more PFPS patients had patellar glide as a percentage of patellar width compared to controls in one study (−8.00 95% CI −14.6 to −1.40).65 Patellar height ratio was significantly greater in PFPS patients compared to controls when measured with the Insall-Savati method (0.04 95% CI 0.01 to 0.07), although no association between patellar height ratio and PFPS was found when this was measured with the Blackburne method.60 In one study PFPS patients had an increased lateral and medial retinacular sensitivity (OR 88.7 95% CI 17.1 to 459.9 and OR 21.90 95% CI 4.70 to 102.0, respectively), and increased patellofemoral crepitations (OR 27.5 95% CI 5.85 to 128.9) compared to controls. In the same study the patellar tracking instability test was positive in 25% of the PFPS patients compared with none of the controls (p value: 0.004).65 The pulsatile blood flow in the patella before and after passive knee flexion (90°) was investigated in one study. A significant reduction of blood flow in the patella after passive knee flexion was found in PFPS patients compared to controls (p<0.0002).45 The presence of articular cartilage lesions of the patella was examined by Joensen et al37 and significantly more lesions were found in patients with PFPS compared to controls (OR 7.9; 95% CI 1.9 to 33). The articular cartilage thickness was examined by Draper et al13 and data for male and females were presented separate. In male PFPS patients the superior cartilage thickness was significantly lower compared to male control subjects (MD males: −0.90 95% CI −1.78 to −0.02). Keser et al38 reported a significantly higher incidence of trochlear dysplasia in knees of the patients with PFPS compared to the knees of the controls (OR 7.12; 95% CI 1.6 to 31.7) and significantly less lateral trochlear inclination in PFPS patients compared to controls (MD −4.20; 95% CI −6.04 to −2.36). None of the other evaluated variables were associated with PFPS.13 ,33 ,39 ,55 ,60 ,64 ,65
Angles
Static LE angles were evaluated by 18 variables in eight studies.33 ,44 ,47 ,48 ,52 ,54 ,58 ,71 One study described a significantly smaller tibial tubercle rotation angle in PFPS patients compared to controls (MD −2.50; 95% CI −4.56 to −0.44).44 Another study reported a statistically significant greater hip external rotation angle and smaller hip internal rotation angle in PFPS subjects compared to controls (p<0.001 and p=0.01, respectively).48 Knee hyperextension angle was significantly greater in PFPS patients compared to controls (MD 2.40; 95% CI 1.25 to 3.55) in Thomeé et al.54 No other significant differences were found among the 14 studied variables.33 ,44 ,47 ,48 ,52 ,54 ,58
Chararacteristics of vastus medialis obliquus muscle
Insertion level, fibre angle and volume of VMO muscle were evaluated in one study, and all were significantly smaller in PFPS patients compared to controls (table 3).35
Significant different variables between both groups in the individual studies
Characteristics of quadriceps muscles
In one study quadriceps atrophy was examined expressed as the quadriceps cross-sectional area, no significant differences between the PFPS patients and control group were found.63
Kinetic measures
Foot and ankle characteristics
Three studies examined a total of 31 variables for dynamic rear foot motion during running and stair descending.24 ,31 ,58 One study reported a larger contact area of medial and mid-foot rear foot and lower peak pressure in the rear foot expressed by six variables in PFPS patients compared to controls during stair descending (table 3).24 Duffey et al reported lower pronation velocity expressed in two variables in PFPS patients compared to controls (table 3).58 In this study, PFPS patients had also a significant less calcaneus-tibia touchdown angle (MD 2.80 95% CI 0.46 to 5.14) and less foot pronation angle during first 10% of stance during running (MD −1.30; 95% CI −2.27 to −0.33) compared to controls.58
Ground reaction force
Two studies examined 21 variables for ground reaction force during running, single leg squat and single leg jump.57 ,58 Only a significantly lower maximum lateral force during running in the PFPS group compared to the control group was found in one study (MD −0.09; 95% CI −0.11 to −0.07).58
Peak moments
Peak moments in LE muscle were examined by eight variables.26 ,53 ,57 Only knee flexion-extension moment during running was significantly lower in the PFPS group compared to the control group in one study (MD −0.38; 95% CI −0.64 to −0.12).26
Peak torques
The peak torques of the LE muscles were examined in five studies, including 30 variables.27 ,56 ,58 ,63 ,70 Peak torques were expressed in Newton metre (Nm) per unit of time. Pooling was possible for one variable; PFPS patients had a significantly lower knee extension peak torque at 60° (Nm) compared to control subjects (WMD: −37.47 95% CI −71.75 to −3.20) (figure 7).56 ,58 In four studies PFPS patients had a significantly lower peak torque compared to controls expressed by 14 variables (table 3).56 ,58 ,63 ,70 No significant associations were found among the other 15 studied variables.27 ,58
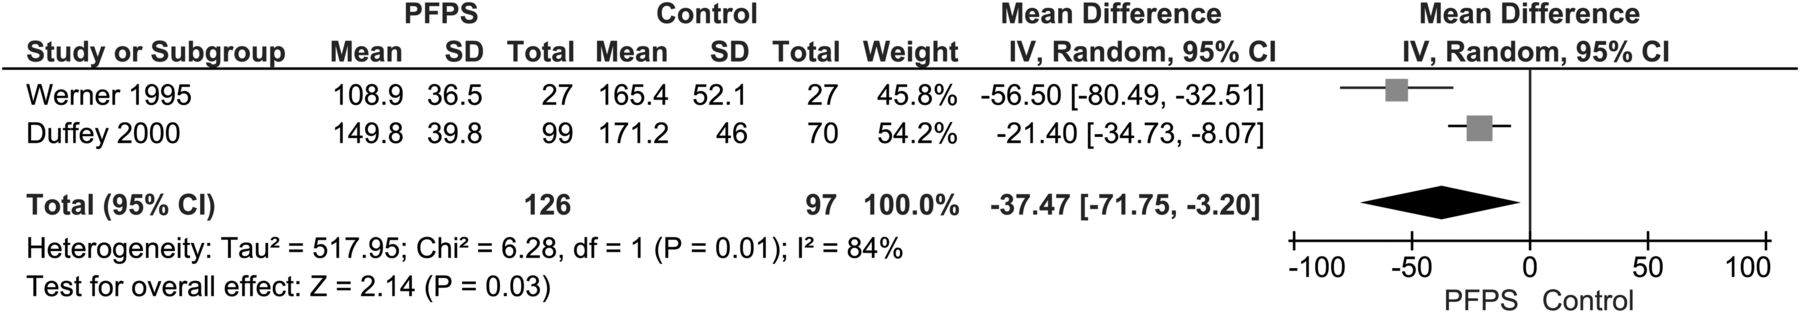
Forest plot: association patellofemoral pain syndrome and peak torque knee extension 60° (Nm). This figure is only reproduced in colour in the online version.
Kinematic measures
Patella
Patella joint kinematics and mobility were described by 15 variables.41 ,46 ,65 In one study no statistical significant associations were found for patella joint kinematics and PFPS.46 Another study included PFPS patients without malalignment and a subgroup of PFPS patients with malalignment and evaluated the difference in patella joint kinematics and mobility between these groups and the controls. Although no significant association was found between PFPS patients without malalignment compared to controls, the PFPS patients with malalignment had a more laterally shifted patella during flexion (p=0.049) and had a significantly lower rate of posterior shift during knee flexion compared to control subjects (p=0.01).41 In one study none of the control subjects had positive active patellar instability tested compared with 25% of the PFPS patients (p value: 0.004). The other five examined variables were not associated with PFPS.65
Angles
Six studies reported a total of 36 variables on dynamic LE angles.30 ,31 ,43 ,51 ,57 ,70 The dynamic LE angles were measured during different physical activities and two studies found smaller flexion angles expressed by eight variables for knee, hip adduction, hip internal rotation and frontal plane pelvis in PFPS patients compared to controls (table 3).30 ,57 Larger angles were found for hip adduction during single leg squat, hip abduction at peak knee extension moments during single leg jump (MD 3.84; 95% CI 0.85, 6.83 and 3.75; 95% CI 0.17 to 7.33, respectively),57 peak hip internal rotation during running and during step-down (MD 7.60 95% CI 4.14, 11.06 and 6.40 95% CI 1.85 to 10.95, respectively)70 and knee flexion at foot-step contact across different step heights (p=0.038)43 in PFPS patients compared to controls in two studies.43 ,57 Another study evaluated maximum knee flexion angle during free speed walking, fast walking, ramp descent, ramp ascent, stair ascending and stair descending expressed in seven variables; however none were significantly associated with PFPS.51
Velocity
Two studies measured velocities (degrees/second), described by 10 variables.31 ,62 One study measured the velocities for six joint motions, expressed in the maximum velocity that occurred during the stance phase while running. The joint motions for hip adduction and hip internal rotation velocity were significantly lower in PFPS patients compared to controls (MD −70.50; 95% CI −121.41, −19.59 and −71.50; 95% CI −135.73 to −7.27, respectively).31 PFPS patients were unable to perform a smoothly controlled eccentric quadriceps contraction during stair descent at slow velocities and knee angular velocities.62 No significant associations were found among the other five variables studied.31 ,62
Excursion
Fifteen variables for LE excursions were measured in two studies and calculated as the peak angle during the first half of stance minus the minimum angle preceding the peak during running,31 ,57 single leg squat and single leg jump.57 No significant association between LE excursion and PFPS were found in one study;31 however, a greater hip internal rotation excursion in PFPS patients compared to controls during a single leg squat (MD 3.50; 95% CI 1.21 to 5.79) and a lower knee internal rotation excursion (MD −2.70 95% CI −4.99 to −0.41) in PFPS patients compared to control subjects during single leg jump were found in another study.57
Peak stance-phase
Two variables tested the peak knee flexion in the stance phase and were significantly lower at heel-strike during stair ascent and descent in PFPS patients compared to the control participants (MD 6.0; 95% CI 0.6 to 11.4 and 5.5; 95% CI 1.7 to 9.4).30
Muscle function measures
Flexibility
Lower-extremity (LE) muscle flexibility was expressed by nine variables20 ,48 ,49 and five variables showed a significantly decreased flexibility of the LE muscles in PFPS patients (table 3).48 ,49 None of the other evaluated variables were significantly different between both study groups.20 ,49
Muscle strength
Muscle strength was described in six studies, including 33 variables.26 ,31 ,42 ,49 ,57 ,67 Pooling was possible for two variables. Pooled data showed less hip abductor strength (percentage body weight, %BW) (WMD −3.30; 95% CI −5.60 to −1.00) (figure 8)49 ,57 in PFPS patients compared to controls and less hip external rotation strength (%BW) (WMD −1.43; 95% CI −2.71 to −0.16) in PFPS patients compared to controls (figure 9).49 ,57 Less strength of the LE muscles was found in PFPS patients compared to controls in three studies, expressed by four variables (table 3).31 ,42 ,57 One study examined peak forces in the LE muscles during running and walking expressed by 21 variables; patients with PFPS had greater peak force in VL, vastus intermedius (VI) and semitendinosus muscles during walking and greater peak force in gastrocnemius muscle during running compared to controls (table 3). The maximum force developed of the quadriceps during knee extension was significantly lower in PFPS patients compared to control subjects in one study (−50.50 95% CI −80.82 to −20.18).67 Also PFPS patients had a significantly greater co-contraction of quadriceps and hamstrings at heel strike during walking (p=0.025).26 No significant difference between both study groups was found for the other 20 evaluated variables.26 ,31 ,47

Association patellofemoral pain syndrome and hip abduction strength (relative to % body weight). This figure is only reproduced in colour in the online version.
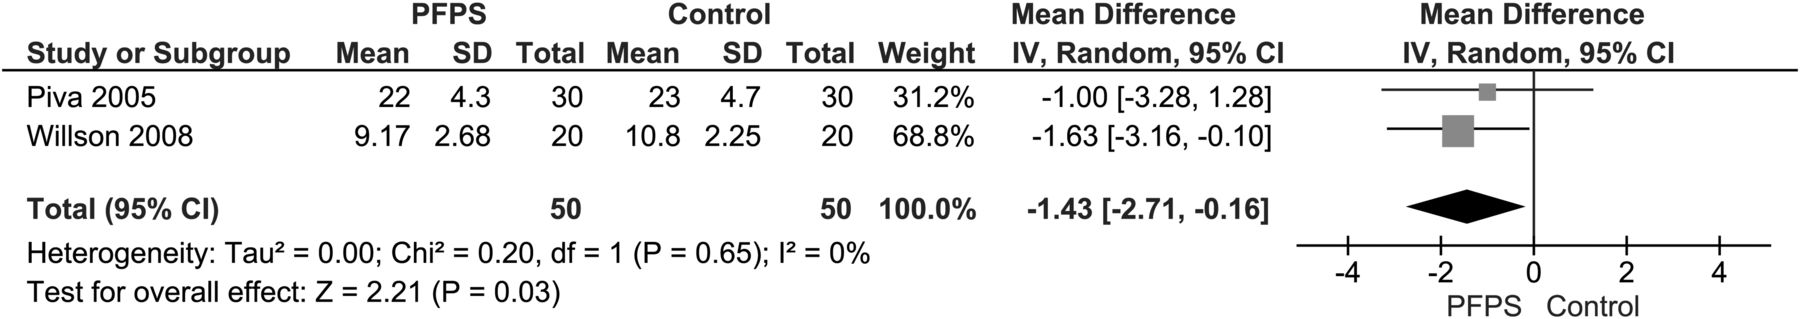
Forest plot: association patellofemoral pain syndrome and hip external rotation strength (relative to % body weight). This figure is only reproduced in colour in the online version.
Muscle endurance
One study evaluated 10 variables for muscles endurance, expressed by the product of the torque (the force that the subjects exerted at a given distance perpendicular to the dynamometer axis) and the range of motion through which it was applied (Newton metre per unit of time). Significantly less muscle endurance in the PFPS group was found compared to the control group, expressed by eight variables (table 3).58
Muscle timing
A total of 97 variables for muscle timing of the LE muscles were evaluated in nine studies.29 ,43 ,47 ,50 ,51 ,59 67 ,68 ,70 Electromyographic (EMG) onset timing of VMO during concentric task, eccentric task, lifting toes, rising toes, stair descent, ramp descent, stair ascent and ramp ascent was delayed in PFPS patients compared to control subjects expressed by 10 significantly associated variables (table 3)29 ,51 ,59 and EMG cessation of VMO was delayed during stair descent (MD 5.70; 95% CI 1.37 to 10.03).51 Seven variables for onset timing of VL during different physical activities were reported.50 ,51 ,59 Onset of VL occurred earlier than the soleus muscle activation in PFPS patients (MD −63.20 (−90.31 to −36.09);59 however, the onset of VL was delayed during ramp descent in PFPS patients compared to controls (MD 3.60; 95% CI 0.46 to 6.74).51 EMG onset and cessation of VI and vastus medialis longus (VML) were measured in Powers et al during six different physical activities that is, free speed walking, fast walking, stair ascent and descent and ramp ascent and descent; cessation of both muscles was delayed during stair descent and onset of both muscles was delayed during ramp descent in PFPS patients (table 3).51 Powers et al also described the mean intensity of all vasti muscle and the intensity of EMG activity for VMO and VL (% of maximal muscle test) contraction during six different physical activities and those were both significantly lower during all physical activities, except for stair ascending and descending, in PFPS patients compared to control subjects. Intensity of the VL muscle (EMG activity) was significant lower during ramp ascent, ramp descent and stair descent in the patients with PFPS compared to controls.51 In one study, activation levels during maximum voluntary knee extension initiated with the knee flexed were measured for VMO and VL muscles, both normalised activation levels were greater in PFPS patients compared to control subjects.68 Maximum voluntary isometric contraction of the average gluteus maximus and medius muscles were measured during running, step-down and drop jump. In one study the activation of VMO, VL and rectus femoris muscles relative to the main bulk of the muscle were significantly slower than for the control subjects.67 Average gluteus maximus EMG signal was greater in PFPS patients during step-down and running compared to controls (MD 5.90; 95% CI 1.39, 10.4 and 21.0; 95% CI 6.22 to 35.8). No significant differences were found among the other four studied variables.70 One study described significant less onset timing difference between lateral hamstring and medial hamstring muscle in PFPS patients compared to controls (MD −53.80; 95% CI −105.66 to −1.94).47 No significant associations were found among the other 55 studied variables.43 ,50 ,51 ,59 ,68
Other measures
Joint position sense
Four variables for joint position sense in the knee were measured in one study. The error between demonstrated and performed action was significantly greater in PFPS patients in weight-bearing joint position sense at 60° knee flexion compared to the control group (MD 1.20; 95% CI 0.12 to 2.28).25
Joint mobility
In one study the percentage of hypermobile and normal mobile joints in PFPS patients were compared with the number of hypermobile and normal mobile joints in the control group. In the group with PFPS patients more joints were hypermobile compared to the control group (OR: 4.27; 95% CI 3.39 to 7.61).61 In the control group more normal mobile joints were found compared to PFPS patients (OR: 0.23; 95% CI 0.13 to 0.42).61
Joint effusion
No significant differences in joint effusion were found between PFPS patients and control subjects.65
Psychological factors
Two psychological variables and their relationship with PFPS were evaluated in one study. PFPS patients had reduced ‘self-perceived health status’ and increased ‘mental distress’ compared to controls (MD 0.82; 95% CI 0.45, 1.19 and 0.38; 95% CI 0.17 to 0.59, respectively).36
Neurological
Five variables to measure neurological signals were studied in one study.66 The detection threshold of warmth was higher in PFPS patients compared to controls (p value: <0.05); hence the detection threshold of cold was lower in PFPS patients compared to controls (p value: <0.05). The tactile perception threshold (Von Frey) in the painful area of the knees from PFPS patients was increased compared to the control group (p value: <0.05). No differences between both groups were found for the sum of detection thresholds (limen) and for the heat pain thresholds.66
Extrinsic factors
Extrinsic factors were examined by 29 variables.32 ,36 ,49 ,54 ,58 Duffey et al evaluated 18 training variables using a runners’ history questionnaire that inquired about past running injuries, training regimen, running terrain, running shoes, stretching and running experience. Only mileage accumulated in shoes before discarding was significantly lower in the PFPS group (MD −157.0; 95% CI −267 to −47).58 One study described a significantly shorter period of sport participation before military training (MD −16.40; 95% CI −30.6 to −2.22), a significantly higher number of sport participators before basic military (OR 2.28; 95% CI 1.36 to 3.83), a significantly higher number of previous knee injuries in PFPS (OR 6.84; 95% CI 3.01 to 15.3) and significantly more PFPS patients were in basis training of the military training compared to controls (OR 2.00; 95% CI 1.20 to 3.32).32 Thomeé et al found a higher number of PFPS patients participating in competitive sports compared to controls (p<0.0001).54 One study used the triple jump test to evaluate the functional demands of weight bearing and jumping. Subjects had to stand on one foot and jumped three times on the same lower extremity, first on the pain-free LE and then on the LE with the painful knee. The difference between the lower extremities in centimetre was recorded as the final score. PFPS patients demonstrated a greater difference between involved an uninvolved LE during the triple jump test compared to controls (MD 55.0; 95% CI 29.4 to 80.6).36 One study reported lower activities of daily living score in PFPS patients compared to controls (MD −35.30; 95% CI −42.0 to −28.6).49 No other evaluated extrinsic factors were significantly associated with PFPS.32 ,54 ,58
Discussion
This review examined the factors associated with PFPS. The 47 included studies evaluated 523 variables for PFPS. Pooling was possible for eight variables and a significantly larger Q-angle, larger sulcus angle, larger patellar tilt angle, lower peak torque knee extension, significantly lower hip abduction strength and significantly lower hip external rotation strength were found in the PFPS patients compared to controls. No difference was found for arch height index and congruence angle.
The pooled data showed a significant larger Q-angle in PFPS patients. The pooled analysis showed a large statistical heterogeneity between the studies. This might partly be explained by the methodological difference among the studies and due to the lack of consensus of the measurement method of the Q-angle. A recent systematic review concludes that the considerable disagreement on the reliability and validity of the clinical Q-angle measurements might be due to the lack of standardisation in the measurement procedure. This might also be one of the causes for the heterogeneity found in our statistical analysis.74 One study found larger, although not significant, Q-angles during the measurement at 0° compared to the 30° measurement.54 To reduce the chance on heterogeneity, data from the Q-angle at 30° were not used for pooling and in most included studies the Q-angle was measured with the knees in full extension. It is apparent the Q-angle is not significantly associated with future PFPS, as shown in the systematic review on risk factors for PFPS.12 Considering that the Q-angle is not expected to change after the onset of PFPS, it is not expected that the Q-angle is a consequence of PFPS. Nevertheless, the pooled data of our review shows that a larger Q-angle is associated with current PFPS. Since the recent systematic review could not recommend the best suitable method to measure the Q-angle, more research is required to establish a standardised clinical Q-angle protocol.74
The pooled data of two studies showed lower knee extension peak torques at 60°/s (Nm) in PFPS patients, although a large statistical heterogeneity was seen between these studies. This might be explained by the difference in the PFPS patient groups; that is, in the study done by Duffey et al 31% of the PFPS patients were female, while in the study by Werner et al 52% of the PFPS patients were female.56 ,58 Nevertheless, lower extension peak torque was confirmed as a risk factor for PFPS in two prospective studies.75 ,76 This suggests that a lower knee extension peak torque at 60°/s is associated with PFPS, and might even be apparent before development of PFPS. This is confirmed by the results of a recent published review, in which a meta-analysis showed that future PFPS patients have lower knee extension peak torque at 60°/s, indicating a lower concentric peak torque for the knee extensors. In these studies the evaluated peak torques were expressed as a measure for strength of the lower-extremity muscles. Therefore, it seems that PFPS patients have less quadriceps strength and this even seems to be a risk factor for PFPS.12 ,56 ,58 ,75 ,76
Pooled data showed significantly less hip abduction strength (%BW) and less hip external rotation strength (%BW) in PFPS patients compared to the control subjects.49 ,57 In contrast, a prospective study on risk factors reported no significant differences in hip abduction strength (%BW) and hip external rotation strength (%BW) between future PFPS patients and control subjects.77 owing to patellofemoral pain a large percentage of patients are forced to stop sports activities78 and therefore might cause decreased lower-extremity muscle strength in PFPS patients. Hence, more prospective research is needed to clarify whether less hip abduction strength (%BW) and hip external rotation strength (%BW) rather is a consequence of PFPS than a cause.
Conflicting evidence was found for dynamic hip internal rotation angle in two studies.57 ,70 One study found a smaller hip internal rotation angle during a single leg squat and a single leg jump.57 Whereas another study found a greater hip internal rotation angle during running and step-down tasks.70 A possible explanation for the different results may be attributed to the methodological and measurement differences. Additionally, the question remains as to whether the differences found are a consequence of the pain by compensation or related to the cause of pain.
Delayed EMG onset timing of VMO in PFPS patients during different physical activities was described in three studies, expressed by 10 variables.29 ,51 ,59 Although pooling was not possible due to the difference in tasks during the measurements, the results of three studies imply that the VMO is delayed in PFPS patients compared to controls during different physical activities.29 ,51 ,59 Noteworthy is that for the 94 evaluated variables on muscle timing of the vasti muscles, 55 variables were not associated with PFPS. Especially the cessation timing of all vasti muscles and the onset of VL, VML and VI were not significantly different between both study groups during almost all activities. This suggests that only the onset timing of VMO is delayed and had less activity in PFPS patients compared to controls.51 It is however questionable as to whether the small differences found are also clinically relevant.
Discrepancy in outcomes was found for EMG onset timing of VMO relative to VL; two studies did not find a significant difference in EMG onset timing between VMO and VL between PFPS and control group,43 ,50 while in both studies from Cowan the VMO onset was significantly delayed in PFPS patients.29 ,59 In another study the normalised activation levels of VMO and VL were both greater in PFPS patients compared to controls.68 This discrepancy in outcomes was also seen in the systematic review from Chester et al where an association between EMG onset timing of vasti muscles and PFPS is not demonstrated, although they describe a trend for delayed onset of VMO relative to VL in PFPS patients compared to the control subjects.21 Conflicting evidence was also seen in two prospective studies investigating risk factors for PFPS.78 ,79 The results of the studies that examined the onset timing of VMO21 ,29 ,59 ,78 ,79 suggest the possible role of delayed onset of VMO relative to VL in PFPS patients. A case–control study on treatment for PFPS patients compared patellar taping with no tape and found that the onset timing of VMO and VL changed in patients with patellar taping.80 The mechanism by which knee taping may affect neuromotor control was examined in another study, suggesting that taping reduced the pain in PFPS patients and consequently leads to changes in onset timing.81 Therefore, the changed onset timing might be a consequence of pain and it remains unclear as to which mechanism is involved in the development of pain in PFPS and therefore further research is necessary.
The clinical relevance of the significant differences between both groups studied in this systematic review is often debatable. For example, the sulcus angle is on average 1.61 degrees larger in the PFPS group, indicating a very small, but significant difference between both study groups. One might argue whether this small difference will have clinical relevance, also taking the measurement errors into account. The same probably counts for the muscle strength findings, finding small significant differences in strength, expressed in percentage of body weight.
Limitations
We performed our literature search in Pubmed (MEDLINE), MEDLINE (OVID), Embase and the WoS and checked all reference lists of included studies, but also of the studies that were excluded based on the study sample. Since there are other literature databases available that were not included in our search strategy, there is a very small chance that relevant literature was missed.
We decided to exclude case–control studies including <20 PFPS subjects. This choice was primarily based on the likeliness of publication bias occurring in case–control studies with small numbers of subjects. Therefore, the published small case–control studies are likely to be not representative for all studies performed on factors associated with PFPS. Since the chance on such a bias is relatively large in small case–control studies, we decided to exclude studies with <20 subjects included. As a consequence, we have excluded 58 small case–control studies (figure 1) and therefore might have excluded additional data on factors associated with PFPS.
Owing to the magnitude number of variables tested in the included studies, we were unable to discuss the individual findings of all variables (table 3). Because these findings were based on single studies, further research is required to confirm the possible association with PFPS.
Remarkable was that in only five studies the outcome assessor was blinded on health status (PFPS versus controls) of the subjects.20 ,37 ,39 ,46 ,61 Five studies 35 ,42 ,49 ,65 ,70 described that the outcome assessor was not blinded and in the other 37 studies it was unclear as to whether the outcome assessor was blinded or not. Therefore, it is likely that detection bias has occurred in those 42 studies. Hereby, there is a major potential that this confounds the results of those studies. To reduce the chance of detection bias, blinding of the examiner in future studies is recommended.
A total of 523 variables were tested in the 47 included studies. Thirteen studies28 ,30 ,32 ,34 ,35 ,38 ,40 ,44 ,45 ,53 ,60 ,61 ,63 adhered to ‘the rule of ten’ (type I error), meaning that in these studies not more than one variable per 10 PFPS patients were examined.82 The other 34 studies evaluated more than one variable per 10 cases, which leads to a higher chance on coincident significant findings. Therefore, an unimportant variable could be presented as an important association.83 From the 13 studies that adhered to ‘the rule of ten’, 10 studies included 50 or more patients with PFPS. Owing to the dissimilarity of the examined variables in the studies, pooling was only possible for eight variables. A meta-analysis for the other 515 evaluated variables was not feasible, because of the difference in outcome measures, methodological measurements, missing data and due to statistical heterogeneity. The lack of consensus for the methodological measurement and the magnitude variability of these factors evaluated in the included studies make it difficult to compare the outcomes and determine the possible associations and implement these on the patients in the primary or secondary care. Furthermore, 13 studies were not truly or somewhat representative for the average population that is, adolescents and adults, mainly females and athletes with PFPS in general practice and sports medicine. This makes it also difficult to translate the results to these patients in primary or secondary care. Nevertheless, this is the first review that provides a systematic overview of all the associated factors examined in published studies.
In conclusion, our review provides indications that PFPS is associated with a larger Q-angle, larger sulcus angle, larger patellar tilt angle, less hip abduction strength conveyed as a percentage body weight and less knee extension strength expressed by peak torque. Other factors that were statistically significant different between PFPS patients and control subjects were based on single studies, and therefore further research is required in high-risk groups that is, athletes and military recruits in a prospective cohort study design.
References
Supplementary materials
Supplementary Data
This web only file has been produced by the BMJ Publishing Group from an electronic file supplied by the author(s) and has not been edited for content.
Files in this Data Supplement:
- Data supplement 1 - Online Appendix 1
- Data supplement 2 - Online Appendix 2
- Data supplement 3 - Online Appendix 3
Footnotes
-
Contributors All authors made a substantial contribution to: conception and design, or analysis and interpretation of data; drafting the article or revising it critically for important intellectual content and final approval of the version to be published.
-
Funding None.
-
Competing interests None.
-
Provenance and peer review Not commissioned; externally peer reviewed.
-
▸ References to this paper are available online at http://bjsm.bmjgroup.com