Article Text

Abstract
Objective The 2014 FIFA World Cup Brazil included 64 matches in temperate to tropical environmental conditions. We analysed performance data in relation to the environmental conditions to identify potential association.
Methods Wet-bulb globe temperature (WBGT) parameters were obtained at the centre of the field 1 h before the start of play. Environmental stress was estimated (low, moderate and high) for each match using WBGT and relative humidity. Various physical and technical performance indices were recorded during each match (average of both teams).
Results Over the 64 matches, 28 were played under low, 20 under moderate and 16 under high environmental stress. There was no difference in actual playing time (p=0.517), total distance covered (p=0.491), number of goals scored (p=0.485) and number of cards (p=0.618) between the matches played under different environmental stress categories. The number of sprints was lower in high than in moderate or low environmental stress (−10%, p<0.05) but peak speed was unaffected. The distance covered at high intensity was also lower under high (24.8±2.8 m/min/player) than low environmental stress (26.9±2.3 m/min/player, p=0.02). Number of passes was not different but the rate of successful passes was higher under high (76.8±4.4%) than low (73.6±10.8%) environmental stress (p=0.031).
Conclusions Top-level players seem to modulate their activity pattern during matches in a hot and humid environment (ie, less high-intensity but more low-intensity running and successful passes) to preserve the global match characteristics (ie, similar actual playing time, total distance covered, peak running speed and goals scored).
- Environment
- Heat
- Performance
- Soccer
This is an Open Access article distributed in accordance with the Creative Commons Attribution Non Commercial (CC BY-NC 4.0) license, which permits others to distribute, remix, adapt, build upon this work non-commercially, and license their derivative works on different terms, provided the original work is properly cited and the use is non-commercial. See: http://creativecommons.org/licenses/by-nc/4.0/
Statistics from Altmetric.com
Introduction
The 2014 FIFA World Cup Brazil was held in Brazil from mid-June to mid-July. The 12 host cities were located in a large perimeter (>9.000 km) from near the equator to more southern and cooler regions. Consequently, some matches were scheduled under tropical environmental conditions that may affect performance during a football game.1–5
Despite a large body of literature on the effect of hot ambient conditions on continuous6 ,7 or intermittent8 ,9 performance in a laboratory, only a few studies have investigated the effect of environmental stress on football performance.4 ,5 ,10 These studies showed that the total distance or the distance covered at high intensity was reduced during an experimental game played in a hot environment as compared with when played in cooler conditions.4 ,5 Conversely, the peak running speed was improved when playing football in the heat,4 suggesting that players may modulate their activity pattern to preserve key performance indicators. Indeed, Australian rules football players reduced the total distance covered when competing in the heat but maintained their high-intensity runs.10 Tennis players reduced the point duration11 or increased the time between points12 when competing in the heat (wet-bulb globe temperature (WBGT) ∼34°C). However, there is no evidence that behavioural thermoregulation occurs in professional players under extreme extrinsic and intrinsic motivation such as during the FIFA World Cup.
While some data suggest that hyperthermia may impair complex cognitive functions,13 successful pass and cross rates were improved during an experimental game held in hot ambient conditions as compared with a control game.4 This suggests that some technical parameters may improve during competitive games played in hot environments.
Therefore, performance and behavioural markers were collected during the 2014 FIFA World Cup Brazil to examine the effect of environmental heat stress at the highest competitive level.
Methods
Performance data
The current analysis includes all matches played (n=64) during the tournament. Performance data, collected with the same tracking system, were obtained from the FIFA website. The following parameters were recorded as average of the team: actual playing time, number of goals scored, number of cards (yellow and red), total distance covered, high (>14 km/h), medium (11–14 km/h) and low activity (<11 km/h) distance, sprint (>25 km/h) distance, peak running speed and number of sprints. In terms of technical skills, the number of passes and the per cent of successful passes were recorded. Data from the goalkeepers were excluded.
Environmental conditions
Dry, wet and black-globe bulb temperatures were recorded at the mid-spot of the field 1 h before kick-off time by a member of the medical team with a hand-held thermometer (WBGT-203A Heat Stroke Checker, Kyoto Electronics Manufacturing Co, Japan). To normalise readings, the thermometer was placed standing on a chair/bench outside the pitch for 10–15 min before recording the environmental conditions. Following this period, the person in charge walked to the centre spot of the pitch, elevated the device 2–2.5 m above the ground and took the measurements. Data were recorded on a form and collected at the FIFA Headquarters by the Chief Medical Officer. All thermometers were calibrated by the manufacturer.
Environmental heat stress calculation
WBGT was calculated as WBGT=0.7 wbt+0.2 bgt+0.1 dt; where wbt is wet bulb temperature, bgt is radiant heat and dt is dry bulb temperature.
We evaluated the heat stress with two indices: WBGT14 and the combined use of WBGT and relative humidity.15 According to the first method, the level of heat risk was evaluated as ‘unrestricted’ (<22°C), ‘low risk’ (22–28°C), ‘high risk’ (28–30°C), ‘very high risk’ (30–32°C) and ‘stop play’ (>32°C).3 ,14
In addition, given that several games were played in tropical environments (ie, high humidity and moderate dry heat), and that WBGT might underestimate heat stress risk under high humidity,2 ,15 ,16 environmental conditions were further categorised as low, moderate and high environmental heat stress, based on WBGT and relative humidity.15 According to this classification, the risk of heat injury at 50% relative humidity is ‘high’ for WBGT 28–33°C, ‘moderate’ for WBGT 24–28°C and ‘low’ for WBGT <24°C. At 75% relative humidity, the heat injury risk is ‘high’ for WBGT 25–29°C, ‘moderate’ for WBGT 20–25°C and ‘low’ for WBGT <20°C15 (see online supplementary file 1).
Data analysis
Each match (n=64) was coded as one data point representing the match characteristics (average of both teams; ie, actual playing time, number of passes per minute, rate of successful passes, and total number of goals and cards) or the average player response (per minute, average of both teams; ie, total distance and distance covered at low, moderate and high intensities). This approach was adopted to account for factors that affect performance such as the opponent's level, the scoring advantage of one team, the tactics, etc. The relationship of these variables with the environmental conditions (WBGT) was investigated via linear correlation (Pearson).
The match variables were compared between the environmental stress categories via one-way analysis of variance (ANOVA). All variables were tested using Mauchly's procedure for sphericity before applying ANOVA. A χ2 was used to analyze categorical data (ie, total number of cards and goals). When expected frequencies were less than five in at least one cell (ie, number of red cards and goals scored), the Fischer's exact test was used. Data were coded and analysed in PASW software V.21.0 (SPSS, Chicago, Illinois, USA) and the level of significance was set as p<0.05. Data are reported as mean±SD. The study was approved from Zurich University review board.17
Results
Match characteristics
According to American College of Sports Medicine (ACSM) heat stress classification, 1 match was played at ‘stop play’, 1 match at ‘very high risk’, 41 at ‘low risk’ and 21 at ‘unrestricted’ environment. The low number of matches played under ‘stop play’ and ‘very high risk’ limited our analysis.
Applying Gonzalez15 classification system, over the 64 matches, 28 were played under low, 20 under moderate and 16 under high environmental stress (table 1). There were no differences in actual playing time (p=0.517), total distance covered (p=0.491) or number of goals scored (p=0.485) between the matches played under different environmental stress categories (figure 1). Moreover, these match characteristics were not significantly correlated to WBGT (all r<0.24). Accordingly, we have followed this method to categorise heat injury risk.
Number of matches and cards during the 2014 FIFA World Cup matches played under low, medium and high environmental stress

Match characteristics in relation to environmental heat stress (estimated from wet-bulb globe temperature and relative humidity). Values are means±SD. NS, not significant.
Physical activity response
The number of sprints (p=0.001) and the distance covered at high intensity (p=0.020) were significantly affected by the environmental stress. Post-hoc analyses showed that the number of sprints performed when the match was played under the high stress category (0.36±0.04 sprints/min/player) was significantly lower than the number of sprints performed under moderate (0.40±0.05 sprints/min/player, p=0.013) or low (0.41±0.04 sprints/min/player, p=0.001) environmental stress categories. The distance covered at high intensity was significantly lower under the high stress category (24.8±2.8 m/min/player) than the low stress category (26.9±2.3 m/min/player, p=0.02).
The number of sprints (r=−0.37, p=0.003) and the distance covered at high intensity (r=−0.28, p=0.024) were negatively correlated to WBGT during the match (figure 2). However, this did not translate into a significant relationship between WBGT and total distance (r=0.05, p=0.723), as it was compensated by a positive correlation between distance covered at low intensity and WBGT (r=0.36, p=0.004; figure 2). The distance covered at moderate intensity was independent of WBGT (r=−0.01, p=0.940). Finally, peak running speed was not correlated to WBGT (figure 2).
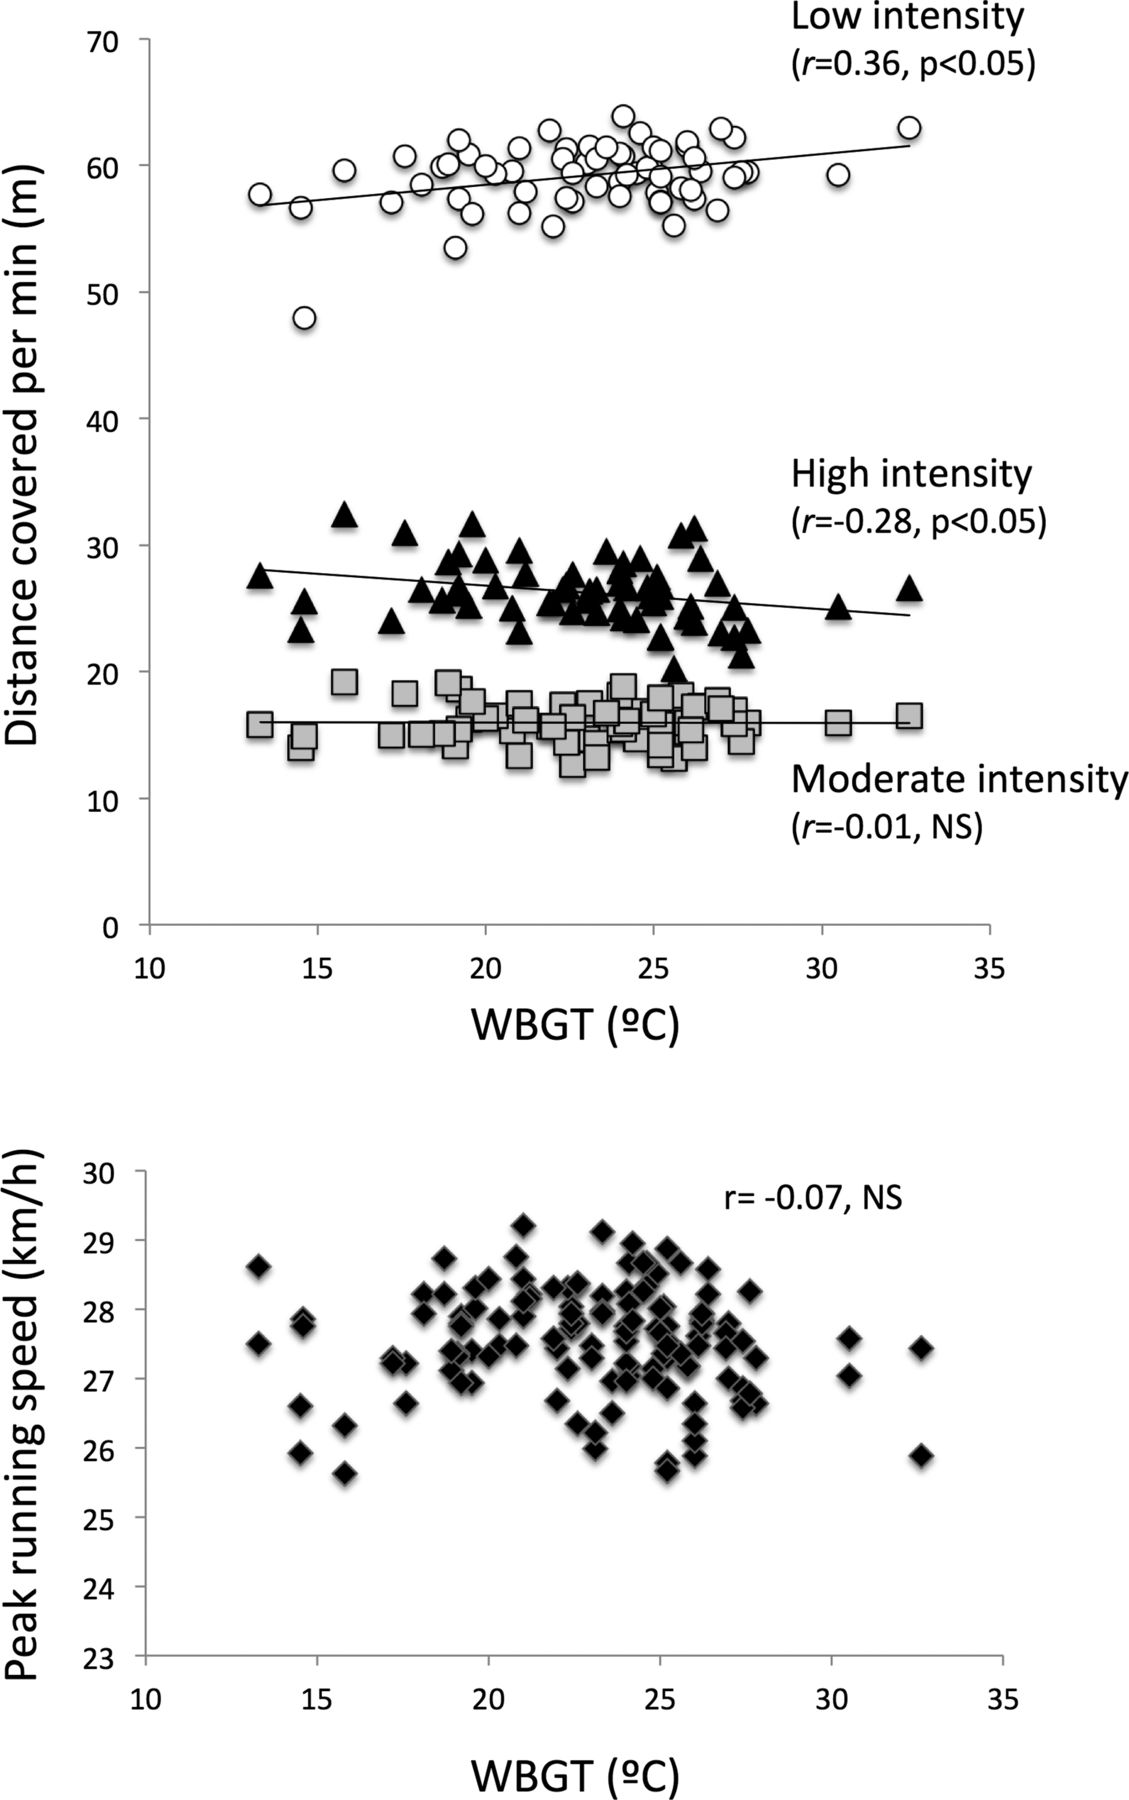
Upper part: distance covered at low (speed <11 km/h), moderate (speed 11–14 km/h) and high (speed >14 km/h) intensity during the 2014 FIFA World Cup matches in relation to WBGT. Lower part: peak running speed as a function of WBGT during the 2014 World Cup matches (NS, not significant; WBGT, wet-bulb globe temperature).
Technical parameters
The number of passes was not different (p=0.203) between the matches played under low (10.8±1.2 passes/min), moderate (11.4±1.0 passes/min) and high (11.3±1.4 passes/min) environmental stress (figure 3). However, the rate of successful passes was significantly related to the heat stress category (p=0.02) with a higher rate of success under high (76.8±4.4%) than low (73.6±10.8%) environmental stress (p=0.031; figures 3 and 4). The rate of successful passes (r=0.37, p=0.003), but not the number of passes (r=0.16, p=0.216), was significantly correlated to WBGT (figure 4).

Technical performance under the three environmental stress categories. Values are means±SD, *p<0.05 (NS, not significant).

Association of wet-bulb globe temperature (WBGT) with technical performance indicators during the 2014 FIFA World Cup matches.
Faults
The total number of cards (p=0.618) was not different between the matches played under different environmental stress (table 1). However, there was a higher prevalence of red cards during the games played in high than in low environmental stress (p=0.015).
Discussion
Our data suggest that the environmental conditions during the 2014 FIFA World Cup Brazil did not affect football performance. Top-level football players may adopt different pacing strategies to cope with environmental challenges. In the 2014 FIFA World Cup Brazil, the players reduced their high-intensity running distance and the number of sprints to preserve their technical ability (ie, the number of successful passes) and peak running speed. Of note, a high environmental heat stress was not associated with indices describing the nature of the game, such as the actual playing time and number of goals and cards.
Effect of environmental stress on performance
Higher environmental stress was not associated with alteration in the nature of the game as suggested by the unaltered time of actual playing, the number of goals scored and the total number of cards. To the best of our knowledge, no previous study has investigated these factors. In tennis, point duration was unaltered when playing in the heat (WBGT 33.6°C) compared with cool (WBGT 19.4°C),12 and this is also an example of heat stress, at least up to this level, not affecting the nature of the game.
Our data show a negative association between WBGT and high-intensity distance covered as well as with the number of sprints performed. These findings were also confirmed when the data between the three environmental risk categories were analysed. Previous studies show similar results in experimental matches.4 We believe this behavioural modification is part of a pacing strategy for the players to preserve their technical skills and peak running speed. Indeed, the number of successful passes was higher with greater environmental stress in this world cup. Alterations in pacing strategies to cope with environmental conditions seem to occur in other sports as well. In Australian rules football matches played in the heat (WBGT >27°C), players reduced the total distance run and preserved their ability to perform at high intensity.10 In experimental football matches, players reduced the high-intensity activity but improved the rate of successful passes and crosses.4
Elite players may pace themselves to preserve key performance indicators in major competitions. For example, English Premier League players’ performance data for three consecutive seasons were analysed to examine differences between halves.18 The players were placed in three groups based on the distance covered in the first half of the match: those with high, moderate and low high-intensity activity. The analysis showed that the players with high running performance in the first half reduced their activity by 12% in the second half; no change was observed in the other two groups.18 These findings serve as additional evidence of pacing in elite-level football.
In previous studies, the total distance covered during a football game in hot and humid conditions was also lower compared with when played in moderately hot5 or in temperate conditions.4 This was not the case during the 2014 FIFA World Cup Brazil. The difference could be due to a number of factors such as the different study design and data analysis. The same players were investigated during friendly matches in the aforementioned studies whereas team's performance in world cup matches was evaluated in our study. Only 1 match in each environmental condition was played in previous studies whereas data from 64 matches were included in our analysis. In addition, data of both teams were analysed in the present study to account for factors that might affect performance, such as the playing style (ie, offensive vs defensive), tactics, score advantage, etc.19 ,20 Our study also has some limitations. For instance, the water breaks that were implemented in a few matches might have affected performance. In addition, the small number of occurrences in some parameters, such as the number of red cards, and the high variability of physical performance19 may limit the generalisability of these findings.
Practical implications
The use of the ACSM WBGT flag system is a more convenient approach to approximate environmental heat risk compared with the system we used in this analysis.15 We believe that the categorisation by Gonzalez may be more sensitive in estimating the environmental heat risk because it accounts for the relative humidity too. For instance, at WBGT 27°C, the risk is high, according to ACSM, and ranges between moderate at 50% relative humidity, to high at higher than 75% relative humidity, for the same WBGT, with the Gonzalez classification system (see online supplementary file 1).
Conclusion
Our analysis shows that at high environmental heat stress, players reduced their high-intensity activity and the number of sprints. At the same time, they maintained peak running speed and improved the rate of successful passes. These findings suggest that top-level players modulate their activity pattern during matches in a hot and humid environment (ie, less high-intensity running but more low intensity and successful passes) to preserve the global match characteristics (ie, similar actual playing time, total distance covered, peak running speed and goals scored).
What are the new findings?
Although physical performance (ie, distance run at high intensity and the number of sprints) was reduced, key performance indicators were maintained (ie, peak running speed) or improved (ie, rate of successful passes) with elevation in environmental heat stress.
The nature of the game indicated by the time of active play, the number of goals scored and the total number of cards, was not associated with environmental heat stress.
How might it impact on clinical practice in the near future?
Medical staff should be aware that top-level football players may alter their physical activity pattern when competing in the heat.
In particular, players may reduce their physical performance, especially the high-intensity distance covered, to preserve their ability in key physical and technical performance indicators.
Acknowledgments
The authors would like to thank the FIFA Medical Officers: Dr Carlos Palavicini, Dr Yacine Zerguini, Dr Terence Babwah, Dr Hosny A Ahmed, Dr Bert Mandelbaum, Dr Jiri Chomiak, Dr Ecki Hermann, Professor Lars Peterson, Dr Tony Edwards, Dr Fredy Müller, Professor Efraim Kramer, Professor Raul Madero and Dato’ Gurcharan Singh.
References
Supplementary materials
Supplementary Data
This web only file has been produced by the BMJ Publishing Group from an electronic file supplied by the author(s) and has not been edited for content.
Files in this Data Supplement:
- Data supplement 1 - Online supplement
Footnotes
Contributors GPN developed the idea, was involved in the design, data collection, analysis and interpretation, drafted and revised the manuscript, and approved the final version. JB was involved in the study’s design, data analysis and interpretation, critically revised the manuscript and approved the final version. JD was involved in the study’s design, data collection and interpretation, critically revised the manuscript and approved the final version. HC critically revised the manuscript and approved the final version. SR was involved in the study's design, data analysis and interpretation, critically revised the manuscript and approved the final version.
Competing interests None.
Ethics approval Zurich University.
Provenance and peer review Not commissioned; externally peer reviewed.