Article Text

Abstract
Background Research on high school soccer injury epidemiology is sparse.
Aim To describe high school soccer injury rates, trends and patterns by type of athlete exposure (AE), position and sex.
Methods This descriptive epidemiological study used data from a large national high school sports injury surveillance programme to describe rates and patterns of soccer-related injuries including concussion sustained from 2005/2006 to 2013/2014. Injury rates are calculated per 1000 AEs.
Results Overall, 6154 soccer injuries occurred during 2 985 991 AEs; injury rate=2.06 per 1000 AEs. Injury rates were higher during competition (4.42) than practice (1.05; rate ratio (RR)=4.19; 95% CI 3.98 to 4.41), and in girls (2.33) than boys (1.83; RR=1.27, 95% CI 1.21 to 1.34). Boys' non-concussion injury rates decreased significantly (p=0.001) during the study period while reported concussion rates increased significantly (p=0.002). Girls' non-concussion rates were relatively stable and reported concussion rates increased significantly (p=0.004). Player–player contact was the injury mechanism that led to the most competition injuries (injury proportion ratio (IPR)=2.87; 95% CI 2.57 to 3.21), while non-contact injuries were the most common mechanisms among practice injuries (IPR=2.10; 95% CI 1.86 to 2.38). Recovery from concussion was >7 days in a third of the cases. Injury patterns were similar between sexes with respect to position played and location on the field at the time of injury.
Conclusions High school soccer injury rates vary by sex and type of exposure, while injury patterns are more similar across sexes. Reported concussion rates increased significantly over the study period in male and female athletes.
- Injury
- Surveillance
- Sports
Statistics from Altmetric.com
Introduction
Soccer, the most popular worldwide sport, had an estimated 265 million players in 2006.1 One of the fastest growing sports in the USA, high school soccer participation increased 4-fold among boys and 35-fold among girls from 1973 to 2014.2 Soccer provides many health benefits, including improved cardiovascular and neuromuscular fitness.3 ,4 However, like any sport, soccer poses an injury risk. After football and wrestling, soccer had the next highest injury rate among US high school sports in 2005/2006.5 Sports injuries can be economically costly and can limit future sports participation.6 ,7
High school soccer injury studies are sparse.8–12 Most paediatric soccer-related injury studies were conducted over 10 years ago.13–16 Many focused on emergency department visits, were conducted during tournaments or were restricted to specific geographic areas and thus are not necessarily representative of a national sample.14–22 Available papers indicate adolescent soccer players most commonly sustain lower extremity injuries, but recent concerns have focused on their risk of sports-related concussions.12 ,23–26 There is continued debate regarding the concussion risk associated with heading the ball (eg, is contact with the ball an important concussion mechanism or is player–player contact during the act of heading the more common and more concerning mechanism of concussion) which has intensified concerns among some coaches and parents.27 Increases in high school soccer participation and the potential long-term effects of injury emphasise the need to understand the epidemiology of high school soccer injuries to direct targeted intervention strategies.28 ,29
We analysed soccer injuries sustained by a nationally representative sample of US high school athletes from 2005/2006 through 2013/2014. The specific aims were to: (1) compare injury rates and patterns by type of athlete exposure (AE), (2) compare injury rates and patterns by sex, and (3) evaluate injury trends over time.
Methods
Data collection
This descriptive epidemiological study used data collected from 2005/2006 through 2013/2014 by the National High School Sports-Related Injury Surveillance System, High School Reporting Information Online (RIO).5 ,9 This multiyear prospective surveillance study recruited US high schools with National Athletic Trainers' Association (NATA)-affiliated, board certified athletic trainers (ATs) to report exposure and injury data for athletes participating in school-sanctioned high school sports. Since 2005/2006 High School RIO has captured data on nine original sports (including boys' and girls' soccer) from a randomly selected sample drawn from an eight-cell sampling strata (four geographic regions and two school sizes using a 1000 student cut point), resulting in a nationally representative sample of 100 schools.9 ATs from participating schools log onto an internet-based data collection tool on a weekly basis to report AE and injury data. For each injury, ATs completed detailed reports describing the characteristics of the injured athlete, the injury and the injury event (note: no similar data were captured on non-injured teammates). A demo of the internet-based data collection tool is available at http://www.ucdenver.edu/academics/colleges/PublicHealth/research/ResearchProjects/piper/projects/RIO/Pages/Demo-Site.aspx. While High School RIO now has an expanded (convenience) sample including 22 sports, this study only used data from the 100 randomly selected high schools included in the original sample so that national estimates could be calculated. A more detailed description of the surveillance system is available elsewhere.5 ,9
Injury and exposure definitions
AEs are defined in High School RIO as a single athlete participating in a single practice or competition. Reportable injuries (1) occurred as the result of an organised high school practice or competition, (2) required medical attention by an AT or physician, and (3) resulted in restriction of athlete's participation for at least 1 day beyond the date of injury, or since 2007/2008 were fractures, concussions, heat illness/injuries or dental injuries (which were captured regardless of time loss).
Analyses
Statistical analyses were conducted using SAS Software, V.9.4 (SAS Institute, Cary, North Carolina, USA). Injury rates were calculated by dividing the number of injuries (numerator) by the number of AEs (denominator). National estimates of the numbers of soccer-related injuries were calculated by assigning a sample weight to each reported injury. Sample weights were calculated as the inverse probability of the school's selection into the surveillance study, based on the total number of US high schools in each of the eight sampling strata. Rate ratios (RRs) and injury proportion ratios (IPRs) were calculated with 95% CIs as follows:

RRs and IPRs with 95% CIs not including 1.0 were considered statistically significant. Trends in injury rates over time were calculated using linear regression, with statistical significance set at α=0.05. This surveillance project which captured the data analysed in this study was approved by the Nationwide Children's Hospital Human Subjects Review Board, Columbus, Ohio, USA.
Results
Injury rates
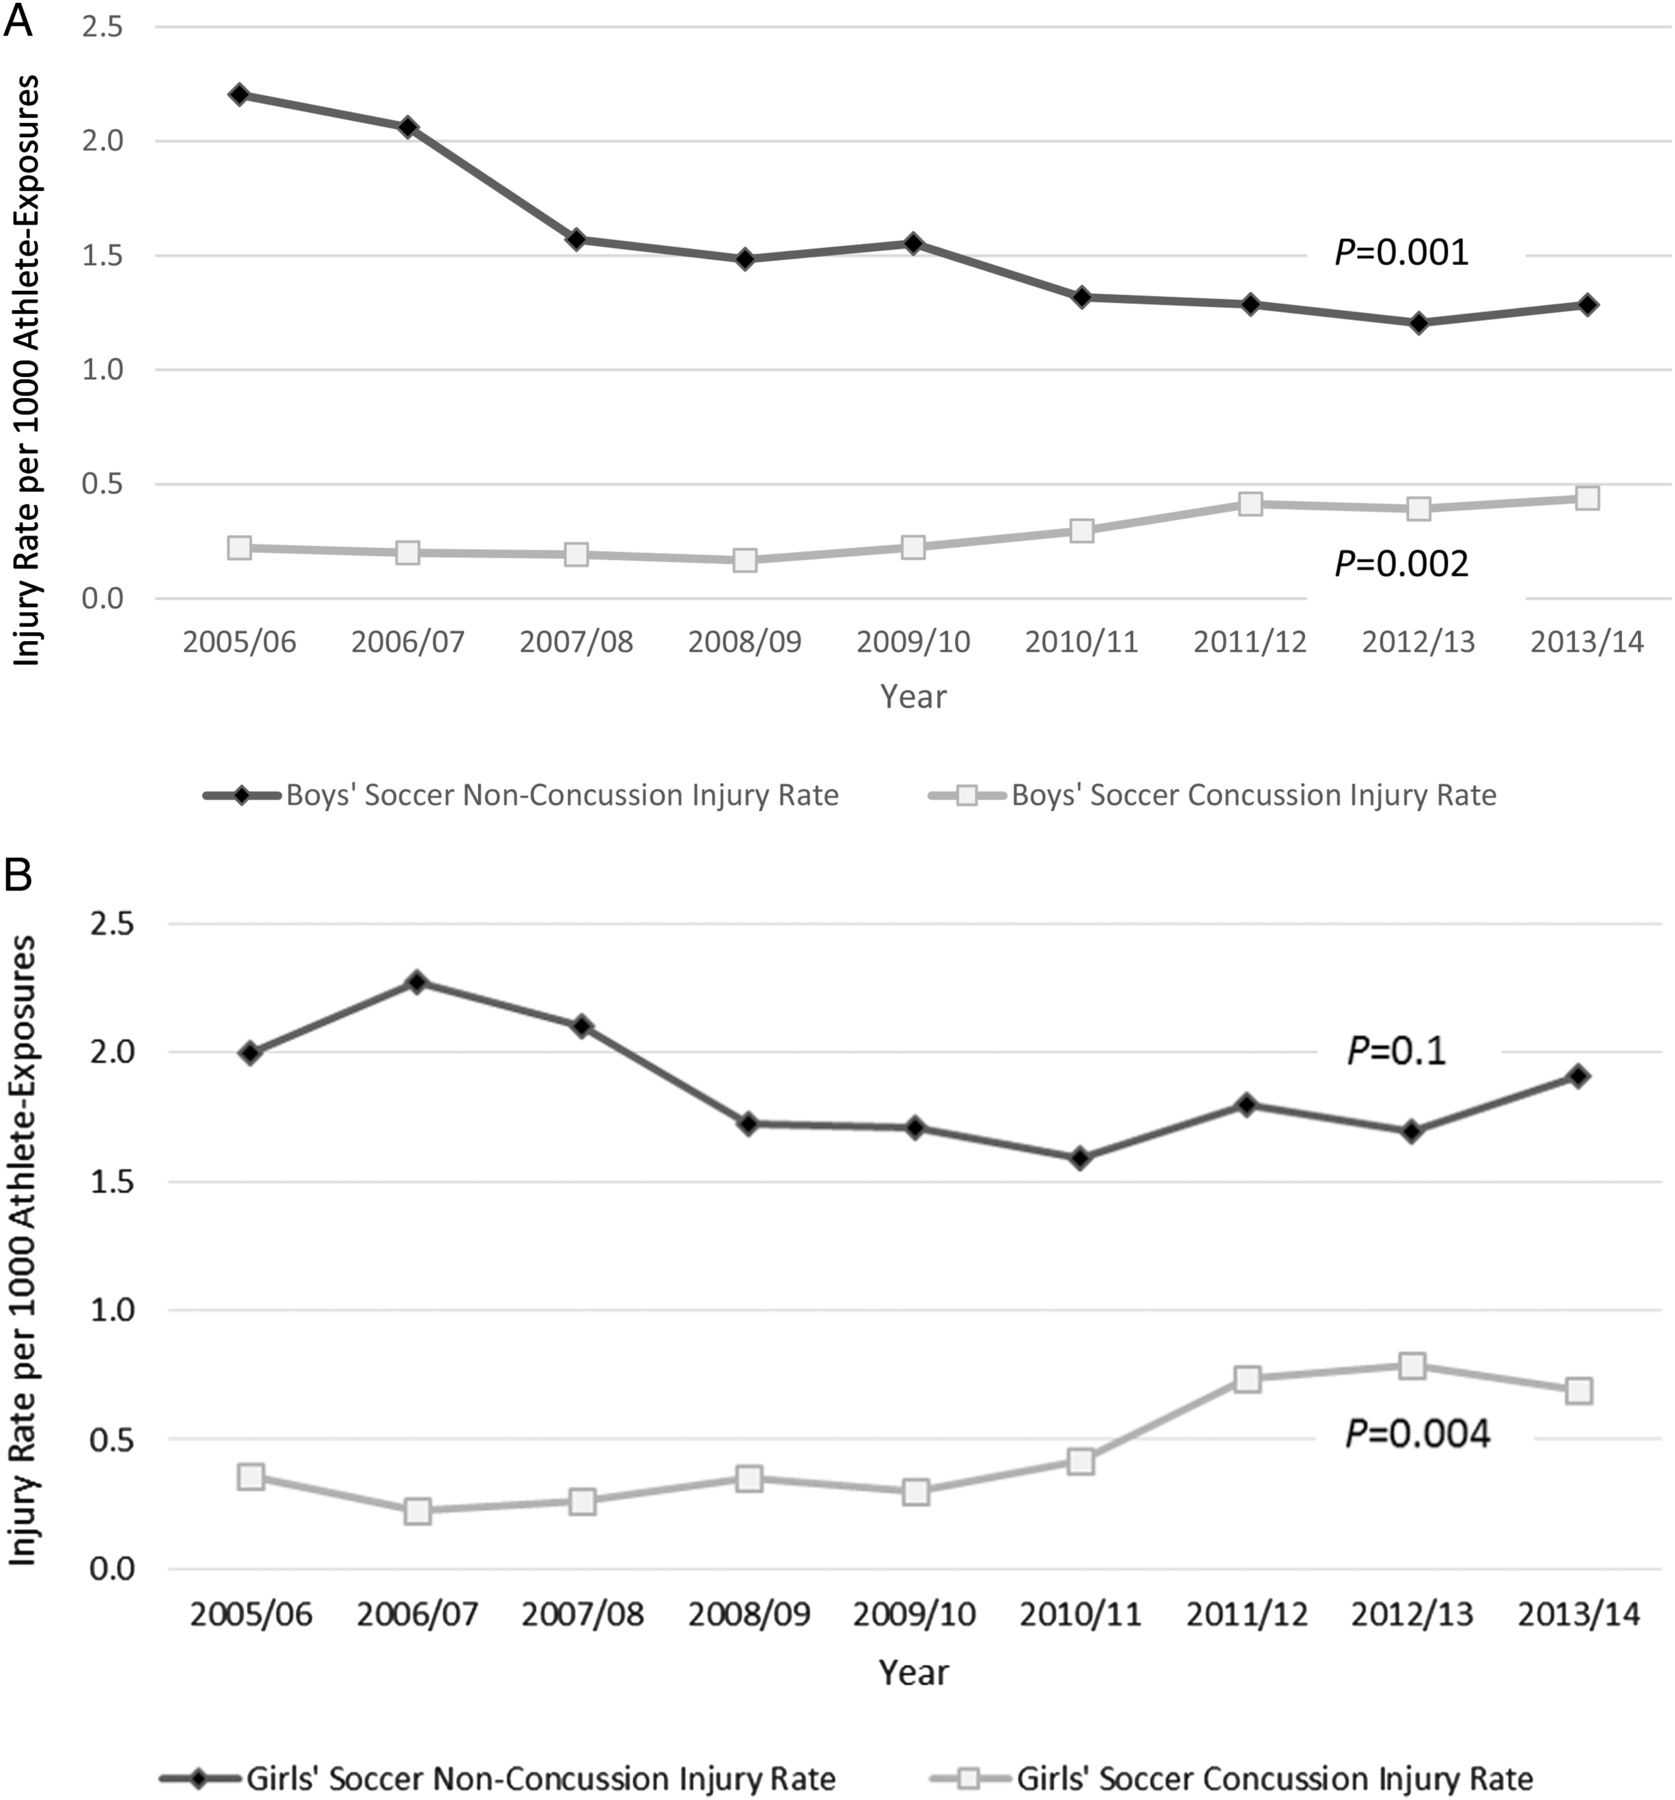
Overall, 6154 injuries were reported during 2 985 991 AEs (injury rate of 2.06 per 1000 AEs; table 1), corresponding to an estimated 3 381 189 soccer injuries nationally (1 874 022 (55.4%) among girls and 1 507 167 (44.6%) among boys). Compared with practice, injury rates were significantly higher in competition overall (RR=4.19, 95% CI 3.98 to 4.41), in boys (RR=3.55, 95% CI 3.30 to 3.83) and girls (RR=4.88, 95% CI 4.54 to 5.26). Comparing sexes, injury rates were significantly higher in girls overall (RR=1.27, 95% CI 1.21 to 1.34) and in competition (RR=1.42, 95% CI 1.34 to 1.52). Boys' non-concussion injury rates decreased significantly (p=0.001, β=−1.16, 95% CI −1.67 to −0.65) while concussion rates increased significantly (p=0.002, β=0.34, 95% CI 0.17 to 0.51; figure 1A). Girls' non-concussion rates were relatively stable (p=0.10, β=−0.47, 95% CI −1.06 to 0.12) while concussion rates increased significantly (p=0.004, β=0.67, 95% CI 0.29 to 1.05; figure 1B).
Soccer injury rates by type of exposure and sex, National High School Sports-Related Injury Surveillance Study, USA, 2005/2006 through 2013/2014

(A) Trends over time in rates of concussion injuries and non-concussion injuries in boys’ soccer, High School Sports-Related Injury Surveillance Study, USA, 2005/2006 through 2013/2014. (B) Trends over time in rates of concussion injuries and non-concussion injuries in girls’ soccer, High School Sports-Related Injury Surveillance Study, USA, 2005/2006 through 2013/2014 school years.
Injury characteristics
Overall: The majority of injuries were new (89.8%) rather than recurrent. The most common diagnoses were ligament sprains (grade I–III; 29.7%), concussions (17.9%) and muscle strains (16.1%). The most commonly injured body sites were the head/face (20.9%), ankle (20.6%) and knee (16.5%; table 2).
Body sites injured among boys and girls soccer players, National High School Sports-Related Injury Surveillance Study, USA, 2005/2006 through 2013/2014*†
Soccer injuries most commonly resulted in <1 week time loss (45.0%), but 6.7% resulted in >3 weeks, 5.8% resulted in season-ending medical disqualification, and in 6.9% the season ended before the athlete could return. The most common injuries resulting in >3 weeks time loss were fractures (27.7%), ligament sprains (26.2%) and concussions (14.9%). Medical disqualifications occurred most frequently as a result of ligament sprains (43.6%), fractures (27.4%) and concussions (10.7%). Surgery was required for 6.1% of injuries; most commonly for ligament sprains (55.1%) and fractures (21.4%). This included grade III ligament sprains such as ACL rupture. Surgery most commonly occurred in knee injuries (66.4%). The rate of ACL sprain was 0.10 per 1000 AEs in girls and 0.03 per 1000 AEs in boys.
Concussions: The overall rate of concussion in this study was 0.36 per 1000 AEs. An estimated 604 371 concussions occurred nationally in high school soccer players during the study period. The most commonly endorsed concussion symptoms were headache (92.6%), dizziness/unsteadiness (68.8%) and concentration difficulty (52.2%). Loss of consciousness occurred in 3.6% of concussions and amnesia in 15.8%. Symptoms resolved within 1 day in 21.0% of concussions, but took >1 week to resolve in 29.4% of cases. Most concussions resulted in time loss between 1 and 3 weeks (54.8%). Athletes were medically disqualified for the season in 3.5% of concussion cases.
Sex comparison: Sex differences and comparisons are shown in figure 2A, B. Girls sustained a higher proportion of ligament sprains (34.4%) than boys (23.9%; (IPR 1.44, 95% CI 1.30 to 1.59), while boys sustained a higher proportion of fractures (8.9% vs 6.0%, IPR 1.49, 95% CI 1.19 to 1.86). Concussions represented a similar proportion of all injuries sustained by boys and girls (16.6% vs 19.0%, IPR 1.15, 95% CI 0.99 to 1.33). The most common body part and diagnosis combinations for boys were head/face concussions (16.6%), ankle sprains (14.5%) and thigh/upper leg strains (9.1%). For girls, the most common were ankle sprains (20.6%), head/face concussions (19.0%) and knee sprains (9.7%).
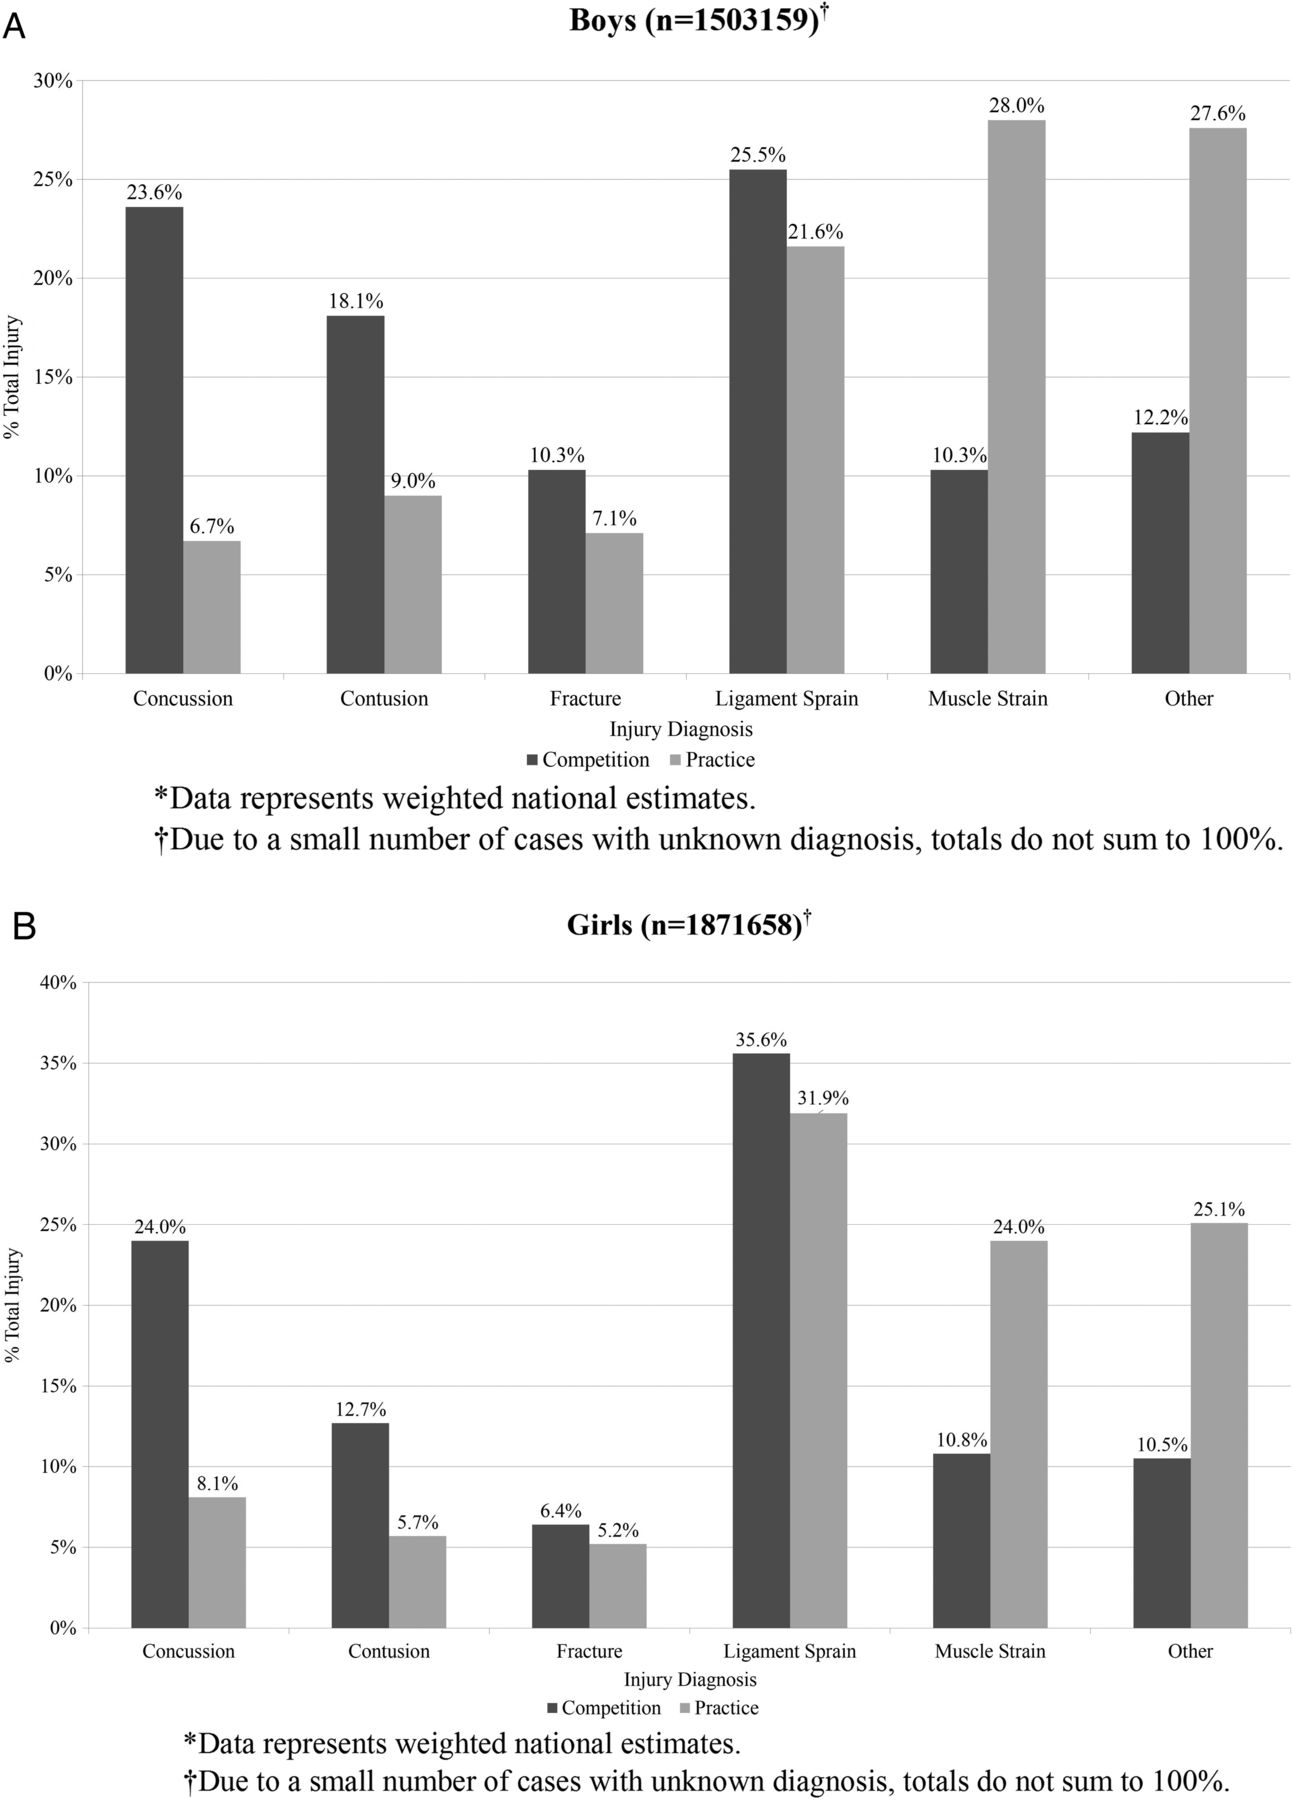
(A) Boys’ soccer injury diagnosis by type of exposure, National High School Sports-Related Injury Surveillance Study, USA, 2005/2006 through 2013/2014*. (B) Girls’ soccer injury diagnosis by type of exposure, National High School Sports-Related Injury Surveillance Study, USA, 2005/2006 through 2013/2014*.
A larger proportion of athletes returned to activity within 1 week (boys=48.5% and girls=42.8%). The most common injuries resulting in >3 weeks time loss among boys were concussions (17.8%), knee sprains (15.5%) and ankle sprains (8.9%), and among girls were knee sprains (26.0%), concussions (22.0%) and ankle sprains (13.2%).
Surgery was required for a similar proportion of boys' (5.4%) and girls' (6.6%) injuries. This was most often required for boys' knee sprains (38.2% of all boys' injuries requiring surgery), head/face fractures (9.2%) and torn knee cartilage (8.3%), and girls' knee sprains (63.6%) and torn knee cartilage (8.4%).
Type of athlete exposure: (1) Type of injury: overall, muscle strains represented a greater proportion of practice than competition injuries (IPR 2.48, 95% CI 2.13 to 2.88), while concussions (IPR 3.21, 95% CI 2.62 to 3.94), fractures (IPR 1.30, 95% CI 1.02 to 1.66) and ligament sprains (IPR 1.18, 95% CI 1.06 to 1.32) represented a higher proportion of competition injuries. (2) Affected body part: head/face injuries represented a higher proportion of competition injuries (IPR 3.01, 95% CI 2.52 to 3.61), while hip (IPR 2.69, 95% CI 1.94 to 3.72), thigh/upper leg (IPR 1.86, 95% CI 1.55 to 2.23), foot (IPR 1.82, 95% CI 1.42 to 2.34) and lower leg (IPR 1.74, 95% CI 1.38 to 2.19) represented a higher proportion of practice injuries.
Compared with practice (15.3%), a greater proportion of competition injuries (23.4%) resulted in over 3 weeks' time loss (IPR 1.53, 95% CI 1.32 to 1.78) in surgery (7.5% vs 3.3%; IPR 2.27, 95% CI 1.63 to 3.15). The rate of knee ligament sprains (including ruptures) sustained in competition requiring surgery among girls (0.28 per 1000 AEs) was much higher than the boys' competition rate (0.095; RR 2.94, 95% CI 2.08 to 4.14) as well as the girls' practice rate (0.02; RR=14.99, 95% CI 9.15 to 24.70).
Injury events
Overall: Common general injury mechanisms were player–player contact (42.5%), non-contact (22.4%), contact with playing surface (15.8%) and contact with playing apparatus (10.2%). In total, 27.5% of concussions were sustained during heading, which often occurred from player–player contact (68.1%), followed by contact with the ball (17.4%).
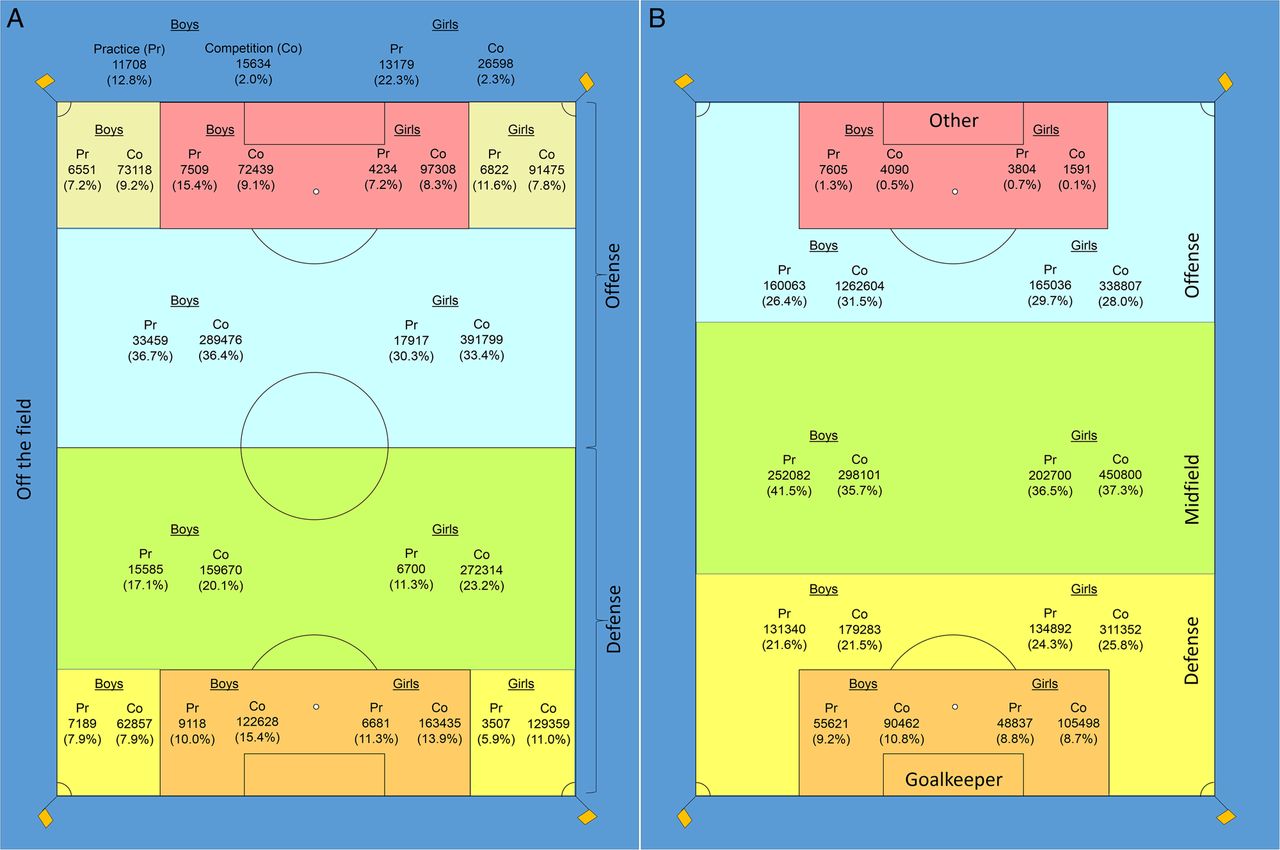
Most injuries occurred in midfielders (37.6%), followed by forwards (28.9%), defenders (23.6%) and goalkeepers (9.4%). The most common field locations where injuries occurred included the area from the top of the goal box to the centre line on the offensive side of the field (34.6%) and top of the goal box extended to the centre line on the defensive side of the field (21.5%; figure 3).
Soccer field location (A), and playing position (B) at time of injury among boys′ and girls′ soccer players, National High School Sports-Related Injury Surveillance Study, USA, 2005/2006 through 2013/2014.
Sex comparisons: Among boys and girls, the most common general mechanism of injury was player–player contact (44.1% and 41.3%, respectively; tables 3 and 4). The most common sport-specific direct mechanism for boys and girls included player–player contact (27.0% and 27.7%, respectively), contact with the ball (11.4% and 14.0%, respectively), and indirect mechanism (overuse, heat illness, conditioning, etc; 15.4% and 14.0%, respectively). Knee sprains occurred most commonly from player–player contact in boys (62.2%) and girls (50.8%). Similarly, concussions occurred most commonly from player–player contact in boys (68.8%) and girls (51.3%).
Soccer injury mechanism, activity and time of injury among boys’ soccer players, National High School Sports-Related Injury Surveillance Study, USA, 2005/2006 through 2013/2014*
Soccer injury mechanism, activity and time of injury among girls’ soccer players, National High School Sports-Related Injury Surveillance Study, USA, 2005/2006 through 2013/2014*
The most common activities leading to boys' and girls' injuries were general play (23.7% and 23.6%, respectively), defending (9.9% and 15.9%, respectively) and chasing a loose ball (10.7% and 12.1%, respectively). Among boys, injuries requiring surgery were sustained most often during general play (14.3%), chasing a loose ball (13.9%) and defending (13.3%). Among girls, injuries requiring surgery were sustained most often during general play (21.4%) and defending (17.5%).
Boys and girls had similar patterns of positions played when injuries occurred (figure 3), with midfielders most commonly injured (38.2% and 37.1%, respectively). Field location patterns among boys and girls were also similar, with most injuries occurring between top of the goal box and the centre line on the offensive side of the field (36.4% and 33.3%, respectively).
Type of athlete exposure: Player–player contact resulted in more injuries in competition (55.6%) than practice (19.4%; IPR 2.87, 95% CI 2.57 to 3.21). Non-contact injuries accounted for more injuries in practice (33.7%) than competition (16.0%; IPR 2.10, 95% CI 1.86 to 2.38). Contact with the ball resulted in a higher proportion of injuries in practice (14.8%) than competition (11.7%; IPR 1.26, 95% CI 1.06 to 1.50) as did non-contact mechanisms (ie, overuse, heat illness, conditioning, etc; 30.3% and 5.8%, respectively; IPR 5.14, 95% CI 4.26 to 6.21; tables 3 and 4). Being stepped on, fell on or kicked (12.3% and 6.5%, respectively; IPR 1.87, 95% CI 1.48 to 2.37), slide tackles (6.2% and 2.3%, respectively; IPR 2.66, 95% CI 1.83 to 3.87) and player–player contact (36.1% and 11.9%, respectively; IPR 3.00, 95% CI 2.58 to 3.49) represented a higher proportion of competition injuries. Defending (IPR 2.10, 95% CI 1.69 to 2.61), chasing a loose ball (IPR 1.68, 95% CI 1.36 to 2.08), heading (IPR 2.94, 95% CI 2.18 to 3.96) and receiving a slide tackle (IPR 3.27, 95% CI 1.81 to 5.92) resulted in greater proportions of competition injuries.
Discussion
This study is the most detailed and largest epidemiological description of US high school soccer injuries to date. It demonstrates that injury rates have changed over time and injury rates and patterns vary by the type of AE and by sex. A better understanding of the epidemiology of high school soccer injuries will drive more effective targeted injury prevention efforts.
Injury rates
This study found an overall injury rate of 2.06 per 1000 AEs. Injury rates reported in other investigations vary widely (2–7 injuries per 1000 AEs), likely due to different methodological approaches.30 One prior study reported non-concussion injury rates in boys decreased over a 3-year period, whereas non-concussion rates in girls held relatively steady.12 Our findings were similar. More research is needed to understand these trends and sex differences in non-concussion injury rates. A re-evaluation of injury prevention programmes, especially in girls, should be performed with the goal of more effectively reducing non-concussion soccer injury rates.
The concussion rate increased among both boys and girls during the study period. This may be partially due to better recognition of concussion symptoms and signs by medical and coaching staff, or the implementation of state concussion laws in the later years of our study. The precise reason for increasing concussion rates requires further investigation.
Type of athlete exposure
Similar to previous research, we found higher injury rates in competition compared with practice.3 ,12 ,15 ,21 ,31 This is likely due to more intense, full contact and potentially riskier play that occurs in competition. Future research should evaluate the potential for reducing injuries through enhanced enforcement of soccer's existing rules with a focus on reducing player–player contact. A novel finding presented here is that injuries most commonly occurred between the goal boxes. Walden et al32 reported a similar pattern in their video analysis of non-contact ACL injuries of 39 male professional football players. Future research is needed to determine if this is due to more time being spent in these quadrants of the field during games, player characteristics or something else.
Injury characteristics
A higher proportion of more serious injuries, including fractures, ligament sprains and concussions occurred in competition compared with practice in both sexes. Although a similar proportion of boys' and girls' injuries resulted in surgical repair (5.4% vs 6.6%), knee sprains represented a much higher proportion of those injuries requiring surgery in girls (63.6%) than boys (38.2%). This indicates a need for targeted preventive programmes for girls' knee ligament sprains to reduce the need for surgical intervention, as well as further research into potential reasons for this observed difference between sexes.33 ,34
Injury events
Similar to previous studies, the majority of competition injuries resulted from player–player contact while the majority of practice injuries resulted from non-contact mechanisms.14 ,30 ,31 ,35 Although injury rates were significantly higher in competition than practice, over a third of all injuries occurred in practice. Research is needed to identify potential changes to coaching philosophies, warm-up or training to reduce practice injury rates. The majority of injuries during competitions occurred during the second half indicating a potential accumulated effect of fatigue. We found midfielders and offensive players had more injuries compared with defenders and goal keepers, yet previous studies reported mixed results regarding player position.21 ,29 ,30 ,36 ,37 Further prospective studies are required to determine if there are correlations between soccer players' position and injury risk. Less than 5% of all injures were associated with slide tackles, perhaps a reflection of referee focus on improving safety by enforcing rules regarding unsafe tackling.
Limitations
Participants were limited to high schools with NATA-affiliated ATs which may limit generalisability because not all US schools have ATs. However, using trained sports medicine professionals as data reporters improves data quality. Only injuries that came to the attention of an AT could be reported. Medical coverage of high school soccer is inconsistent with physician coverage rare at most schools and AT coverage shared across multiple sports (eg, an AT covering an away football game is not available to cover a home soccer game).
Additionally, High School RIO captures only time loss injuries or any concussion, fracture, dental injury or exertional heat event. Minor injuries (eg, contusions), not resulting in time loss, are not captured. Therefore, the High School RIO surveillance system undercaptures the true number of soccer injuries which means we undoubtedly underestimated the true injury rate in this study. This limitation restricting reporting primarily to time-loss injuries is a necessary aspect of the High School RIO surveillance methodology to decrease reporter time burden and was considered acceptable given the decreased clinical importance of non-time-loss injuries.
Finally, exposure time is calculated in the High School RIO surveillance methodology as AEs rather than athlete minutes because it was not feasible for ATs to attend all practices and competitions for all sports under surveillance to record the exact number of minutes each player participated. We acknowledge there have been multiple publications providing guidance regarding methodologies for capturing exposure data in sports injury surveillance studies,28 ,38–41 but note the guidance varies across publications and thus concludes the ‘best’ exposure data are dependent on the specific parameters of the study population and research resources. We believe that the athlete's unit-based exposure (ie, number of athlete practices and number of athlete competitions) is an acceptable methodology given the limitations of the US high school sports setting.
This study also did not examine the impact of acute or chronic training load on injury risk, or the presence or compliance of any injury prevention programmes in each school. We also did not record specific ligament sprain categories (grade I, II or III). A final limitation of the High School RIO methodology is the failure to capture any data on uninjured athletes (eg, demographic data) in the cohort beyond the basic athletic participation data used as the exposure variable in the calculation of injury rates.
Conclusions
This is the most comprehensive study of soccer injuries among a large national sample of US high school athletes. This study found most injuries occur in competitions as a result of player–player contact, and that concussion rates or reporting are increasing for male and female soccer players. Given the morbidity associated with injuries, these findings should drive additional research into the development, implementation and evaluation of targeted prevention strategies.
What are the findings?
During the study period, non-concussion injury rates decreased significantly for boys but were relatively stable for girls. Concussion rates increased significantly for boys and girls.
Symptoms resolved within 1 day in 21.0% of concussions but took >1 week to resolve in 29.4%. Most concussions resulted in time loss between 1 and 3 weeks (54.8%); 3.5% of athletes were medically disqualified for the season.
Player–player contact was the most common mechanism of injury during competition, while non-contact mechanisms were most common during practice.
How might it impact on clinical practice in the future?
This study describes common soccer injuries sustained during practice and competition. Epidemiological data can be used to guide medical event planning and to develop targeted interventions to achieve the highest effectiveness in soccer injury prevention.
Acknowledgments
The authors also acknowledge the generous research funding contributions of the National Federation of State High School Associations, the National Operating Committee on Standards for Athletic Equipment, DonJoy Orthotics and EyeBlack. Additionally, the authors thank the Certified Athletic Trainers who report data to High School RIO; without their dedication this research would not be possible.
References
Footnotes
Correction notice This paper has been amended since it was published Online First. The affiliations have been corrected.
Contributors MK and DWC were involved in acquisition of data, data analysis, manuscript preparation, critical revision of the manuscript and approval of the article. IMA was involved in manuscript preparation, critical revision of the manuscript and approval of the article. RDC was involved in concept/design, acquisition of data, data analysis, manuscript preparation, critical revision of the manuscript and approval of the article.
Funding The content of this report was funded in part by the Centers for Disease Control and Prevention grants R49/CE000674-01 and R49/CE001172-01.
Disclaimer The content of this report is solely the responsibility of the authors and does not necessarily represent the official views of the Center for Disease Control and Prevention or any of the other institutions that provided financial support for this research.
Competing interests None declared.
Ethics approval The Nationwide Children's Hospital Subjects Review Board, Columbus, Ohio, USA.
Provenance and peer review Not commissioned; externally peer reviewed.