Article Text

Abstract
Objective: To determine if approximate entropy (ApEn), a regularity statistic from non-linear dynamics, could detect changes in postural control during quiet standing in athletes with normal postural stability after cerebral concussion.
Methods: The study was a retrospective, case series analysis of centre of pressure (COP) data collected during the Sensory Organization Test (SOT) from NCAA Division I (USA) athletes prior to and within 48 h after injury. Subjects were 21 male and six female athletes from a variety of sports who sustained a cerebral concussion between 1997 and 2003. After injury, athletes displayed normal postural stability equivalent to preseason levels. For comparison, COP data also were collected from 15 male and 15 female healthy non-athletes on two occasions. ApEn values were calculated for COP anterior-posterior (AP) and medial-lateral (ML) time series.
Results: Compared to healthy subjects, COP oscillations among athletes generally became more regular (lower ApEn value) after injury despite the absence of postural instability. For AP time series, declines in ApEn values were much larger in SOT conditions 1 and 2 (approximately three times as large as the standard error of the mean) than for all other conditions. For ML time series, ApEn values declined after injury in all sensory conditions (F1,55 = 6.36, p = 0.02).
Conclusions: Athletes who demonstrated normal postural stability after concussion nonetheless displayed subtle changes in postural control. Changes in ApEn may have represented a clinically abnormal finding. ApEn analysis of COP oscillations may be a valuable supplement to existing concussion assessment protocols for athletes.
- ApEn, approximate entropy
- AP, anterior-posterior
- COP, centre of pressure
- ES, equilibrium score
- ML, medial-lateral
- SOT, Sensory Organization Test
- UNC-CH, University of North Carolina at Chapel Hill
- approximate entropy
- cerebral concussion
- non-linear dynamics
- postural control
- sensory organization test
Statistics from Altmetric.com
- ApEn, approximate entropy
- AP, anterior-posterior
- COP, centre of pressure
- ES, equilibrium score
- ML, medial-lateral
- SOT, Sensory Organization Test
- UNC-CH, University of North Carolina at Chapel Hill
Sport related cerebral concussion is a growing public health concern.1 Not only is the incidence of concussion among athletes relatively high,2,3 but recurrent concussion has been associated with slowed recovery of neurological function.4 Athletes who return to competitive activity too early after injury are potentially more vulnerable to injury recurrence, the consequences of which can be catastrophic.5 In response to these concerns, quantitative assessment tools which detect physical and cognitive impairment have become increasingly important in sports medicine.6
The assessment of postural control provides an indirect means of identifying concussion related neurophysiological abnormality and serves as one of several recommended tools for determining readiness to resume competitive activity.7 Postural control traditionally has been characterised according to a biomechanical framework as postural stability, that is, the ability to maintain a desired postural orientation, either at rest or during movement, in response to perturbations generated from either internal or external sources. For human functional activities performed while standing or sitting, postural stability specifically refers to the ability to resist perturbations such that the whole body centre of mass is maintained within the limits of the base of support. Postural steadiness, a special case of postural stability, defines the ability to stand as motionless as possible in the absence of external perturbation.8 In quantitative terms, postural steadiness is often inferred from the amplitude of centre of pressure (COP) displacements. Using these constructs, previous research has demonstrated that athletes who initially present with postural instability after concussion return to their baseline level of postural steadiness performance within an average of 3–5 days.1,7,9,10 Importantly, however, not all athletes display postural instability after concussion,11 suggesting that neurophysiological impairments affecting postural control are not necessarily a predictable consequence of injury. We questioned this assumption, recognising that postural stability assessment and the traditional biomechanical model on which it is based represent only one approach to measuring postural control.12
Alternative theoretical models from non-linear dynamics offer novel strategies for postural control assessment. Rather than characterising postural control as postural stability (measured as the amplitude of COP variability), these strategies focus on patterns of COP oscillation emerging in time. Patterned sequences of COP coordinates can range from highly structured and predictable to disordered and random. Even if not apparent to the naked eye, structured patterns of COP variability are thought to emerge from dynamic, lawful interactions among underlying control system components and may be an important characteristic of adaptive postural behaviour.13,14
Recent evidence suggests that approximate entropy (ApEn),15 a regularity statistic developed from non-linear dynamics, shows promise as a clinically applicable tool.16–,19 ApEn quantifies the amount of irregularity, that is, randomness, in a time series (fig 1⇓). The algorithm generates a unit-less real number from 0 to 2. Zero values correspond to a completely regular time series (that is, sine wave), whereas values of 2 indicate a completely random and irregular time series (that is, Gaussian noise). We recently demonstrated that ApEn could detect significant changes in the regularity of COP oscillations in eight collegiate athletes with cerebral concussion who displayed postural instability after injury.20 Our purpose in the current study was to determine whether ApEn could detect changes in postural control after cerebral concussion among athletes without signs of postural instability. Such distinctions between the amplitude of COP displacements and their pattern of oscillation may be visible to the eye in individual cases (fig 1⇓). To explore this phenomenon on a group level, we conducted a retrospective analysis of COP data which had been collected previously in our laboratory from athletes with cerebral concussion. Based on pilot data,20 we hypothesised that COP oscillations would become less random (more regular) in the acute stage following concussion.

Four time series ordered in descending amount of randomness. (A) Artificially generated random time series from a known signal (ApEn value = 2.0034, based on n = 2000). (B) COP anterior-posterior (AP) time series collected from a healthy athlete at preseason, standing still with eyes closed (ApEn value = 0.8694). Compared to (A), (B) appears substantially less random, although some waveform irregularities persist. (C) COP AP time series collected from the athlete (B) standing still with eyes closed within 48 h after a cerebral concussion. Compared to (B), (C) contains fewer irregularities and appears relatively more predictable (ApEn value = 0.6619). Paradoxically, the range of COP displacement after injury (approximately 4 cm) was less than at preseason (approximately 5 cm), suggesting that postural stability had improved, rather than become more impaired, after injury. (D) Artificially generated sine wave which oscillates continuously in an entirely predictable manner (ApEn = 0).
METHODS
Subjects
Subjects included 21 male and six female Division I collegiate athletes from the University of North Carolina at Chapel Hill (UNC-CH) who sustained a concussion between 1997 and 2003 during practice or competition. Athletes ranged in age from 17 to 22 years (mean: 19.5 years), in height from 163 to 196 cm (mean: 181.7 cm), and in weight from 56.7 to 136.2 kg (mean: 90.0 kg). No athlete had sustained a previous concussion within the same season as the concussion under investigation. Fifteen athletes reported no lifetime history of concussion, while six athletes reported one previous injury, one athlete reported more than one previous injury, and five athletes gave no report. Athletes participated in a variety of sports, including football (52%), soccer (22%), lacrosse (18%), wrestling (4%), and field hockey (4%).
All athletes had been enrolled in a formal concussion surveillance protocol, were informed of the procedures and inherent risks of testing, and had read and signed a consent form in accordance with the UNC-CH Academic Affairs Institutional Review Board. According to the surveillance protocol, athletes underwent preseason postural steadiness testing, and in the event of cerebral concussion, were tested again at regular intervals after injury. Certified athletic trainers and team physicians evaluated the injured athletes and diagnosed the concussion injuries. Concussion was defined as injury to the brain caused by a sudden acceleration or deceleration of the head which resulted in any immediate, but temporary, alteration in brain functions, such as loss of consciousness, blurred vision, dizziness, amnesia, or memory impairment. For the purpose of this investigation, we included COP data from two testing intervals: (i) preseason and (ii) within the first 48 h after injury. For comparison, we also analysed COP data collected from 15 male and 15 female healthy non-athlete subjects, who ranged in age from 18 to 27 years (mean: 21.7 years), in height from 150 to 190 cm (mean: 172.9 cm), and in weight from 45 to 109 kg (mean 71.05 kg). Healthy subjects underwent postural steadiness assessment on two separate occasions.
Postural control assessment
Postural control was evaluated using the Smart Balance Master System (NeuroCom International, Clackamas, OR, USA). Software versions 6.0–8.0 were employed over the course of the data collection period. The system was equipped with a moveable visual surround and support surface which could rotate in the AP plane. Two 9×18 inch force plates connected by a pin joint were used to collect COP coordinates at 100 Hz.
The Sensory Organization Test (SOT) consists of 18 total trials, each lasting 20 s, in which subjects are instructed to stand with their arms relaxed at their sides, to look straight ahead, and to stand as still as possible without reaching out to touch the visual surround or taking a step. Subjects wear comfortable attire and are shoeless during testing. Foot placement is standardised based on subject height according to the manufacturer’s protocol. The trials are conducted in three groups of six each. Each group contains one trial from a different sensory condition (fig 2⇓). In our protocol, the SOT required approximately 15 min to conduct. For the first group of trials, sensory conditions were presented in ascending order (1 to 6). For the second and third groups, sensory conditions were presented randomly.

Six testing conditions for the Sensory Organization Test (reprinted with permission from NeuroCom International). Vision is absent in conditions 2 and 5. In conditions 3 and 6, the sway referenced AP angular motion of the surrounding wall reduces optic flow stimulation useful for the perception of self motion relative to the visual field. In conditions 4–6, sway referenced angular motion of the force plates reduces somatosensory stimulation useful for the perception of AP self motion relative to the support surface.
Determination of postural stability after injury
An equilibrium score (ES) was generated for each trial in each condition based on an algorithm developed for the Smart Balance System.21 The algorithm uses the peak-to-peak amplitude of COP AP displacement to estimate the amount of postural sway in the sagittal plane. Scores are calculated as the angular difference, expressed as a percentage, between the amount of estimated AP postural sway and the theoretical limit of stability (approximately 12.5° in the AP plane). Lower amplitudes of COP displacement reflect less postural sway, and consequently, higher percentage differences from the theoretical limit. Thus, higher ES indicate greater postural stability. A composite ES was calculated by independently averaging the trial scores from conditions 1 and 2, adding these two average scores to the individual trial scores from conditions 3–6, and then dividing the sum by 14.21 After injury, no athlete had signs of postural instability, as determined by a normal composite ES which was no more than 5% below their preseason value. As a group, athletes had clinically normal composite ES at preseason (mean: 79.0±6.0) and after injury (mean: 81.2±5.6). Healthy subjects also had composite ES consistent with normal postural stability at both sessions (mean: 79.9±8.1 and 81.3±7.8, respectively).
COP data reduction
The ApEn algorithm essentially applies a moving window procedure to determine the probability that short sequences of data points are repeated, within a certain error tolerance, throughout a temporal sequence of points. Expressing the average probability in logarithmic form (and taking the inverse), ApEn generates a unit-less real number which ranges from 0 to 2.15 Zero values correspond to time series where the sequences of data points are perfectly repeatable. A sine wave, for example, oscillates continuously in a repeatable and predictable fashion. Values of 2 correspond to time series for which any repeating sequences of points occur by chance alone (fig 1⇑).
The ApEn algorithm has been published in great detail elsewhere.22,23 Using Matlab software (Mathworks, Natick, MA), we calculated separate ApEn values for the AP and medial-lateral (ML) components of the COP coordinate time series (n = 2000) from test trials. The algorithm requires the operator to input both the length of the short segments of data points and the error tolerance used in the calculation. The reliability of the output is optimal when input values, as well as the length of the entire time series, are identical for all subjects.22 This requirement precluded the use of trials interrupted by a fall. For this reason, we calculated ApEn values for the first two trials from each SOT condition and used the third trial as a substitute for interrupted trials. Input parameters for the ApEn calculation were (i) a series length (m) of two data points, (ii) a tolerance window (r) normalised to 0.2 times the standard deviation of individual time series, and (iii) a lag value of 10.23,24 This lag value was chosen to lower the effective sampling frequency of the algorithm from 100 to 10 Hz, thereby reducing the influence of extraneous noise in the data. ApEn values from individual trials were averaged for further analysis. According to accepted guidelines,25 average ApEn values for COP time series collected during two trials of the SOT have demonstrated good to moderate between-session response stability for the AP (ICC(2,2) range 0.79–0.90) and ML (ICC(2,2) range 0.53–0.77) components of COP time series.26
Data analysis
Using SPSS 10.0 statistical software (SPSS, Chicago, IL), we conducted separate 2×2×6 (group×day×sensory condition) mixed model ANOVA for average AP and ML ApEn values, with repeated measures on day and condition factors. To accommodate any violations of the ANOVA sphericity assumption, we relied on the more conservative Giesser-Greenhouse F test (α = 0.05). Degrees of freedom used for the corrected F test were not necessarily whole numbers.
Prior to conducting statistical analyses, we used a surrogation (phase randomisation) procedure to validate the application of a non-linear parameter to characterise the COP data. Surrogate AP and ML time series were created having identical means, standard deviations, and power spectra to the original data but with randomly generated order. This procedure also was performed in Matlab using the algorithms developed by Theiler et al.27–,29 ApEn values from the original data and their surrogated counterparts were compared using Student’s t test (α = 0.05). We found significant differences between all original COP time series and their surrogate counterparts, indicating that the original data were not randomly derived, and therefore, were deterministic in nature.
RESULTS
All subjects completed the SOT battery during both testing sessions. After injury, two athlete subjects lost their balance during either the first or second trial of condition 6. Although the interrupted trials had been included in the calculation of composite ES used to determine eligibility for study, they were unable to be used for ApEn analysis. Consequently, the interrupted trials were replaced with condition 6 trial 3 data.
COP AP time series
For subjects with concussion, COP AP time series became more regular (ApEn values declined) after injury in SOT conditions 1–4 and more irregular (ApEn values increased) in conditions 5 and 6. For healthy subjects, COP time series became slightly more irregular in every condition. The ANOVA produced a significant three way interaction between group, day, and sensory condition (F3,165 = 2.75, p = 0.04), suggesting that differences in ApEn values between days depended on group and SOT condition (fig 3⇓). Rather than conducting a post hoc analysis of simple main effects, we elected to describe the magnitude of ApEn differences across days for each SOT condition according to group (table 1⇓). This process revealed that for injured athletes, the decline in ApEn values for sensory conditions 1 and 2 were much larger (approximately three times as large as the standard error of the mean) than for all other changes in ApEn values in either group. Thus, compared to their own preseason performance and to healthy subjects, injured athletes displayed a relatively dramatic loss of randomness (increase in regularity) in COP AP oscillations primarily during sensory conditions 1 and 2.
Mean ApEn differences for COP AP time series between days in athletes who had no evidence of postural instability after injury

Mean approximate entropy (ApEn) values for centre of pressure (COP) anterior-posterior (AP) time series in athletes without postural instability after concussion (n = 27) and in healthy subjects (n = 30). ApEn values are displayed for the six Sensory Organization Test conditions. Athletes were tested at preseason and within 48 h after injury. Healthy subjects were tested on two occasions. Lower scores reflect greater regularity of COP oscillations.
There were no significant two way interactions between group and condition or day and condition. Thus, after further collapsing group and day ApEn values, we found a significant main effect of SOT condition (F2.5, 138.7 = 60.6, p<0.01). Tukey HSD analysis of this effect revealed that ApEn differences greater than 0.1 represented significant alterations in COP regularity. Using this criterion, we found that ApEn values in SOT conditions 1–3 were significantly different from values from conditions 4–6 (table 2⇓).
Main effect of Sensory Organization Test (SOT) condition on mean (SE)
COP ML time series
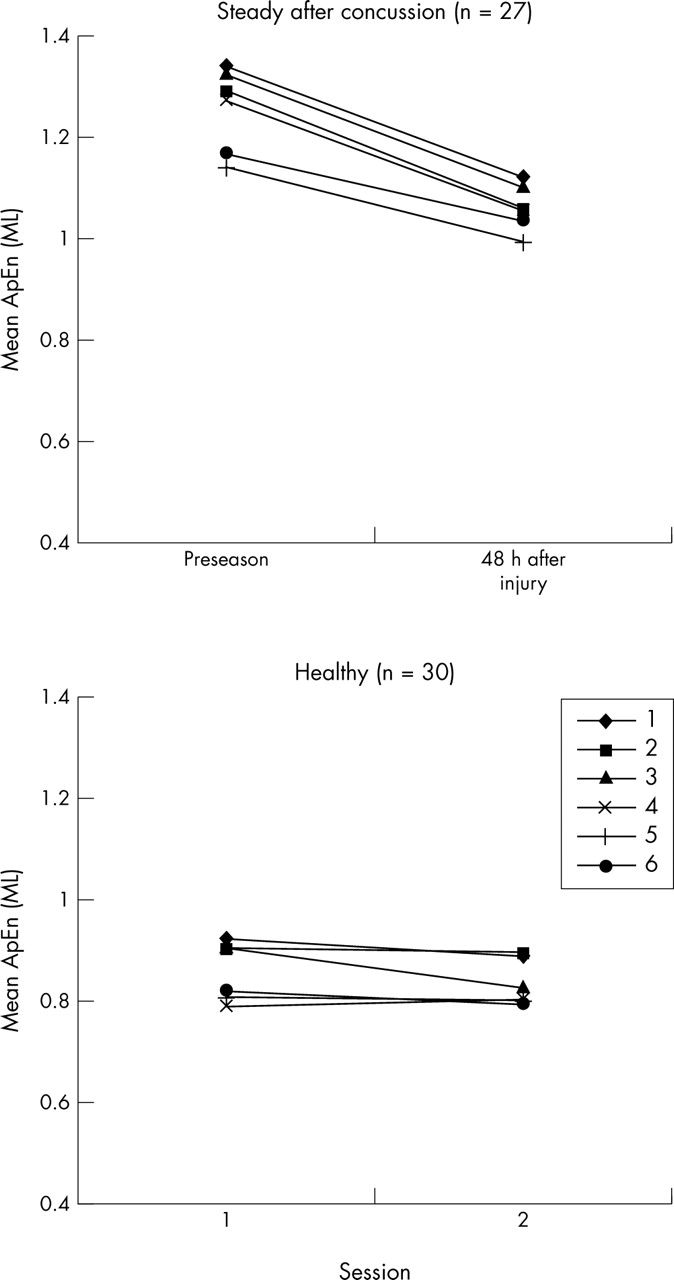
For athletes with concussion, ApEn values consistently declined between preseason and after injury in all SOT conditions (fig 4⇓). The only significant interaction occurred between group and day (F1,55 = 6.36, p = 0.02), indicating that the decline in ApEn values among subjects with concussion was significantly different from the change across days among healthy subjects (table 3⇓). This finding indicated that injured athletes displayed a relatively dramatic loss of randomness (increase in regularity) in COP ML oscillations across all sensory conditions. There also was a significant main effect of SOT condition (F3.9, 216.8 = 14.2, p<0.01). Tukey HSD analysis of this effect revealed that ApEn differences greater than 0.07 represented significant alterations in COP regularity. Using this criterion, we found that, as for COP AP time series, ApEn values for COP ML time series in SOT conditions 1–3 generally were significantly different from values from conditions 4–6 (table 2⇑).
Group mean (SE)

Mean approximate entropy (ApEn) values for centre of pressure (COP) medial-lateral (ML) time series in athletes without postural instability after concussion (n = 27) and in healthy subjects (n = 30). ApEn values are displayed for the six Sensory Organization Test conditions. Athletes were tested at preseason and within 48 h after injury. Healthy subjects were tested on two occasions. Lower scores reflect greater regularity of COP oscillations.
DISCUSSION
The most important finding of this research was that the ES, a common clinical measure of postural stability, was not sufficient for determining the presence or absence of postural control changes after concussion in the study sample. Clearly, the group of injured athletes had no change in COP displacement amplitude (postural stability) yet nonetheless displayed a change in the pattern of COP oscillations. This finding suggests that clinicians should be cautious about relying exclusively on the amplitude of COP displacement for determining whether postural control has returned to normal after injury and underscores the value of applying alternative theoretical frameworks to postural control assessment. ApEn, like other non-linear methods, has demonstrated repeatedly that patterns of COP variability contain valuable information and should not be dismissed as random error.16–18,26,30
As predicted, COP displacements tended to be less random (more regular) after concussion, even though athletes had no signs of postural instability. The largest differences between days occurred in sensory conditions 1 and 2 for AP time series (table 1⇑) and across all sensory conditions for ML time series (table 3⇑). The magnitude of the changes was approximately 2–3 times the standard error (SE) of the mean for the difference, making it highly unlikely that the changes in ApEn values occurred by chance. Combined with the marked difference between healthy and injured subjects, the result supports the hypothesis that concussion may be more likely to produce changes in postural control than has been thought previously.
Despite its apparent value as a tool for detecting subtle changes in postural control, ApEn alone does not reveal the underlying mechanisms responsible for producing a decline in the randomness of COP oscillations among injured athletes. The interpretation of our results, therefore, is speculative and warrants further investigation. One possibility is that ApEn indirectly reflected changes in neurophysiological function resulting from concussion. This interpretation is based on a dynamical systems perspective, according to which the output of a complex control system is governed by interactions among control system components. In this context, COP displacement can be viewed as an output signal of the postural control system. Diffuse axonal injury, resulting from direct trauma to neurons or secondary metabolic sequelae, may reduce or distort interactions among neurons in the brain.31 As a result, brain regions might become less coupled to one another, thereby increasing the regularity of cortical oscillations.32 Indeed, the symptoms of minor concussion (being stunned, dinged, or dazed) are often strikingly similar to those of minor epilepsy, a condition in which patterns of cortical activity become more synchronised.33 Because patterns of brain electrical activity are known to be reflected in patterns of electrical signals descending to the periphery,34 it is plausible that the loss of randomness (increased regularity) in patterns of COP oscillation after concussion may reflect abnormal changes in cortical oscillatory activity.
The magnitude of decline in ApEn values between preseason and after injury was greater for COP ML time series. We suggest that this finding may have been related to the observation that ML oscillations were consistently more irregular (higher ApEn value) than AP oscillations (table 2⇑). ApEn is calculated as an average logarithm, with higher values representing increasingly larger degrees of time series randomness.24 Compared to AP oscillations, therefore, ML oscillations had a greater potential to reveal a substantial change. The generally higher ApEn values for ML time series (compared to AP) may have been a biomechanical consequence of subjects standing upright with their feet placed shoulder width apart. In this body configuration, ML oscillations would be relatively low in amplitude and less likely to drift away from a central equilibrium point in a predictable manner. This suggestion will be an important focus of future postural control research, because it implies that lower amplitude COP oscillations associated with healthy states may also tend to be relatively irregular.
What is already known on this topic
Athletes who return to competitive activity too early after cerebral concussion are potentially more vulnerable to injury recurrence. Postural stability is an important indicator of recovery. Not all injured athletes, however, appear unsteady in clinical tests, raising the possibility that traditional measures may not adequately detect subtle impairments.
The apparent relationship between COP amplitude and regularity was also evident in the effect of SOT condition. ApEn values were markedly lower in more challenging sway referenced platform conditions which typically produce relatively larger amplitude COP oscillations (table 2⇑). This finding has been reported previously, and is thought to arise from either sensory or mechanical constraints on postural control.26,30 Given the logarithmic scale properties discussed above, lower ApEn values in sway referenced conditions may have made it less likely that ApEn would detect a specific impairment attributable to processing of visual or vestibular information for postural control.7,35 From a clinical perspective, the finding suggests that not all SOT conditions may be necessary for ApEn to detect a decrease in the randomness of COP oscillations. Conditions 1 and 2, in particular, revealed the greatest changes in ApEn measured from COP AP time series, and all SOT conditions were equally able to reveal ApEn changes measured from COP ML time series. Thus, if an investigator’s goal is solely to assess changes in the randomness of COP oscillations after cerebral concussion, standing quietly with eyes open and closed on a stable platform (conditions 1 and 2) may be the only sensory conditions which need to be evaluated.
Currently there is no validated method for using ApEn to classify the integrity of postural control in absolute terms. Thus, unlike biomechanical postural stability measures, for which static equilibrium is the theoretical goal, ApEn values for COP data measured on one occasion are not clinically useful. ApEn is best suited as a supplemental tool for measuring changes in postural control, especially in circumstances where subtle abnormality may increase the likelihood of subsequent injury. On the basis of our findings, subtle postural control impairment appears to be associated with a decline in ApEn values corresponding to a loss of randomness in COP oscillations. We hypothesise, therefore, that complete recovery of postural control after injury would include a return of ApEn values to preseason levels.
What this study adds
Athletes who demonstrate postural stability after concussion nonetheless may display changes in postural control, as demonstrated by a reduction in the randomness in centre of pressure oscillations in quiet standing. Concussion may be more likely to produce changes in postural control than has been thought previously.
Importantly, ApEn is theoretically distinct from biomechanical measures. The present findings, therefore, do not negate the use of the SOT ES, from which valuable somatosensory, visual, vestibular, and visual conflict ratios are determined. Instead, the findings suggest that postural stability measures from biomechanics and temporal characterisations of COP oscillations from non-linear dynamics together may provide a more comprehensive and thorough assessment of postural control changes after concussion.
Our study was limited in several respects. First, the retrospective analyses did not allow for tight control over experimental testing conditions. Second, not only was the study sample relatively small, but the pool of subjects was selected based on the availability of data rather than any other external criteria. Third, only two SOT trials were used as a reflection of each subject’s performance. Although defensible on methodological grounds, the omission raises the possibility that the two-trial average ApEn values were not entirely representative. For these reasons, the results should be interpreted cautiously until they can be replicated.
REFERENCES
Footnotes
This research was supported by grants from NATA-REF and NOCSAE
Competing interests: none declared