Article Text

Abstract
Objectives: To study match injury patterns and incidence during the Rugby World Cup 2003 (RWC 2003); to compare these patterns and rates with comparative rugby injury data; and to assess differences between teams playing at different levels (eight finalists v 12 non-finalists).
Methods: Data were collected prospectively during the tournament. All injuries were recorded by the 20 participating team physicians. These were submitted to the tournament medical officer. An injury was defined as an event which forced a player either to leave the field or to miss a subsequent game or both.
Results: 189 injuries were recorded over 48 matches. This corresponds to 97.9 injuries per 1000 player-hours. Pool matches yielded a higher injury rate than non-pool matches. The 12 non-finalist teams sustained significantly higher injury rates than the eight finalist teams. The player positions open side flanker, inside centre, and number 8 were the most frequently injured positions. There was a low concussion rate, which may reflect under-reporting. The non-finalist teams had a higher rate of recurrent injury.
Conclusions: The injury rate was higher than comparative data. Mismatches in the areas of skill, fitness, and the availability of resources for medical care of players may explain these differences.
- rugby
- injury
- international sport
Statistics from Altmetric.com
The Fifth Rugby World Cup (RWC) was the biggest international sporting event in 2003 and was held in Australia during October and November 2003. The 2003 RWC final was watched by “a record global television audience”1 for rugby union football. The 20 participating national representative teams played a total of 48 games at 11 venues in 10 cities around Australia. The teams were drawn into four pools of five teams and played at least four pool games and up to three finals games.
There are few studies of injury rates in elite or professional rugby. In an elite rugby team, Bathgate recorded 142 injuries in 91 games (69 per 1000 player game hours).2 An injury rate of 36.2 per 1000 player game hours for injuries resulting in a missed game was reported over three seasons of surveillance of elite rugby in Australia.3 Few studies have been conducted within a tournament structure. Jakoet et al reported 70 injuries from 55 games in the amateur era RWC 1995—an overall injury rate of 32 per 1000 player game hours.4 An injury was defined as one requiring the player to leave the field during a game for the remainder of that game. They noted that there was a higher injury rate during the seven finals matches of the tournament than during the pool matches. In the 2001 Under-21 Championships, 50 injuries occurred in 16 games played between eight teams over two weeks, resulting in a rate of 78 per 1000 player game hours.5
Over half the elite rugby injuries were to soft tissue, involving joint and ligament sprains, muscle strains, bruising, and lacerations.2–,4 While most studies indicated that concussion was the most common form of head injury, it rarely accounted for more than 5% of the elite injury total.2–,4 The lower limb is the most frequently injured body region, followed by the head and upper limb. The tackle is associated with more than half of all injuries, open play 19.6%, and ruck and maul 14.7%.2,3 In general, forwards are injured more often than backs, especially the loose forwards2 or second row.4
International professional sports tournaments are becoming major show cases for sports and receive substantial media coverage. The profiles of these tournaments in rugby, soccer (football), cricket, field hockey, and the Olympic games, for example, continues to grow, as do the expectations of medical management during the tournaments. At present there is little research data on injury rates and factors that require medical planning at professional tournaments. Outside of rugby, Hawkins et al reported an injury rate of 71 per 1000 player game hours for the 1994 soccer world cup.6 Tournaments may pose a unique set of challenges for medical personnel, reflecting the level of competition, scheduling during a country’s normal competition season, the frequency of match play, and the intense preparation. Environmental factors are also an important consideration.
National representative rugby teams differ greatly between countries in terms of resources, playing levels, and training and playing experience. Our aims in this study were to measure the pattern of injury at the RWC 2003, examine the relation between team success and injury, and provide guidance for future tournament programmes and medical services.
METHODS
Team and player recruitment
The RWC 2003 injury surveillance project was approved by the IRB’s medical advisory committee in 2002. All teams competing in the 2003 Rugby World Cup were requested to participate in the injury surveillance project as part of the Participation Agreement. Explicit informed consent of each participant was obtained as per the protocol approved by University of New South Wales’ human ethics research committee. The consent process was managed by the tournament medical director.
Measurement of injury and participation
Injuries were monitored during each game of the tournament. The primary injury data collectors were the team medical officers. Injury data, such as, player position, diagnosis, and body region, were recorded. The injury definition adopted for the study was: Any injury or medical condition related to a game event that caused a player to leave the field during a game and/or to miss a subsequent game.
Exposure calculations for the tournament were based on an average 80 minute game time each for 15 player positions per team per match. As two teams participated in each match, one game resulted in an exposure of 40 player game hours. Extra time was also considered. For each match 22 players were named for the 15 positions on the field for each team (15 “run-on” and seven substitutes) from a squad of 30. These 15 playing positions per team were the study cohort.
The number of games missed due to injury was calculated. Checks were made with team medical staff to ensure that injury was the main reason for a player missing a game. The interval between each game varied from four to 10 days. An injured player was considered to have recovered when he returned to play, and any subsequent injury was considered to be new. Injuries were classified as mild (left the field or missed a match, or both), moderate (missed two to three matches), or severe (missed more than three matches). In some cases classification was not based on observed participation in tournament games. Absences from games after the conclusion of a team’s involvement in the tournament were based on the professional opinion of the team doctor, the final post-tournament reports from team doctors, and a follow up by the tournament medical director in the month post-tournament.
Data management and statistical analysis
All data were compiled by the tournament medical director, JPB. Data accuracy was checked against official game sheets and medical reports. Game videos were reviewed to identify the injury event when clarification was required. Descriptive statistics were calculated, injury incidence rates and 95th centile confidence (CI) intervals are also presented for comparison for a range of variables both in the text and graphically. Rate ratios (RR) and their significance were calculated.
RESULTS
General injury patterns and rates
In all, 189 injuries were recorded in 48 games with 81 in finalist teams and 108 in non-finalist teams. The total player game exposure was 1930 hours—that is, 40 pool games, eight finals, and one game with 20 minutes of extra time. The injury rate for the tournament was 97.9 injuries per 1000 player game hours (95% CI, 84.7 to 111.19).
The most frequently injured body regions were the head, neck, and face (33.7 (95% CI, 25.6 to 41.7) injuries per 1000 player game hours), followed by the ankle and foot (14 (8.7 to 19.2) injuries per 1000 player game hours), the knee, and the thigh (table 1⇓, fig 1⇓). The rate of injury to the head, face, and neck was over twice the rate of the next most frequently injured body region, the foot and ankle (fig 2⇓).
Distribution of injuries by body region for finalists, non-finalists, and all teams combined

Injury rates by body region for finalists, non-finalists, and all teams combined. The injury rates per 1000 player game hours are shown with 95% confidence intervals in brackets.
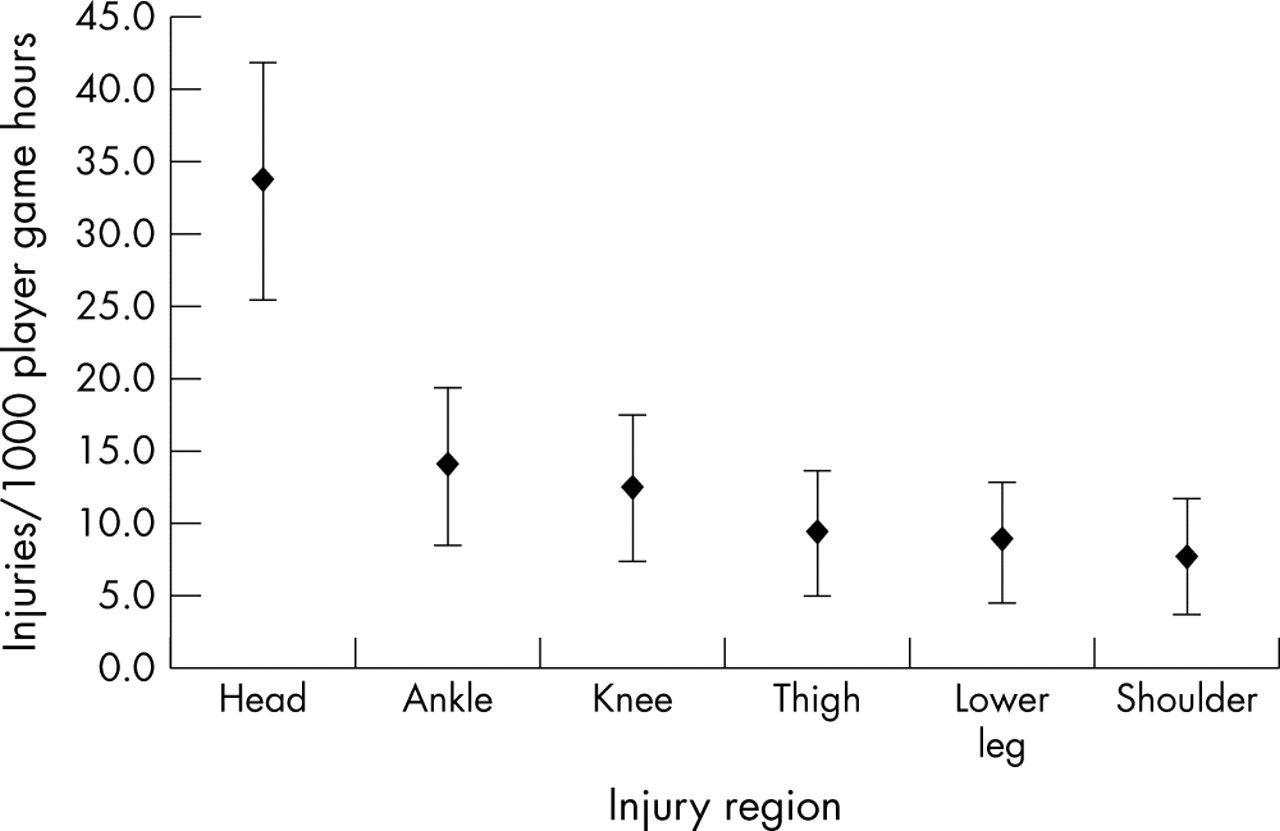
Rates of injury (all teams combined) and 95% confidence intervals for the most often injured body regions. Rates are expressed per 1000 player game hours.
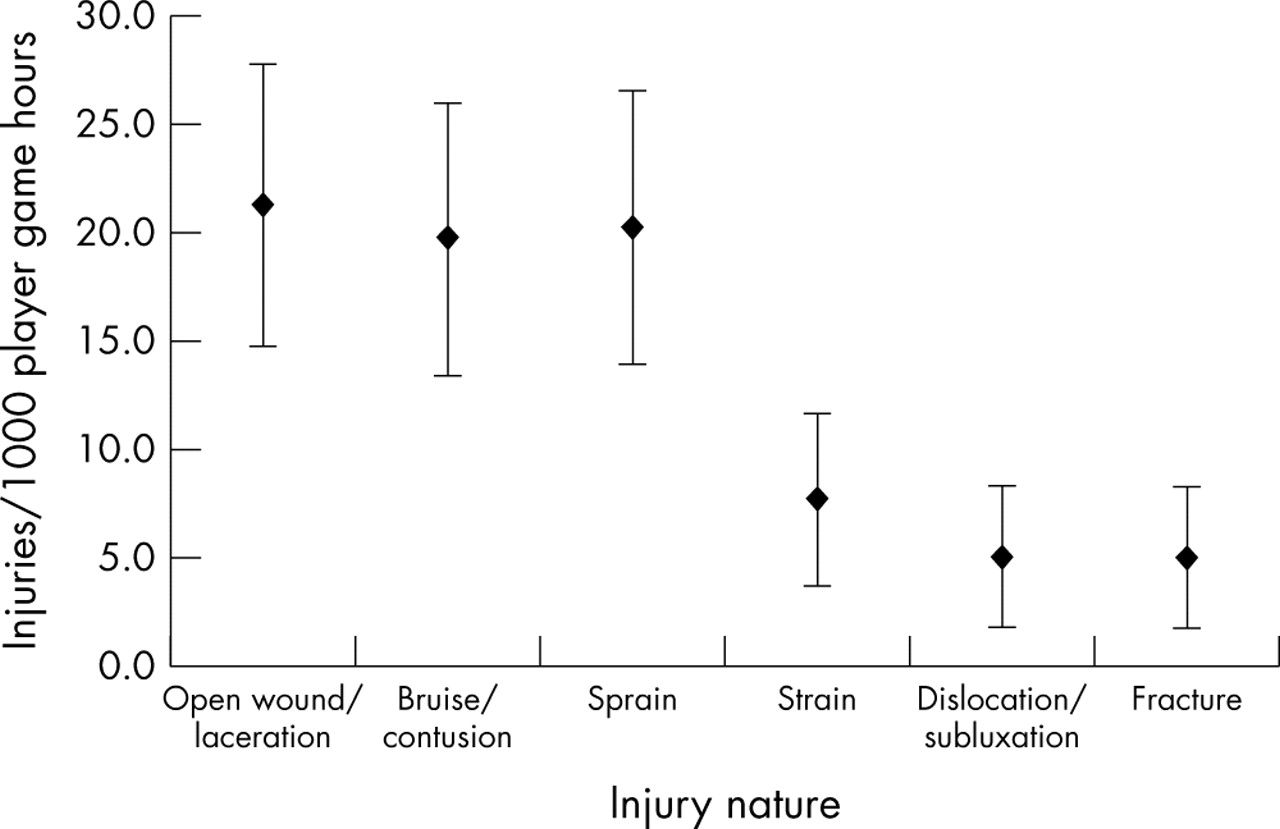
Open wounds, lacerations, or contusions accounted for 42% of all injuries, with the rate of open wounds and lacerations being 21.2 (95% CI, 14.8 to 27.7) per 1000 player game hours, with 92% of lacerations on the head and face. Joint sprains had a similar frequency to superficial injuries (21% of injuries: 20.2 (13.9 to 26.5) per 1000 player hours) followed by muscle strains (8%), which were the next most frequent types of injury. Fractures 5.2 (2.0 to 8.4) and dislocations 5.2 (2.0 to 8.4) per 1000 player game hours accounted for 11% of the injuries, and concussion only 2% (fig 3⇓). There were no cardiac or other medical conditions that resulted in an “injury” during the study.

Rates of injury by injury event or cause (all teams combined).
The tackle—either tackling (20.2 injuries per 1000 player game hours (95% CI, 13.9 to 26.5)) or being tackled (18.7 (12.6 to 24.7))—caused 41% of all injuries (table 3⇓). In general, some form of body contact accounted for almost 80% of all injuries. There were no heat related injuries. The scrum was associated with 5% of all injuries.
Nature of injury by finalists, non-finalists, and all teams combined
Injury event or phase of play for finalists, non-finalist teams, and all teams
Injury severity and missed games
Seventy per cent of injuries were classified as mild, 14% as moderate, and 16% as severe. As expected, fractures and dislocations along with sprains caused the longest absence from the game (fig 4⇓). No player missed more than one game because of concussion.

Length of absence because of injury (all teams combined). Of the 10 fracture cases, only one player was able to return after one week.
Chronology of injury
Table 4⇓ presents the chronology of injury for all teams combined and by severity. The injury rate in the first half was 75.0 injuries per 1000 player game hours (95% CI, 63.2 to 86.8) versus 120.6 in the second half (106.1 to 135.1). The rate ratio was 1.61 (1.2 to 2.2), indicating a significant (p = 0.05) 61% increase in injuries in the second half. Thirty eight per cent of injuries occurred in the third quarter of the game and were predominantly minor (for example, strains) and 43% of all severe injuries occurred in the second quarter.
Chronology of injury.
Finalists v non-finalists
Eight teams reached the finals, and the injury rate during the finals was lower than during the pool games, at 72.7 injuries per 1000 player game hours (95% CI, 44.7 to 100.8) v 103.1 (88.2 to 118.0), respectively. The rate ratio was 1.42 (0.92 to 2.18), indicating a non-significant rate increase of 42% in pool games. The injury rate in non-finalists teams was 112.5 injuries per 1000 player game hours (92.5 to 132.5) compared with 83.5 (66.1 to 100.9) for finalist teams. The rate ratio was 1.35 (1.01 to 1.8), indicating a significant rate increase (p = 0.05) of 35% for non-finalist teams. The non-finalists had a slightly higher proportions of injuries to the head (+7%) and to the ankle and foot (+6%), while the finalists had a higher proportion of knee (+8%) and thigh injuries (+5%). When the injury event was considered the finalists were injured less while tackling (−10%) and more while being tackled (+21%) compared with non-finalists. Non-finalists were injured more often by another player while in a defensive situation compared with finalists (+10%). Fractures and sprains were more common in non-finalists, and missed games were similar for both groups. Table 5⇓ shows that while non-finalist v non-finalists team games accounted for 25% of all games, they provided 31% of all injuries, whereas finalist v finalist games provided 20% of all injuries from the same number of games.
Injury severity by game classification
Player position and injury
The player positions open side flanker, outside centre, and number 8 were the most commonly injured positions (table 6⇓). The injury rates for forwards and backs after adjustment for player position exposure were 104.0 (90.3 to 117.6) and 91.0 (78.2 to 103.9) per 1000 player game hours, respectively. The rate ratio was 0.88 (0.66 to 1.17), indicating a non-significant rate decrease of 12% for backs.
Injury patterns by player position: finalists, non-finalists, and all teams
Injury severity by player position was distributed largely according to the number of positions—for example, three in the front row. Taking the proportion of player positions into consideration, the front row, halves, and inside backs had a high relative frequency of head, neck, and face injury, while the back five and halves had a higher proportion of shoulder and upper arm injuries (table 7⇓, fig 5⇓). Of concern was that injuries to the loose head props (player 1) accounted for 17% of all severe injuries. This included one case of cervical dislocation during a scrum engagement that was a career ending injury.
Distribution of injuries by body region and player position grouping

Proportion of injuries by position grouping.
DISCUSSION
The RWC 2003 Injury Surveillance Project provided a rare opportunity to collect data on 20 international rugby teams competing against each other during a six week tournament. RWC 2003 was the second in the professional era.
The overall injury rate of 98 injuries per 1000 player game hours is high, and comparisons with other datasets are difficult owing to the different protocols applied in sports injury surveillance research. Taking the last point into consideration, Jakoet et al4 reported an injury rate approximately one third of that reported here for the 1995 RWC in South Africa, the last RWC in the amateur era. It has been shown that professionalism has contributed to an increased injury rate in rugby.2,7,8 There is a paucity of data describing injury rates in professional rugby and world championship professional sporting events.
The head, neck, and face were the most frequently injured body regions. The rate of injury to the head, face and neck was over twice that of the other four regions in the top five. The region of injury is similar to that reported by Bathgate et al.2 Injuries to the head provide a justification for why, from our own observations, there has been a gradual increase in the number of representative players wearing headgear; however, the benefits of headgear are unknown.9
Open wounds, contusions, and sprains accounted equally for over 60% of all injuries. Under the “blood bin” rule, a player may have a wound attended to within a 10 minute period. Invariably these are minor injuries and one may argue that excluding such injuries in future studies is warranted to allow more effective analysis of serious musculoskeletal trauma. However, the management of these minor injuries would decrease the overall injury rate and keep players on the field for longer periods of competition. It is our opinion that concussion may be underreported because of concerns by players and team management about the rugby laws. Concussion accounted for only 2% of all injuries—that is, only four concussions—and is the lowest rate ever recorded in any rugby data. Regulation 10 indicates that a player who has suffered concussion “shall not participate in any rugby match or training session for a minimum period of three weeks”. This period may be reduced after “the player is symptom-free and declared fit to play after appropriate assessment by a properly qualified and recognised neurological specialist”.10 The availability of this form of specialist medical advice within a tour party may have been limited, but there were many specialists in Australia during RWC 2003 who could have provided appropriate advice. The IRB’s requirements to clear a player are on one hand consistent with the Vienna consensus on concussion,11 as expert medical advice can be used to declare a player fit, but on the other hand the three week rule in a well monitored tournament may encourage team management, or informed players, to misreport injuries.
The game event resulting in injury was similar to many other studies showing that the tackle accounted for 40% and body contact for 80% of all injuries.2–,4 Even at the elite level, where skills should be the best, injury prevention programmes must focus on body contact, for example the tackle. The scrum was associated with 5% of all injuries. The scrum is an attacking weapon; players and coaches realise that a powerful and skilled front row who dominate an opposing team will have a clear advantage. From a biomechanical point of view, the concern over cervical spine injury remains paramount. As mentioned, a cervical dislocation occurred during this tournament to an experienced player. Further research is required to assist in the prevention of scrum related injury, which might include not only skills but also assessment of factors predisposing to cervical injury.
The data collected informed us of the types of injury and their severity. In order to organise appropriate medical services to cater for the commonly expected medical problems, and some uncommon ones, the data obtained from RWC will be of value to determine what medical services are needed. This includes the types of medical staff, medical equipment, and any liaison with other local medical support services (for example, hospital services). This is particularly relevant when considering what emergency or imaging equipment is required. There were injury cases during the RWC in which spine care and emergency measures were needed. In addition, because of the current absence of injury interchange in rugby union, the doctors generally attend to their players on the field and stay on the sidelines. Suturing of wounds is done in the designated match day medical room, often by a separate medical team. During RWC 2003 the match day medical team organised by the tournament medical officer served this purpose. This may become standard practice for certain levels of rugby. All team physicians were supplied with information regarding environmental and climatic factors to train and play rugby in Australia through a “Medical Services Programme” manual compiled by the tournament medical officer. There was particular focus on heat and humidity and the prevention of heat illness syndromes, and there were no heat related injuries or medical conditions that resulted in a player leaving the field. Considering that some games were played in hot and humid conditions, or in a tropical region of Australia, this indicated that the medical management and tournament procedures in these areas were successful.
There was a significant increase in the rate of injuries in the second half. The explanations for this could include physical and mental fatigue resulting in “structural fatigue” or technical errors leading to unintended or uncontrolled impacts with other players in either team; higher speed and energy impacts as the game opens up; and higher energy impacts in tight games where teams aim to win. It was also observed that 43% of the severe injuries occurred in the second quarter. In agreement with Bathgate et al,2 the third quarter had the greatest rate of injury. It may be an advantage for coaching and conditioning staff to be aware of these statistics to improve player preparation and methods for warming up players, and to develop strategies for player substitution.
A significant difference in injury rates was observed between the finalist and non-finalist teams. If one accepts that the final eight teams are more successful than the 12 non-finalists, the higher rate of injury among non-finalist teams requires explanation. The requirements for playing professional rugby include the availability of a pool of talented players, resources to physically train, technically correct coaching, injury prevention strategies, and correct injury management. Indeed, at community rugby levels these are common safety recommendations.12 The differing size of support staff available to each team at the tournament was testimony to the differing emphasis and availability of these resources. One must ask whether the playing field is level and whether these differences put less successful teams at risk. However, injuries did not simply result from competitive mismatches, as evidenced by injury rates in games between non-finalists. The higher injury rate in non-finalists could reflect the relative proportions of tackles and attacking plays in finalists and non-finalists, as indicated by their on-field success, and poorer defensive skills in non-finalists.
The player positions most subject to injury were open side flanker, outside centre, and number 8. These players are often involved in the tackle and “breakdown”. Thomas,13 of the IRB Game Analysis Centre, showed that there has been a reduction in the number of set pieces (scrum and line-out) and an increase in the amount of second phase play in professional rugby. Second phase play is the situation where the team controlling the ball will aim to “recycle” the ball after a tackle contact is made and a ruck/maul (breakdown) occurs. For example, in the 1999 RWC, 116 second phase events occurred during 41 games, compared with 147 events in 48 games in the RWC 2003, an 8% increase. With the ball being in play for longer, the exposure rate for body contact is increased as more time is spent in the breakdown phase, the phase of play recognised as being associated with the highest injury rate.13
The patterns of injury suggest that developments in injury risk management need to focus on the following areas: reduction in head, face, and neck injury; improvements in team and player skills; management of player fatigue (physical and mental); front row injuries in the scrum; improvement in the management of concussion and return to play guidelines; and prevention of ankle and knee joint injuries. The application of standardised methods for measuring concussion would assist in identifying players impaired by concussion and in determining the exact rate of this injury in future tournaments, once the methods have been adequately assessed in other settings. It might be appropriate, for example, to assess players with head wounds as if they were concussed and to demonstrate no impairment. Environmental factors, awareness of the role of fatigue on injury, the effects of laws on injury management, injury patterns and team success, and the differing level of medical support available to teams are factors that require consideration in the development of tournament medical guidelines.
What is already known on this topic
There are few studies of injury rates in elite or professional rugby. Tournaments pose challenges for medical personnel, reflecting the level of competition, scheduling during the normal competition season, the frequency of match play, and intense preparation.
What this study adds
The injury rate in the Rugby World Cup 2003 was higher than comparative data. Mismatches in the areas of skill, fitness, and the availability of resources for medical care of players may explain the differences. The data on the patterns of injury suggest focal points for injury risk management.
Acknowledgments
We thank the International Rugby Board and Australian Rugby for their support and commitment to injury surveillance. The professionalism and support of the 20 participating team physicians is gratefully acknowledged: Drs M Raftery, M Larrain, G O’Driscoll, M Tune, J Gordain, T Hermerel, J Robson, E McCaig, J Fukuda, D Mangan, T Endean, U Schmidt, S Kemp, B Matalavea, F Olvek, L Sommaruga, J Mayhew, J Williams, V Iercaitano, M Wilkinson, M Everett, and F Pifeleti. The assistance of Mr Daniel Henderson in collecting data during the tournament was greatly appreciated. JPB was the tournament medical director for RWC 2003.
Footnotes
Competing interests: none declared