Article Text

Abstract
Objectives: To investigate the association of soccer playing and long-distance running with total and regional bone mineral density (BMD).
Design: Cross-sectional study.
Setting: Academic medical centre.
Participants: Elite male soccer players (n = 15), elite male long-distance runners (n = 15) and sedentary male controls (n = 15) aged 20–30 years.
Main outcome measurements: BMD (g/cm2) of the lumbar spine (L1–L4), right hip, right leg and total body were assessed by dual-energy x-ray absorptiometry, and a scan of the right calcaneus was performed with a peripheral instantaneous x-ray imaging bone densitometer.
Results: After adjustment for age, weight and percentage body fat, soccer players had significantly higher whole body, spine, right hip, right leg and calcaneal BMD than controls (p = 0.008, p = 0.041, p<0.001, p = 0.019, p<0.001, respectively) and significantly higher right hip and spine BMD than runners (p = 0.012 and p = 0.009, respectively). Runners had higher calcaneal BMD than controls (p = 0.002). Forty percent of the runners had T-scores of the lumbar spine between −1 and −2.5. Controls were similar: 34% had T-scores below −1 (including 7% with T-scores lower than −2.5).
Conclusions: Playing soccer is associated with higher BMD of the skeleton at all sites measured. Running is associated with higher BMD at directly loaded sites (the calcaneus) but not at relatively unloaded sites (the spine). Specific loading conditions, seen in ball sports or in running, play a pivotal role in skeletal adaptation. The importance of including an appropriate control group in clinical studies is underlined.
- bone density
- athletes
- lumbar spine
- male
- runners
- soccer
Statistics from Altmetric.com
Bone acquisition occurs most rapidly in the teenage years (around puberty), although ongoing bone development can continue through the mid-to-late twenties.1 Owing to its positive effect on bone density, weight-bearing physical activity is essential for healthy bone development and maintenance.2 Mechanical loading with weight-bearing activity produces strains on the bone that provide the stimulus for bone remodelling and structural adaptation.3 Different aspects of physical activity (including muscle force, the distribution of strain, the frequency of strain and ground reaction forces) yield specific effects on bone.4 5 In athletes, high-impact activity has been associated with positive bone adaptation responses,6 7 but beyond this, little is known about the influence of sport-specific training factors on skeletal adaptation.
Long-distance running produces a regular pattern of repetitive loading consisting of moderately high ground reaction forces (2.0–3.0 body weight),8–10 whereas ball sports, including soccer, generate higher ground reaction forces (>4.0 body weight) applied in different directions during jumping, landing, starting and stopping, as well as transverse and torsional loads.10 11 Ball sports such as soccer or basketball have been shown to create higher peak strains than running and therefore might stimulate higher bone mineral acquisition and better structural properties.12 13 Milgrom et al12 found that infantry recruits with a history of playing organised basketball for at least 2 years before induction had fewer stress fractures than other recruits, whereas those with a history of long-distance running did not.
A number of cross-sectional studies have individually examined distance runners14 15 and soccer players.13 16 All have reported variable differences in regional bone mineral density (BMD) with each specific sport. Most reports showed general improvements in regional bone density with exercise.
We hypothesised that the varied loading conditions of ball sports would be associated with greater BMD than the lower-impact, repetitive activity of running and non-activity. We conducted a cross-sectional study to compare BMD of elite male soccer players (whose height and weight more closely matched our study group than basketball players), elite male long-distance runners and non-athletic male controls. We chose to study elite adult athletes because generally they have trained for many years, and they train consistently throughout the year. This is the first study to compare elite distance runners and soccer players and non-athletic controls.
MATERIALS AND METHODS
Subjects
Three groups were studied: elite male soccer players (n = 15), elite male long-distance runners (n = 15), and sedentary men as control subjects (n = 15), aged 20–30 years.
Prospective volunteers with obvious gait abnormalities or musculoskeletal disorders were excluded from the study. We used a questionnaire to ensure that all subjects had maintained a stable body weight (±10%) and had been training/playing at their current level of activity for at least the past year, were non-smokers, were not taking any chronic medication or non-steroidal anti-inflammatory drugs, and had no history of prolonged (>3 months) oral steroid use. The study protocol was approved by the Stanford University and Palo Alto Health Care System institutional review boards. All participants gave written informed consent before inclusion in the study.
The long-distance runners had a history of competitive track participation and an onset of training that began when they were 12–16 years of age. Apart from occasional involvement in ball sports during their adolescence, the runners had no history of participation in competitive ball sports since their first year in high school. The subjects were recruited from the Nike Farm Team for elite runners and the Stanford University track team with a collective total of 36 runners who were eligible to participate. Three runners on the Stanford team had a history of lower-extremity stress fracture and were excluded from the study. Of the remaining runners, we chose the first 15 who volunteered. All the runners had a current training regimen of running at least 70 miles a week, maintained for at least 1 year. Normal running surfaces for subjects included trails (flats and hills), roads and tracks. Half of the subjects reported cross-training with upper-body and lower-body weights twice a week for at least 9 months of the year. The remainder did not use weights, but did perform bodyweight conditioning exercises for the upper and lower body twice a week.
Soccer players had participated in club and/or high school soccer since their first year in high school in addition to any other athletic activities. They were in a collegiate division-1 team, and had trained for at least 10 months of the previous year. They were recruited from three local division-1 soccer teams with a collective total of about 80 players who were eligible to participate. All potential players met our inclusion criteria and we chose the first 15 who volunteered. Apart from ball work, typical soccer training included running and sprint workouts on the field. All of the subjects reported cross-training with upper-body and lower-body weights two to three times a week for at least 9 months of the year. Control subjects did not participate in high school ball or track sports and had not engaged in regular exercise activities that involved jogging or running since high school. Because distance runners and soccer players tend to be lean, controls were selected in age, height and weight ranges that matched as closely as possible those of the athletes. Control subjects were Caucasian to match the primary ethnicity of the athlete groups, all of whom were also Caucasian except for one soccer player who was part Japanese and another soccer player who was Hispanic.
Procedures
Age, height, weight and body mass index were recorded. Height was assessed with a standard tape measure on a wall; weight was measured with household scales. BMD (g/cm2) of the lumbar spine (L1–L4), right hip and right leg, as well as total body, was assessed by dual-energy x-ray absorptiometry (DXA) with a Hologic QDR-1000/W pencil-beam bone densitometer (Waltham, Massachusetts, USA, USA) using the spine scan mode (point spacing 0.951 mm, line spacing 1.003 mm). We used the standard total femur measurement region, defined for all DXA assessment. This region extends from the most proximal margin of the femoral neck box (defined as a 1.5 mm width along the neck from the intersection with the greater trochanter) to 10 mm below the distal margin of the lesser trochanter. The right leg was taken from the total body scan, defined as the region from the hip to the toes, defined according to standard DXA analysis protocols. Soft-tissue mass was also obtained from body composition analysis of the total body scan. A single scan of the right calcaneus was also performed with a peripheral instantaneous x-ray imaging bone densitometer to measure the BMD in the area (Lunar Inc, Madison, Wisconsin, USA). All scans were performed by the same technician, and, to ensure quality control, a daily spine phantom was measured. With these techniques, the coefficient of variation in our laboratory has been measured to be <2%.
Statistical analysis
Data were analysed using SPSS software (Statistical Package for the Social Sciences, V.13; SSPS Inc, Chicago, Illinois, USA). A one-way analysis of variance was used to compare the three study groups for physical characteristics and regional bone T-scores. Post hoc Tukey’s honestly significantly different tests were used to determine any significant effects. Analysis of covariance was used to compare BMD adjusted for weight, percentage body fat and age in the three study groups. All p values were adjusted for multiple comparisons using Fisher’s least significant difference method. Differences in means were considered significant if p<0.05 (two-tailed).
RESULTS
Table 1 shows the age and anthropometric characteristics of the subjects. There were no significant differences in the heights of the subjects in the different groups. Runners were significantly lighter than soccer players and controls (p<0.001 and p = 0.02, respectively), and soccer players were significantly younger and had greater lean mass than runners and controls (p = 0.003 and p = 0.002, respectively). As several runners came from the post-collegiate Nike Farm Team, and many controls were also post-college, the mean age of these two groups was higher than that of soccer players (who were all currently playing in college teams). Because the elite runners were extremely lean, controls were similar in weight to soccer players but heavier than runners. The body mass index of runners was significantly lower than that of soccer players and controls (p<0.001). With respect to percentage body fat, there were no significant differences between soccer players and runners, but these groups had significantly lower percentage body fat than controls (p<0.05).
Bone density
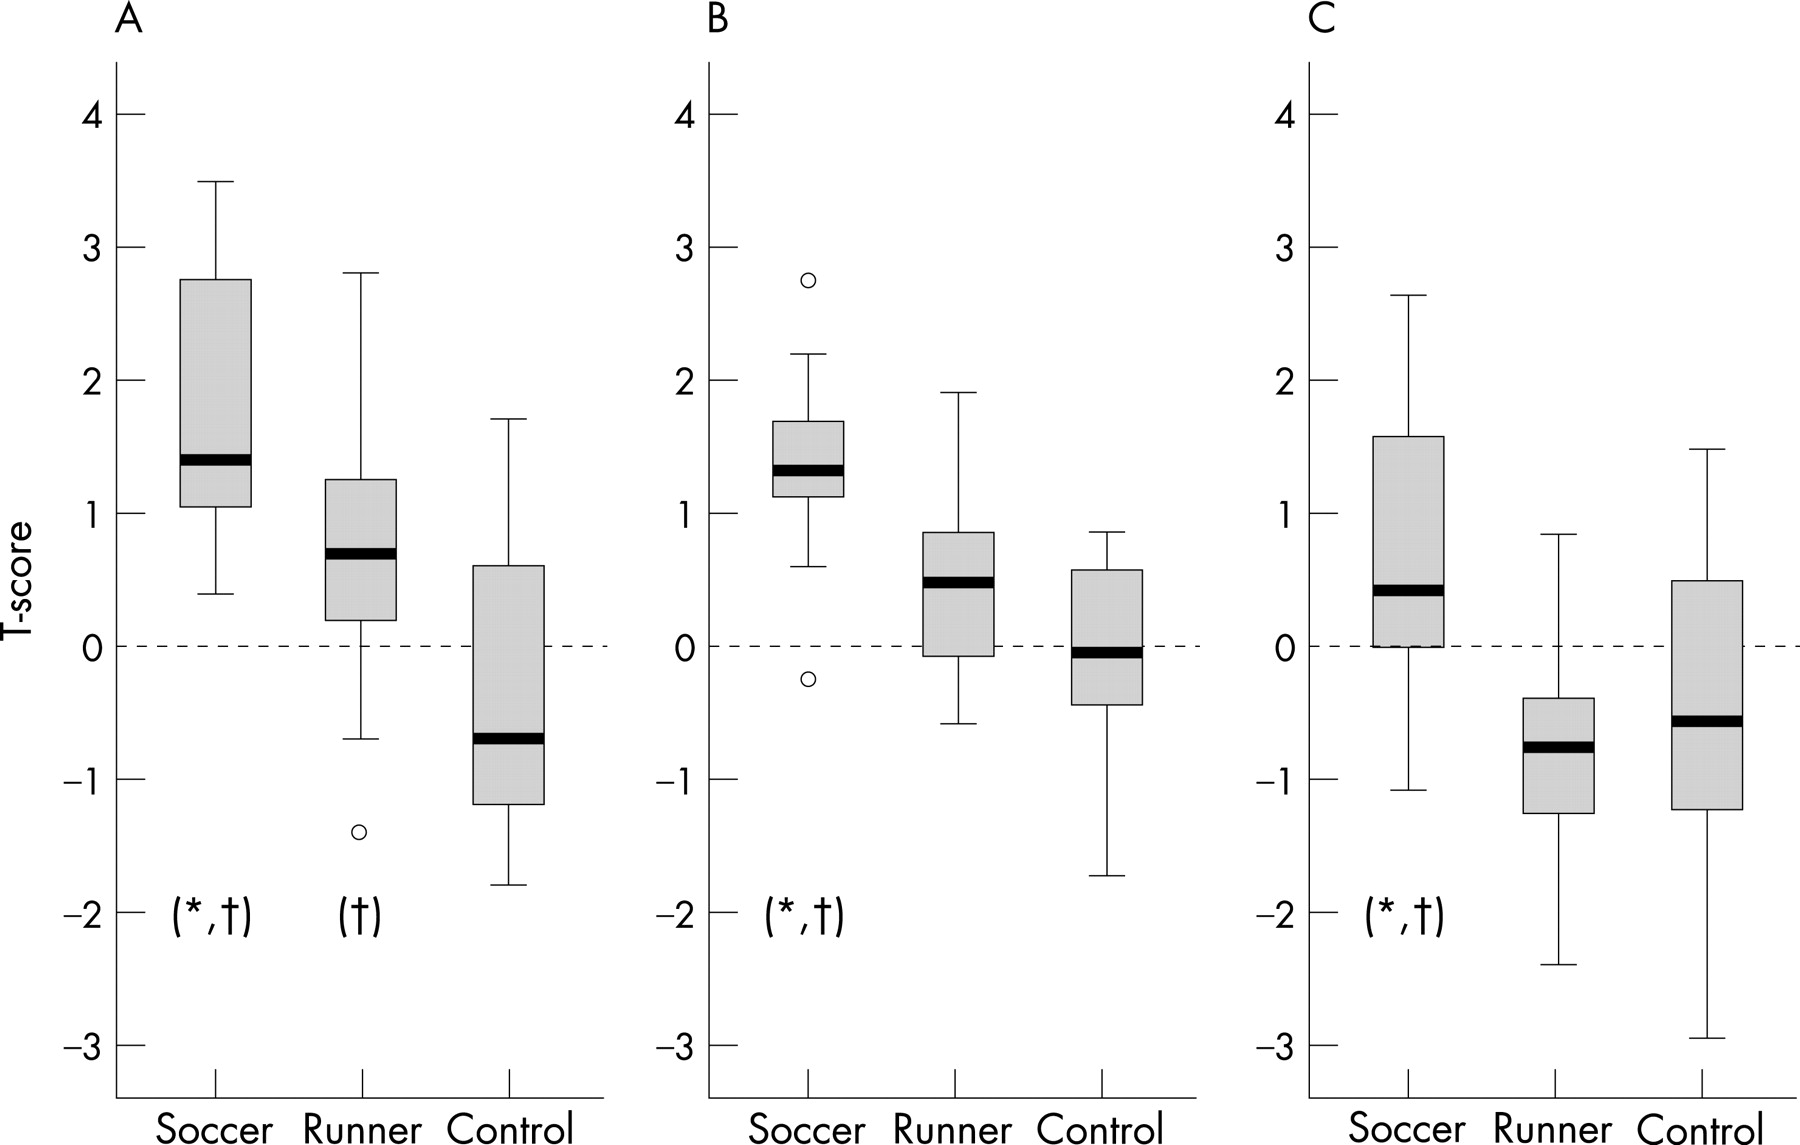
Given that there were significant differences in age, body weight and percentage body fat (which describes body composition better than body mass index and lean mass) in the three groups, bone density comparisons were calculated with adjustments made for these factors. Table 2 and fig 1 show the BMD values and T-scores, respectively, of the three groups. Total body BMD of the soccer players after adjustment was significantly higher than that of controls (p = 0.008).

Hip bone density
The hip T-scores in soccer players and runners were all within the normal range (fig 1). The mean (SD) hip T-scores for the soccer players, runners and controls were 1.34 (0.72), 0.44 (0.71) and −0.08 (0.80), respectively. Soccer players had significantly higher hip T-scores and BMD than runners (p = 0.005 and p = 0.012, respectively) and controls (p<0.001 and p<0.001, respectively). There were no significant differences between runners and controls.
Calcaneal and leg bone density
The mean (SD) calcaneal T-scores for the soccer players, runners and controls were 1.8 (0.96), 0.72 (1.03), and −0.36 (1.03), respectively. Soccer players had significantly higher calcaneal T-scores than runners (p = 0.016) and controls (p<0.001). They also had higher right leg BMD than controls (p = 0.019). Runners had significantly higher calcaneal T-scores and BMD than controls (p = 0.016 and p = 0.002, respectively).
Spine bone density
Soccer players had significantly higher spine T-scores and BMD than runners (p = 0.001 and p = 0.009, respectively) and controls (p = 0.011 and p = 0.041, respectively); however, there were no significant differences between runners and controls. The mean lumbar spine T-scores for the soccer players, runners and controls were 0.69 (1.08), −0.87 (0.85) and −0.53 (1.3), respectively. Of note, 40% of the runners had lumbar spine T-scores between −1 and −2.5. Similar findings were found in 34% of the controls, in whom 27% had T-scores between −1 and −2.5 and 7% had T-scores less than −2.5. The lumbar spine T-scores in soccer players were all within normal limits as set by the manufacturer and defined by the reference database as 2 standard deviations above and below the mean for each age.
DISCUSSION
We found that playing soccer is associated with higher BMD of the skeleton at all sites measured, and that running is associated with benefits to the calcaneus but not the rest of the skeleton. Soccer players had significantly higher BMD values for whole body, hip, spine, calcaneal and right leg than non-athletic controls and significantly higher hip, spine and calcaneal BMD values than runners. Runners had significantly higher BMD only at the calcaneus compared with non-athletic controls.
What is already known on this topic
It is well know that weight-bearing physical activity is essential for healthy bone development.
Different aspects of physical activity (including muscle force, the distribution and frequency of strain, and ground reaction forces) yield specific effects on bone, with higher-impact activity being particularly associated with positive bone adaptation responses.
Little is known about the influence of specific loading conditions, seen in ball sports or in running, on skeletal adaptation.
What this study adds
This study found that soccer playing is associated with higher bone mineral density of the skeleton at all sites measured, whereas long-distance running is associated with benefits only to the calcaneus.
Soccer involves intermittent and high-intensity activities that include sprinting, jumping, accelerating, and decelerating, as well as transverse and torsional loads brought about by fast changes in body displacement direction.17 18 These changes create high peak strains on the skeleton that are known to stimulate bone mineral acquisition.19 20 Our data suggest that long-term exposure to these loading patterns is beneficial to bone density at all sites measured. In contrast, running primarily loads the foot and leg in a repetitive manner, which our data suggest gives site-specific but not overall benefits to bone density.
Several cross-sectional studies have suggested that elite male distance runners and cyclists have deficits in spine bone mass comparable to the deficits seen in women athletes with the female athlete triad.14 21–23 In our cohort, 40% of the runners had low lumbar spine T-scores consistent with osteopenia by WHO criteria. Several hypotheses have been put forth to explain these observations: elite runners may have increased levels of stress hormones,24 lower testosterone levels,25–28 or increases in inflammatory mediators29 that affect bone turnover. However, our data offer an alternative explanation: these findings may simply reflect an artificially high reference mean. For example, similar to our findings, Hind et al14 reported that 36% of elite male distance runners in their sample had T-scores below –1.0 (with a mean T-score of –0.8). They concluded that elite male runners face a threat to their bone health. However, they did not include a non-athletic control group, and thus may have over-interpreted their results. We speculate that the lower spine T-scores in runners and controls in our study may simply represent differences between the study population and the BMD reference population.30 We note that even the soccer players’ spine T-scores are relatively low compared with their other T-scores. Alternatively, the low spine T-scores in runners and controls may be the result of a chance variation in our small sample. Larger, well-controlled prospective studies are needed to clarify the effects of elite running on spine bone density in men.
The strengths of this study include the use of an appropriate non-athletic control group and the use of a truly elite athletic population. Because this is a cross-sectional study, we cannot rule out confounding as an explanation for our findings. However, we adjusted for several potential confounders in our bone density comparisons, including age, percentage body fat and weight. One limitation is that we did not precisely measure (and thus did not adjust for) weight training, which was higher in soccer players and runners. This could pose as a confounding factor in the observed results as seen in previous reports of higher lumbar spine BMD in weightlifters compared with runners.31 Because of the cross-sectional design, we cannot rule out a role for self-selection: people with genetically strong muscles and bones may be more likely to choose to play soccer, and people with genetically small frames may choose to run. We also acknowledge the limitation of DXA-derived areal BMD: being two-dimensional, the parameter is greatly influenced by body size and cannot capture differences in true volumetric BMD of cortical and trabecular bone. Finally, we note that our findings in elite athletes may not be generalisable to recreational runners and soccer players.
CONCLUSION
This cross-sectional study of elite athletes found that soccer playing is associated with higher BMD of the skeleton at all sites measured, whereas long-distance running is associated with benefits only to the calcaneus. Specific loading conditions, seen in ball sports or in running, play a pivotal role in skeletal adaptation. We underscore the importance of including an appropriate control group in clinical studies.
REFERENCES
Footnotes
Competing interests: None.
- Abbreviations:
- BMD
- bone mineral density
- DXA
- dual-energy x-ray absorptiometry