Article Text

Abstract
Objective: The objective of this study was to determine the incidence of contact events in professional rugby union matches and to assess their propensity to cause injury.
Design: The study was a two-season (2003/2004 and 2005/2006) prospective cohort design. It included 645 professional rugby union players from 13 English Premiership rugby union clubs. The main outcome measures were: incidence of match contact events (events per game); incidence (injuries per 1000 player-hours and per 1000 contact events), risk (days lost per 1000 player-hours and per 1000 contact events) and diagnosis of injury; referee’s decision. Risk factors were player–player contact, position on pitch and period of play.
Results: Tackles (221.0 events/game) and rucks (142.5 events/game) were the most common events and mauls (13.6%) and scrums (12.6%) the most penalised. Tackles (701.6 days/1000 player-hours) were responsible for the greatest loss of time but scrums (213.2 days lost/1000 events) and collisions (199.8 days lost/1000 events) presented the highest risk per event.
Conclusions: Tackles were the game event responsible for the highest number of injuries and the greatest loss of time in rugby union because they were by far the most common contact event. Collisions were 70% more likely to result in an injury than a tackle and scrums carried a 60% greater risk of injury than a tackle. The relative propensities for contact events to cause injury were rated as: lineout – very low; ruck – low; maul and tackle – average; collision and scrum – high.
Statistics from Altmetric.com
Rugby union is one of the world’s most popular team sports.1 The philosophy of this sport2 dictates that the game is physical in nature, which means that the risk of injury during matches is high.3 The majority of injuries at the senior and elite levels of rugby union result from contact phases of play,3–10 with the main causes being the tackle (24–58%), ruck (6–17%), maul (12–16%), collision (8–9%) and scrum (2–8%). Players’ risk of match injuries in any sport is described by the product of the incidence and the average severity of the injuries sustained during competition (the incidence of injury being defined by the product of the frequency with which events having the potential to cause injury occur and the probability that these events will result in injury).11 Although there have been a number of studies reporting the incidence of match injuries, there is only limited information12–14 available about the frequency of occurrence of some contact events in rugby union and no information available about the probability with which contact events result in injury. The relevance of this information in terms of injury prevention was demonstrated in a study by Fuller et al.,15 who compared the proportions of various tackle actions in men’s international football (soccer) with the proportions of match injuries caused by these actions: the study highlighted a number of tackle actions that, although occurring with a low frequency, had a high propensity to cause injury. Consequently, the International Football Association Board16 broadened the definition of what constituted serious foul play within the Laws of Football (Law 12) to “a tackle, which endangers the safety of an opponent, must be sanctioned as serious foul play”.
The need to quantify the numbers and types of player contacts in rugby union has been recognised previously in two contexts. Garraway et al.17 (page 41) stated that it was “essential that information be collected on the circumstances of the vast majority of tackles in an average game of rugby union football where no injury occurs” in order to develop strategies for understanding and reducing the number of injuries resulting from tackles. Duthie et al.18 (page 529), on the other hand, stated that “accurate quantification of player contacts in rugby is required to elicit more specific information on the physical demands of the game”, as this could lead to the development of more relevant training regimens for players. The aims of the present study were to determine the incidences of contact events in professional rugby union and to assess the propensity for these events to cause injury.
METHODS
All players who were first team squad members at 13 of the 14 English Premiership rugby union clubs involved during the 2003/04 (11 of 12 teams; 434 players) and 2005/06 (ten of 12 teams; 401 players) seasons took part in the study. In total, 645 different players were included, of whom 190 were involved in both seasons. Players gave their written informed consent for injury data to be recorded in the study. The study was approved by the University of Nottingham Medical School Research Ethics Committee.
Injury assessment and match exposure
The time-loss injury definition and research design employed in this study followed the recommendations presented in the consensus statement on injury surveillance studies for rugby union.19 A prospective, cohort study design was employed to collect match injury and exposure data. Medical personnel at each club recorded time-loss match injuries resulting from contact events together with their associated injury details using a standard report form:3 individual injury forms were submitted following the player’s return to play/training. Injury diagnoses were recorded using the Orchard Sports Injury Classification System (OSICS)20 and injuries were subsequently grouped for the type and location of injury according to the recommendations presented in the rugby union consensus statement on injury surveillance.19 Injury severity was defined by the total number of days elapsed from the day of injury until the player was available for full training and competition. Players’ match exposures were recorded every week.
Assessment of contact events
A sample size calculation21 was undertaken in order to ensure that the number of games analysed in the study would be sufficiently large to identify whether there were significant differences in the incidence of contact events between the two seasons. For this purpose, the sample size calculation was based on the incidences of the less common events (collision, lineout, maul and scrum), which were estimated12 13 to be about 25 events per game for each type of contact. In order to identify a 20% difference in the incidence of a contact event with 90% power and 95% confidence required 23 games to be assessed in each season. Therefore, 25 games involving the teams taking part in the study were randomly selected from the 132 games played in both the 2003/04 and 2005/06 seasons; DVD recordings of these 50 matches were obtained from the Rugby Football Union for analysis.
Every contact event (collision, lineout, maul, ruck, scrum and tackle) that occurred during each match was identified and defined by a range of categorical variables. Values for all event variables were assigned with regard to the ball-carrier, who was identified as the player/team in possession of the ball at the beginning of the event:
Time (min, s).
Field location:
Field half (ball-carrier or opposition’s half of the pitch);
Field corridor (right flank – the area between the ball-carrier’s right touch-line and the adjacent 15 m line; left flank – the area between the ball-carrier’s left touch-line and the adjacent 15 m line; centre-field – the area between the two 15 m lines);
Field aisle (in-goal – the area between the goal-line and the dead ball line; 22 m – the area between the goal-line and the 22 m line; mid-field – the area between the 22 m line and the half-way line).
Type of event (tackle – in which the tackler attempts to stop the ball-carrier with the use of his arm(s); collision – in which the tackler attempts to stop the ball-carrier without the use of his arm(s); lineout; maul – each maul also identified as to whether it collapsed; ruck; scrum – each scrum also identified as to whether it was a reset scrum (i.e. a reset of a previous scrum) and whether the scrum collapsed.
Event outcome (no medical attention received by player(s); player(s) received medical attention but remained on or returned to the field of play after medical attention; player(s) received medical attention and did not return to the field of play).
Referee’s decision (legal; player/team penalised).
Inter-rater reliability
All DVD recordings were analysed by one of two experienced full-time rugby union match video analysts. One match was selected randomly from the 50 games analysed and was assessed independently by both analysts. Rater A identified 438 and rater B 442 events in this match: rater-A identified 95.4% and rater-B identified 94.6% of the events identified by the other rater. Inter-rater reliability for each of the variables was assessed using the kappa statistic for categorical variables:21 field half: κ = 0.92; field corridor: κ = 0.92; field aisle: κ = 0.94; event type: κ = 0.94; event outcome: κ = 0.73; and referee’s decision: κ = 0.79. κ values between 0.4 and 0.75 are considered to represent fair to good agreement and values greater than 0.75 excellent agreement.21
Data analysis
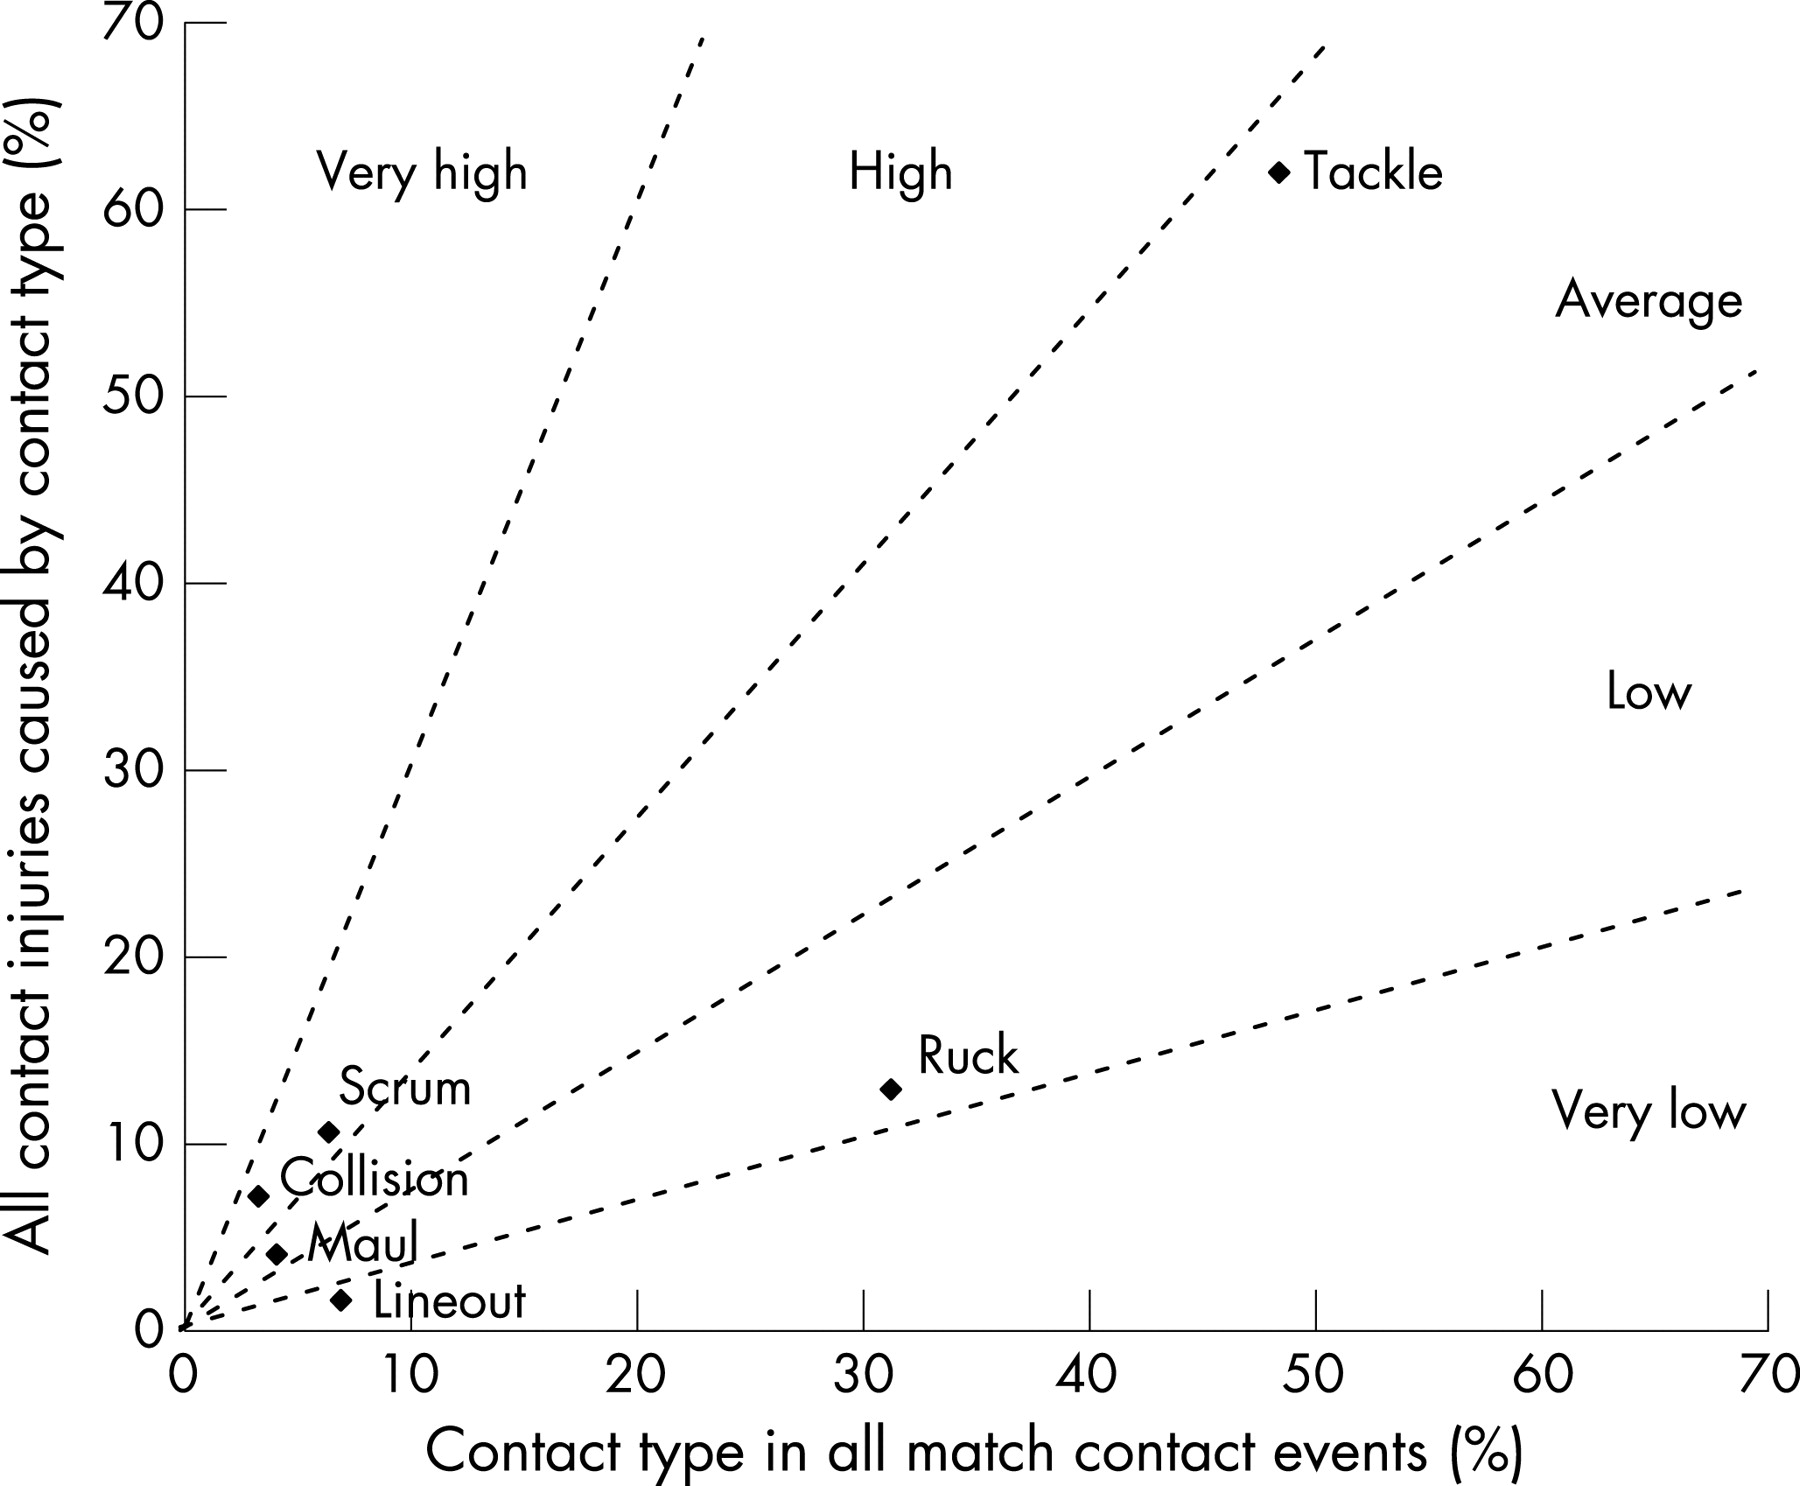
The incidence of events was reported as the number of contact events/game; the incidence of injury as the number of injuries/1000 player-hours and number of injuries/1000 contact events; and the risk of injury as the number of days lost/1000 player-hours and the number of days lost/1000 contact events. Differences between groups were considered to be significant if the 95% CIs of the values did not overlap and the p value (two-tailed Z test for the comparison of rates and proportions21) was less than 0.01. Chi-square tests were used for identifying significant differences (p<0.01) in the numbers of injuries amongst groups.21 The method of least squares was used to provide best-fit straight lines and Pearson’s product moment correlation coefficient (r) for assessing the association between two variables.21 The relative propensity for individual types of contact event to cause injury was assessed by comparing the frequency (%) with which the contact events occurred in the injured population against the frequency (%) with which they occurred in the total contact event population. If the probabilities of sustaining an injury from the contact events were based solely on chance, the resultant graph would show a straight-line relationship with a slope of +1 as all contact events would be equally likely to cause an injury.15
RESULTS
In total, 22 842 contact events (2003/04: 11 263; 2005/06: 11 579) were identified in the 50 matches: the incidences for each type of contact event are shown in table 1.
Of the 1447 scrums, 249 (17.2%) collapsed and 435 (30.1%) were reset scrums; of the 921 mauls, 617 (67.0%) collapsed. The numbers and proportions of each type of contact event that were penalised by the referee and the numbers and proportions of events that resulted in players receiving on-pitch medical attention as a function of whether the events were penalised are presented in table 2.
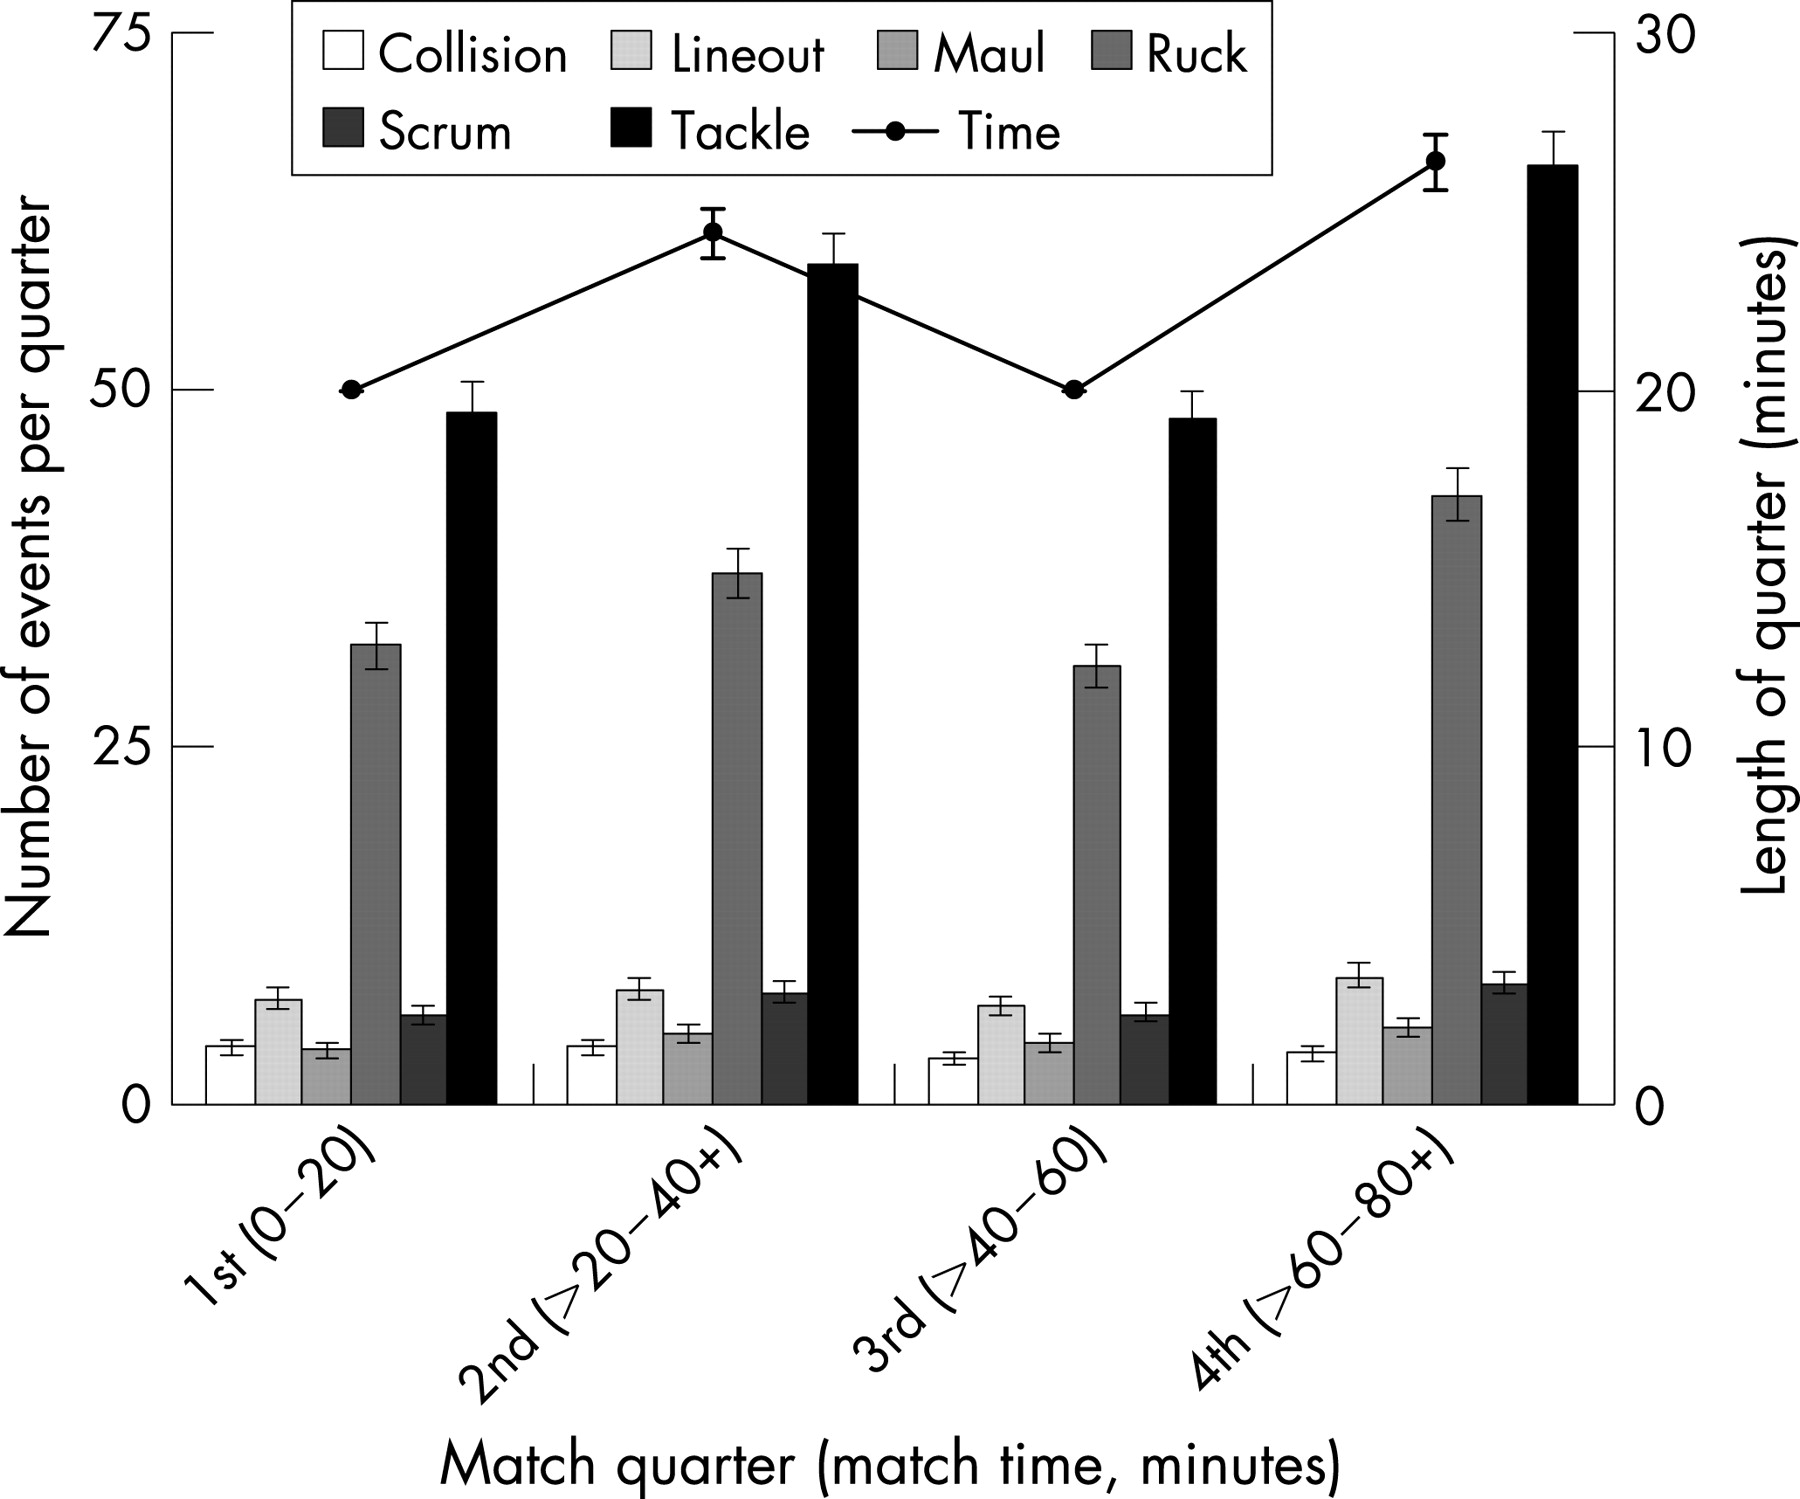
Collapsed scrums were significantly (p<0.001) more likely to be penalised by referees than scrums that did not collapse but collapsed mauls were no more likely to be penalised than mauls that did not collapse (p = 0.88). The numbers of contact events that occurred in each match quarter together with the average length of time associated with each quarter are shown in fig 1 and the percentages of each type of contact event that occurred within the various areas of the pitch are presented in fig 2.

Overall, 760 time-loss match injuries were recorded by the 13 teams over the two seasons (9238 player-hours of match exposure), of which 497 injuries (65.4%) resulted from player–player contact events. The number, average severity, incidence and risk of injury expressed as a function of the types of contact event causing the injuries are presented in table 3.
Of the 54 scrum injuries, four (7%) were sustained in collapsed scrums and of the 21 maul injuries, 12 (57%) were sustained in collapsed mauls. Significantly more forwards than backs were injured in mauls (forwards: 19; backs: 2; p<0.001) and rucks (forwards: 45; backs: 20; p = 0.010), whereas significantly more backs than forwards were injured in the tackle (forwards: 143; backs: 170; p = 0.006); there was no significant difference for collisions (forwards: 18; backs: 18; p = 0.69). The locations and types of injury sustained as a result of each type of contact event are shown in figs 3 and 4, respectively.
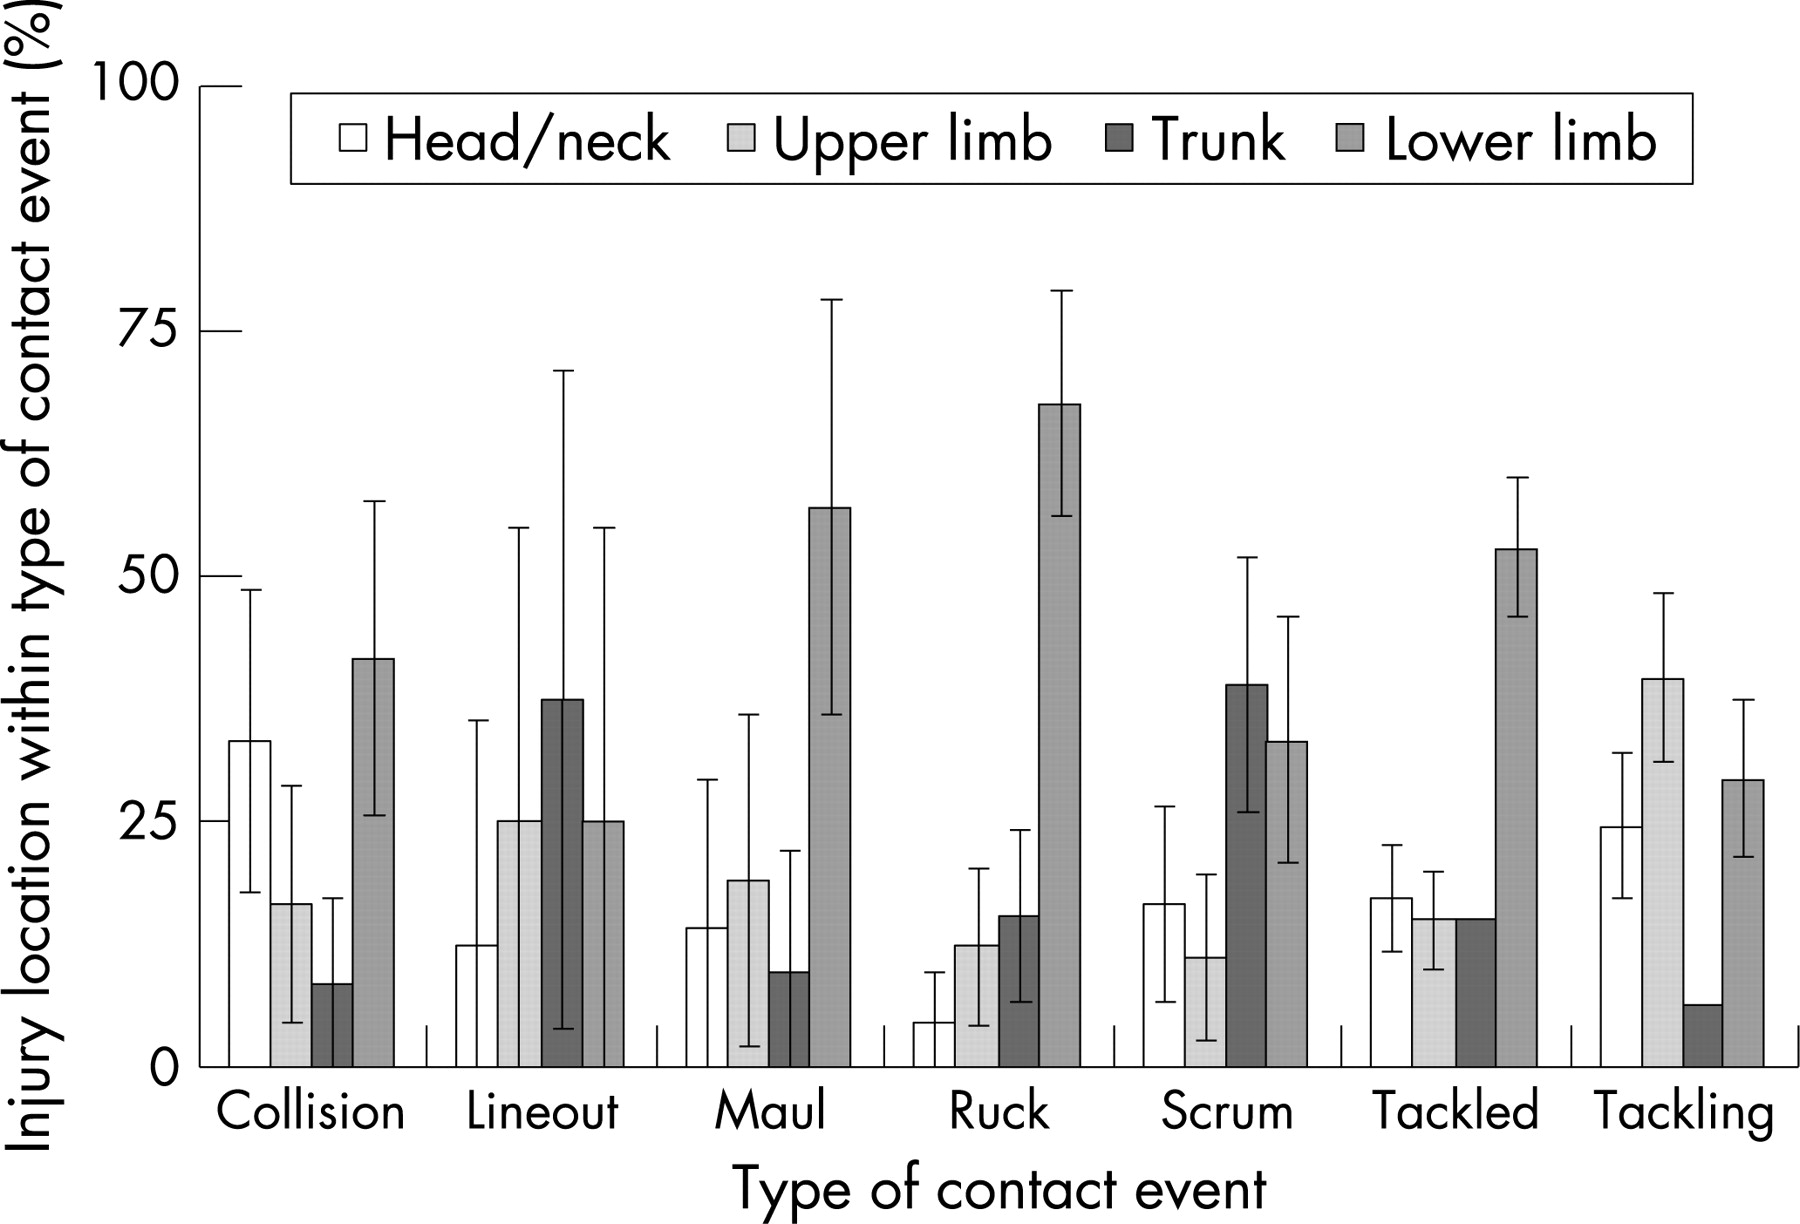

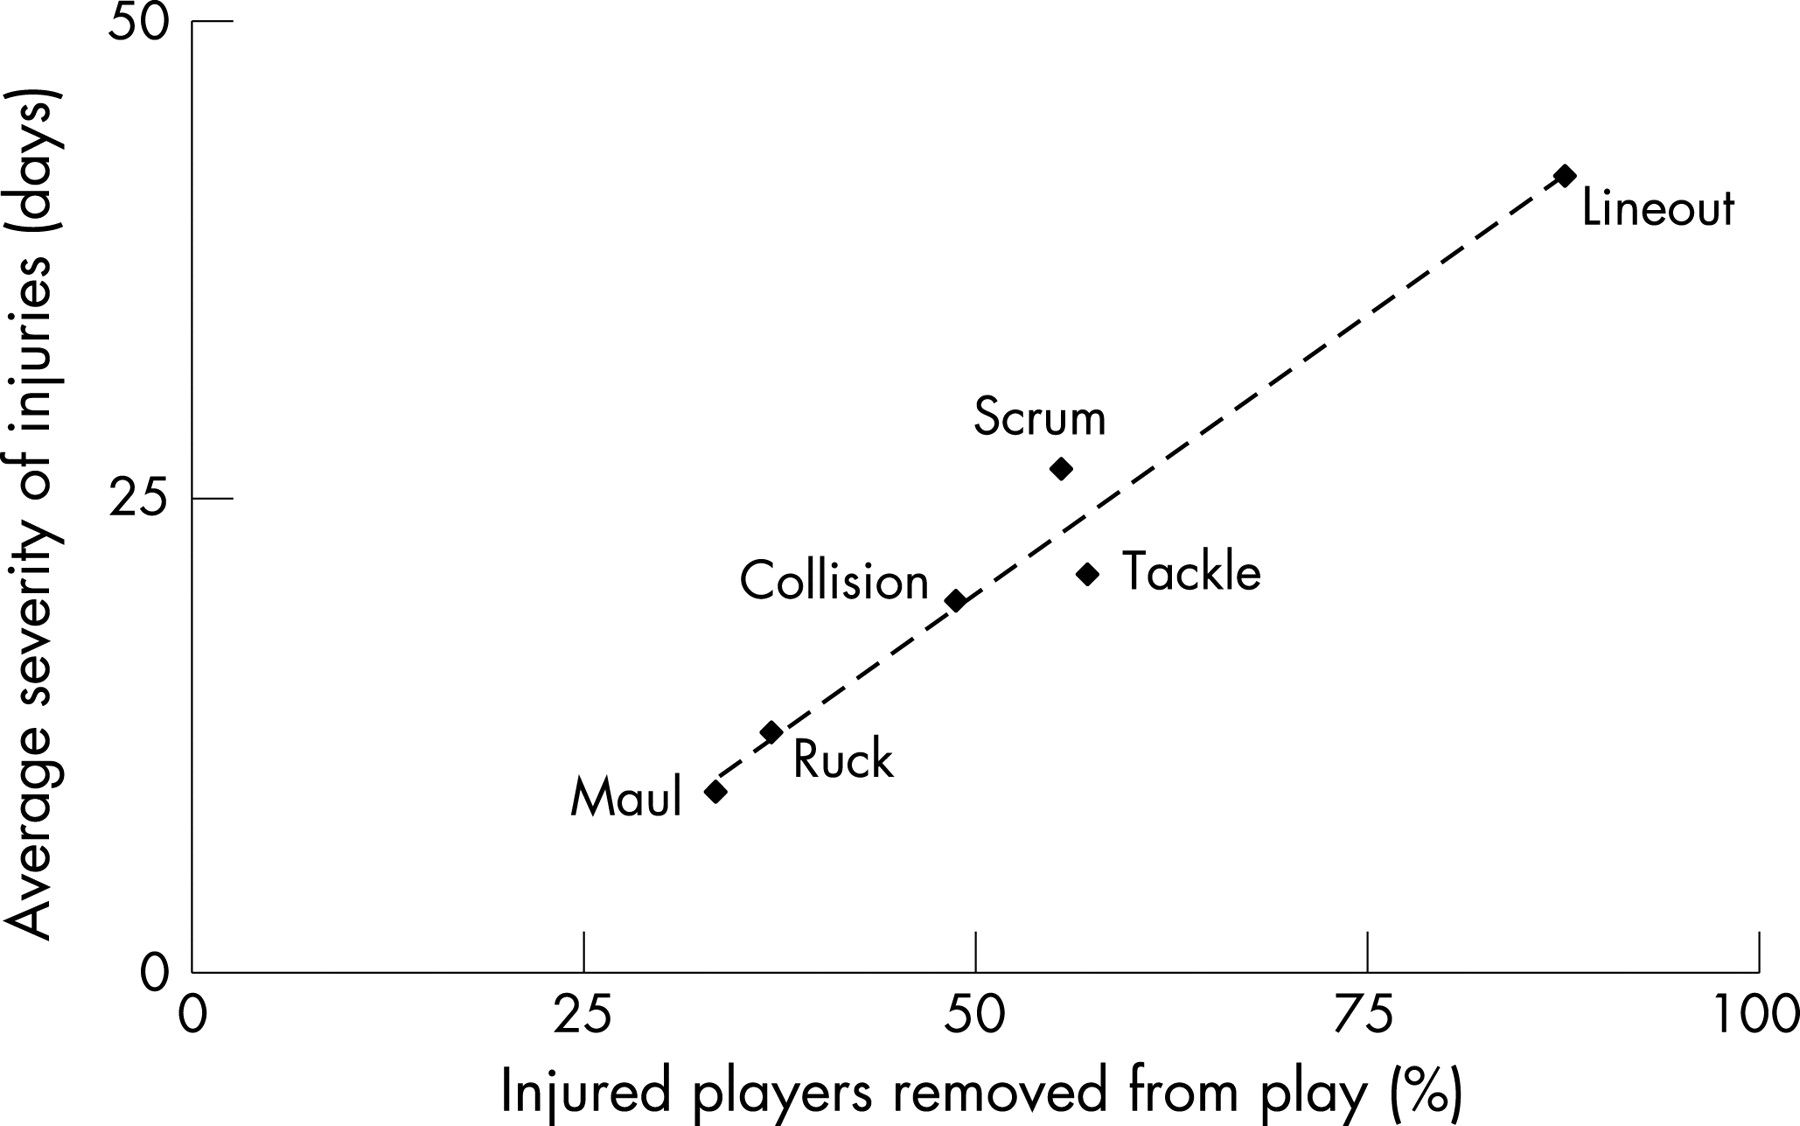
The most common injuries sustained in each type of contact event were as follows. Collision: thigh muscle haematoma (seven) and head/facial fracture (five); lineout: cervical (one)/lumbar (two) facet joint injury; maul: knee (five) and foot/ankle (three) ligament injury; ruck: calf muscle haematoma (12) and foot/ankle ligament injury (ten); scrum: calf muscle strain (12) and lumbar disc injury (eight); tackling: shoulder ligament injury (17) and concussion (14); and being tackled: thigh muscle haematoma (29) and knee ligament injury (22). Fig 5 shows that there was a linear association (r = 0.982) between the proportions of players removed from play as a result of sustaining an injury and the average severity of the injuries.
The numbers of injuries sustained during each type of contact event were significantly different (p<0.001) from those predicted from the frequency of occurrence of the contact events in general play. This difference is illustrated in fig 6, which provides a comparison between the proportion of injury events caused by each type of contact event and the proportion of the corresponding contact events that occurred in general play.
DISCUSSION
As the incidences of the various contact events varied by only 2–11% in the two seasons, it was concluded that there were no significant differences in the style or intensity of play by the teams involved in the two seasons, and therefore it was acceptable to combine the data from the two seasons for all other analyses. The high average number of contact events recorded per game (456.8) demonstrated the dynamic and physical nature of modern rugby union and the high level of attrition experienced by players. In particular, the high incidences of the tackle (221.0 events/game) and ruck (142.5 events/game) highlighted the importance of these phases of play in the current professional game and confirmed the observation by Eaves and Hughes in 2003 that the incidence of rucks in rugby union had been increasing since 1988 (1988/92: 62.4 events/game; 1993/95: 76.0 events/game; 1996/99: 111.6 events/game; 2000/02: 134.4 events/game).13 The lineout and scrum made smaller and mauls and collisions the least contributions to the overall structure of the game. The average numbers of lineouts, rucks/mauls and scrums per game observed in this study compare closely with results previously reported12 for international teams playing in tournaments in the northern and southern hemispheres (table 4).
This indicates that the structure of games is similar at the professional club and international levels and that the higher incidence of injury at the international level9 10 may, therefore, reflect the greater power and anthropometric characteristics of international players.
The numbers of events recorded in the four match quarters for each type of contact event were directly proportional to the time played in the quarter; therefore, the higher numbers of events observed during the second and fourth quarters reflected the additional time allowed by referees at the end of each half for stoppages rather than indicating a change in the nature or intensity of play during these periods. The distribution of the contact events, in terms of pitch location, reflected the general strategy of play at this level of rugby union, which generally involves those teams gaining possession of the ball in their own 22 m area being more likely to kick to touch or centre-field to gain field position than attempting to move the ball up-field through retained possession. On the other hand, when teams are in the opposition’s half they are more likely to retain possession of the ball through the use of open play. For example, the results showed that the frequency of occurrence of all types of contact event increased as play moved from the ball-carrier’s 22 m area through their own midfield and into the opposition’s midfield area. Furthermore, the highest proportions of collision, ruck, scrum and tackle events consistently occurred within the centre-field; however, the highest proportion of mauls occurred down the flanks, thereby demonstrating the link between lineouts and mauls. The higher proportion of lineouts taken by teams in the opposition’s 22 m area compared with the proportion taken in their own 22 m area highlights the tactic for teams to kick penalties to touch into the opposition’s 22 m line in order to retain possession through the resultant lineout and a driving maul towards the goal line.
Overall, 5.2% of events were penalised, with mauls and scrums the most penalised and tackles and collisions the least penalised events. Significantly (p<0.001) higher proportions of the lineout, collapsed-maul, ruck and tackle events penalised by the referee resulted in players receiving on-pitch medical attention than occurred for events that were not penalised. For collisions and scrums however, events that were not penalised were more likely to result in players receiving on-pitch medical attention than occurred for events that were penalised, although the differences were not statistically significant. Eighty-eight per cent of players who sustained an injury during a lineout were removed from play, whereas only 33% of players sustaining injuries during a maul were removed, which reflected the difference in the average severity of injuries associated with these events.
Tackles (33.9 injuries/1000 player-hours) caused five times more injuries than any other type of contact event, but collisions (10.5 injuries/1000 events) had a greater propensity to cause injury than other types of event. There was no indication that scrums or mauls were more likely to cause injury if they collapsed; however, this study could not take into account the risk of very low frequency, catastrophic injuries associated with collapsed scrums and mauls. When the severity of injuries, which reflects the specific injury profiles associated with each type of contact event, was taken into account, tackles (701.6 days lost/1000 player-hours) presented the greatest risk to players compared to other contact events. However, scrums (213.2 days lost/1000 events) and collisions (199.8 days lost/1000 events) presented a greater risk per event than other events, although it should be recognised that each scrum involves 16 players. Using a similar protocol to that proposed by Fuller et al.15 for assessing tackle events in football, the relative propensity for contact events in rugby union to cause injury were categorised as: lineout – very low; ruck – low; maul and tackle – average; and collision and scrum – high; no contact events fell into the very high category.
In conclusion, this study has highlighted a number of important issues related to injuries in rugby union and has identified areas where further detailed research is required. Tackles, as has been consistently reported previously, were responsible for the highest number of injuries and the greatest loss of time in rugby union. This study, however, showed that this situation probably occurred simply because the tackle was the most common contact event. Collisions were much less common but were 70% more likely to result in an injury than a tackle. The risk associated with this form of contact is recognised within Law 10.4(g), which identifies2 charging or knocking down an opponent without trying to grasp the player as dangerous play. Despite this, however, referees penalised few collision events as dangerous play. Similarly, scrums were less common than tackles, but a scrum carried a 60% greater risk of injury than a tackle. As 30% of scrums were resets, there was almost a 50% increase in forwards’ exposure to the risks of scrums; in addition, with one in six scrums collapsing, there was a small added risk to forwards of sustaining a catastrophic injury during this phase of play. These additional scrummaging risks could be reduced through more effective scrum control and/or more rigorous penalties being imposed on players and teams causing the breakdown of scrums. Finally, the fact that collapsed mauls were no more likely to cause injury than non-collapsed mauls is particularly relevant in the context of the debate within the International Rugby Board22 about whether defending teams should be allowed to collapse mauls without penalty. At the present time, intentionally collapsing a scrum or maul is an offence under Law 10.4(i), as this action is deemed to be dangerous play.2 Although referees were significantly more likely to penalise a scrum that collapsed, they were no more likely to penalise a maul that collapsed, even though mauls were four times more likely to collapse than scrums.
What is already known on this topic?
The majority of injuries in rugby union result from contact phases of play. There is little information available about the frequency of the various types of contact event in a game of rugby union or the likelihood that a particular type of contact event will result in injury. It is not possible therefore to identify which type of contact event carries the greatest risk of injury.
What this study adds
Tackles were the most common event in rugby union and resulted in the most injuries. Collisions and scrums had the highest propensity to cause injury, whilst lineouts and rucks were the least likely to cause injury.
Acknowledgments
The authors would like to acknowledge the work of Tony Ashton (PGIR Ltd), who undertook analysis of match DVDs. The authors acknowledge the work of the medical staff at those Premiership clubs providing injury data. The authors would also like to acknowledge The International Rugby Board (Dublin) for their financial support in carrying out this study.
REFERENCES
Footnotes
Competing interests: None.