Article Text

Abstract
Background: B-mode measurement of the sagital diameter of the Achilles tendon based on a manual tracing (MT) procedure is partly dependent on the subjectivity of the reader. The aim of this study is to establish a standardised automatic procedure to differentiate between normal and chronically degenerated tendons. For this comparison, the tracing results of the tendon boundaries of an automatic identification (AI) process, already established with the detection of intima–media thickness, are compared with computer-assisted MT.
Methods: The detection of the tendon boundaries was performed in 115 ultrasound images including the cranial border of the calcaneal tuberosity. The measured section (starting point 4 cm away from the anterior boundary of the calcaneal tuberosity) amounted to 3 cm, and was divided into three sub-segments (1 cm each). Intra- and inter-reader/observer variability for mean and maximum Achilles tendon thickness (ATT) with AI and MT were evaluated. A normal group and a group with clinically diagnosed chronic tendon degeneration had mean and maximum ATT readings compared.
Results: Using MT, the intra- and inter-reader variability was 3.0% and 6.8%, respectively, using AI the variability was 1.6% and 3.9%, respectively. Mean and maximum ATT were measured systematically lower by AI compared to MT in all regions by 0.4 mm. The AI procedure was most accurate in the second segment. The mean ATT and maximum ATT were correctly detected in 93.9% and 96.6% of the images.
Conclusion: The AI procedure detected the ATT with a high level of precision in all three segments. The most robust measurement was reached in the second segment. It eliminates most of the inter-/intra-reader variability in ATT measurement using MT. We suggest this new method could be a new gold standard for quantification of chronic disorder in Achilles tendons.
Statistics from Altmetric.com
The incidence of tendinopathia in developed countries has increased during the last few years.1 2 Frequently, these injuries are associated with damage from overuse in running and ball games as well as workload.1–3 For qualitative diagnostics of these acute and chronic disorders, B-mode ultrasound (US) has become the gold standard during the last few years.4–7 B-mode has more spatial and contrast resolution for superficial tendon structures than MRI, and allows dynamic, real-time examination.2 The main advantages of ultrasound are cost-effectiveness, quick examination time, wide accessibility and non-invasivity.3 7 8 The information gained during an ultrasound investigation often renders more costly imaging examinations, such as MR imaging, unnecessary.7
Tendinosis is often characterised by lack of clinical symptoms, but increases the incidence of Achilles tendon ruptures significantly.1 3 Fredberg et al state that, for prediction of tendinosis, ultrasound is a relevant recent clinical method useful for its ability to detect asymptomatic alterations in the tendon.4 Based on these alterations, Grassi et al postulated that ultrasound images of normal healthy tendons show fine parallel internal linear echoes (fibrillar pattern) and the tendon contour appears regular and sharply defined, whereas the typical ultrasound image of a degenerated Achilles tendon is characterised by areas of altered echogenity and contour defects.8 These discontinuations of the tendon structure (interrupted fibrils) are histologically related to an augmentation of glycoprotein and the inclusion of water.8 9 This pathological process causes an increase in the Achilles tendon thickness (ATT).1 10 The ATT can be measured in ultrasound images and is an established parameter for quantifying the degeneration of the Achilles tendon.4 5 11 However, intra- and inter-observer error due to the examiner’s (in)experience can cause a high variability in results from manual examination of ATT from ultrasound images.3 Automatic detection methods as applied in US of the carotids12 could reduce variability and afford a better reproducibility of Achilles tendon US ATT results. Concerning carotid US, Gustavsson et al developed a program that detected the contour of the vessel border by use of grey value analysis.13 This program, however, did not allow an exact detection of the boundary area between intima and media.13–15 Schmidt-Trucksäß et al established an active contour model to detect the intima–media complex in a more exact, reproducible and universal way.14–16
The aim of this study was the establishment of a new contour detection program, based on the algorithm for intima–media thickness analysis, for Achilles tendon ultrasound that allows the detection of the maximal and mean ATT in a more objective and reproducible way.
METHODS
Subjects
A total of 59 subjects were included in the study; 35 healthy control subjects (CS: mean (SD) age: 38.7 (10.9)) were compared to 24 manually traced subjects (MTS: mean (SD) age: 45.8 (11.4) with a manifest Achilles tendinosis.
Exclusion criteria included acute tendinitis, tendon rupture, insertional tendinosis as well as familiar hypercholesterinaemia, as it is assumed that US morphology for these special conditions differs from regular tendinopathy. Orthopaedic examination confirmed the clinical diagnosis prior to inclusion. A qualitative ultrasound examination of the Achilles tendon was performed. All information received during the examination was recorded in a standardised scheme. In the MTS, all patients suffered from Achilles tendon pain for more than 3 months, 3 had unilateral and 21 had bilateral tendinosis.
None of the healthy volunteers had any signs of Achilles tendon tendinosis according to their history and the clinical examination. No healthy subject showed any characteristics of tendinosis such as increase of thickness or hypoechogenic areals. All examinations were performed by an orthopaedic surgeon.
The CS and the MTS group were age matched in order to exclude age as a strong confounder of ATT. All study subjects gave informed consent prior to their participation in the study. The study was formally approved by the Ethics Committee of the Freiburg Medical Faculty.
Ultrasound examination
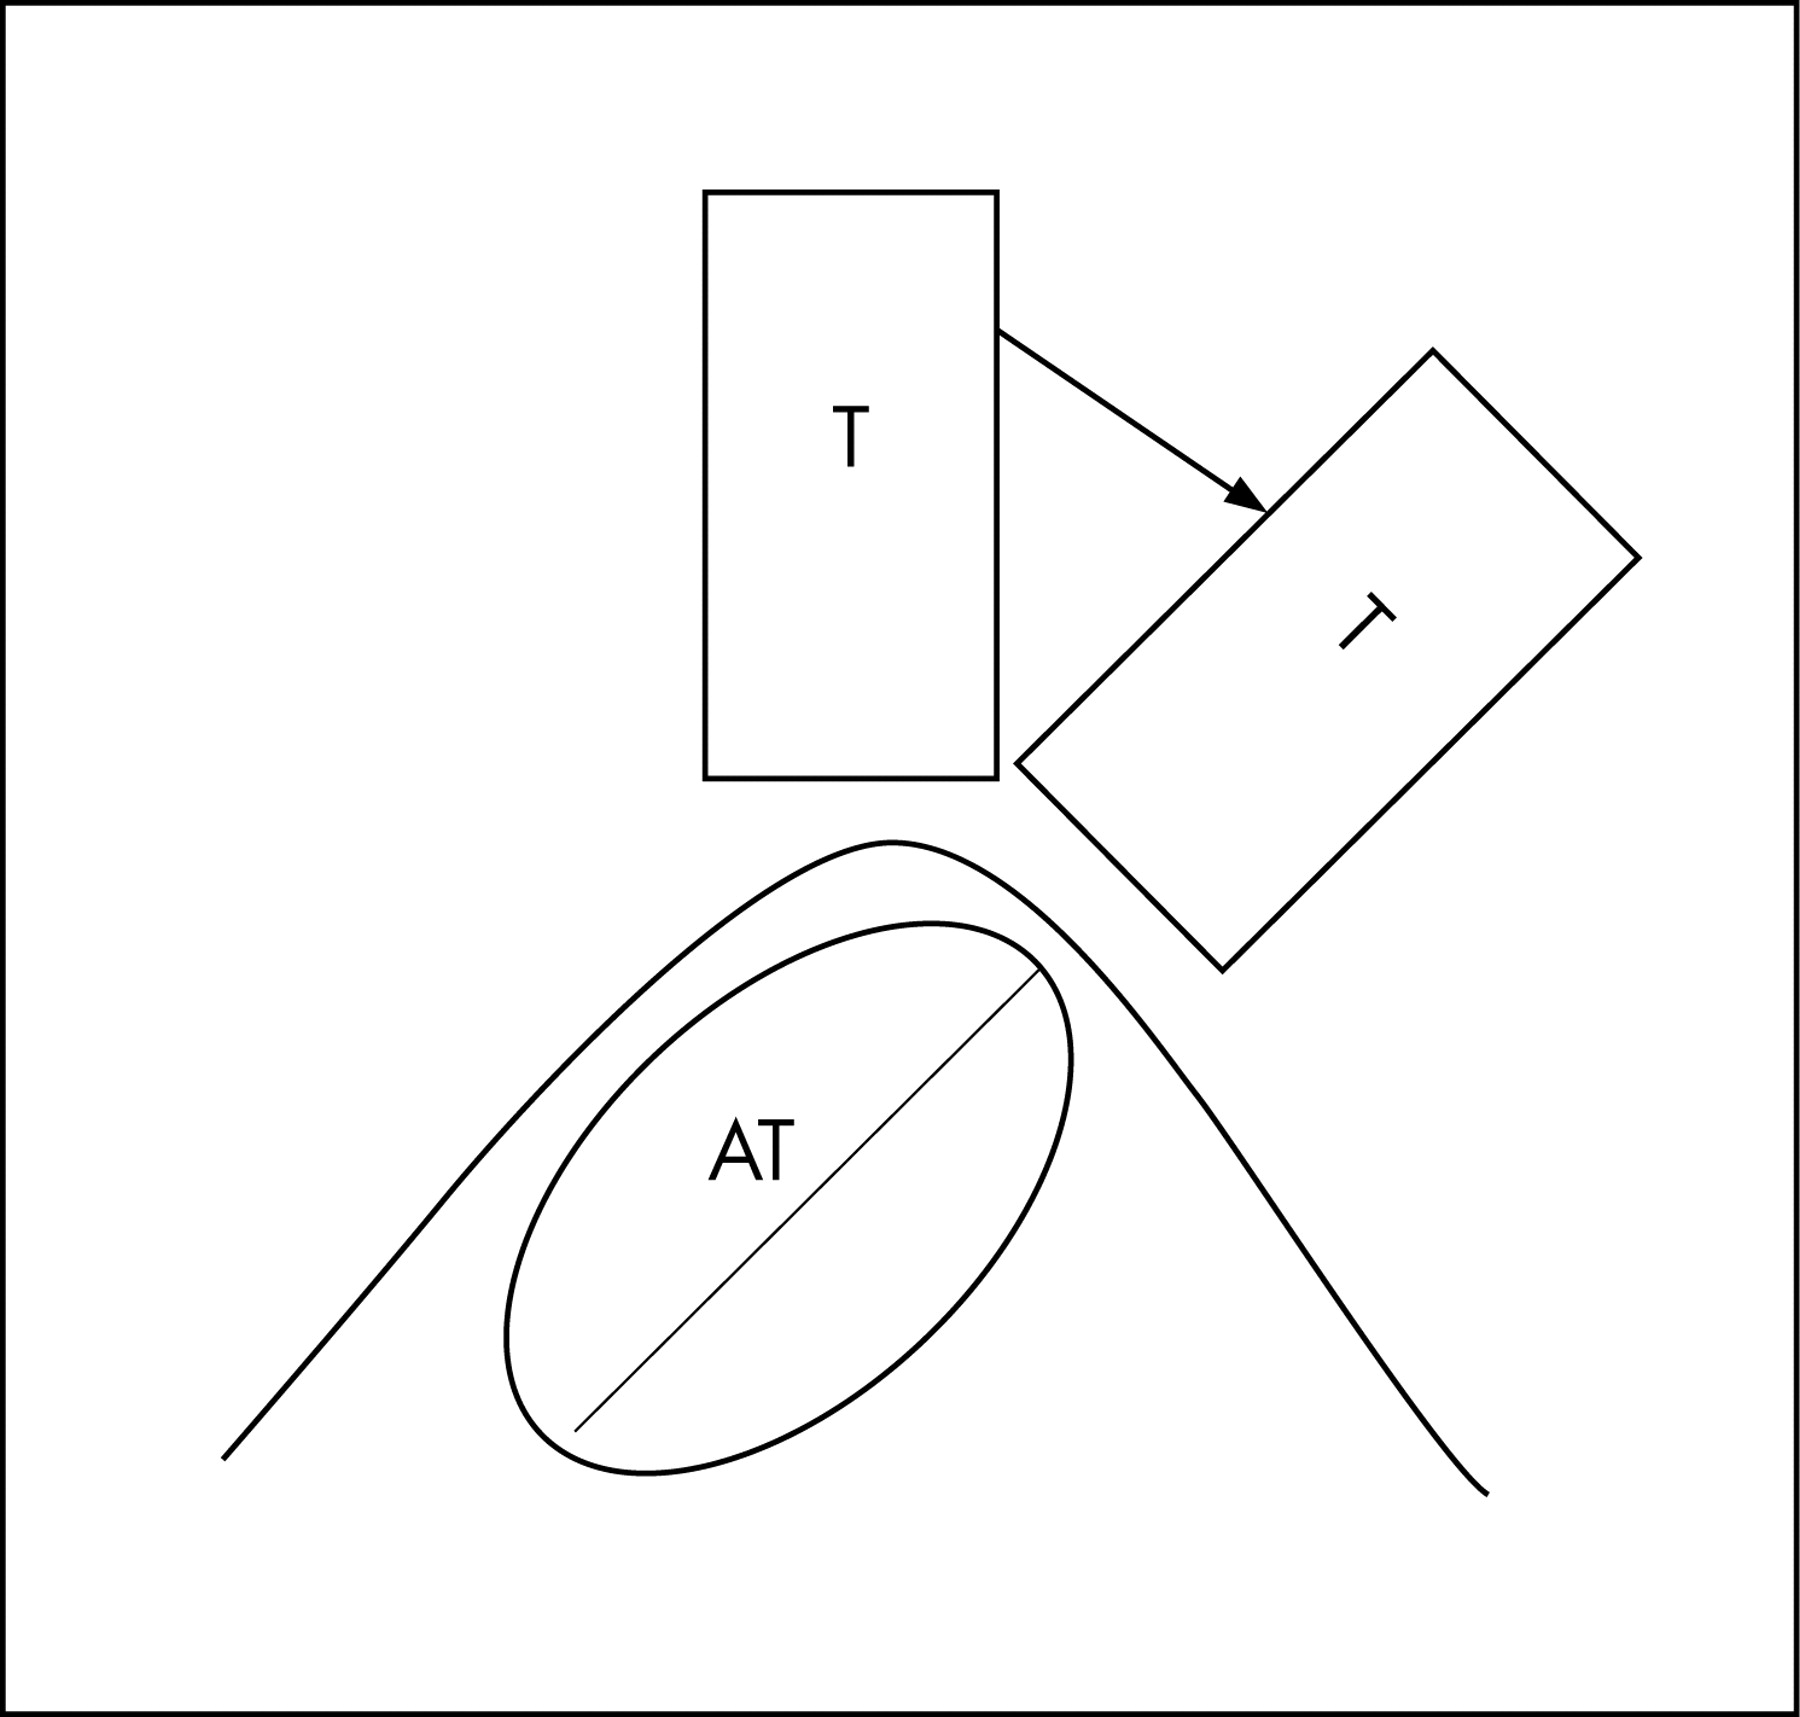
The ultrasound examination was performed after a 15 min sitting period. A Toshiba SSA (Tokyo, Japan) high resolution ultrasound scanner was used, with a linear 10 MHz transducer and an aperture of 52 mm. For the examination of the Achilles tendons the ankles of the study subjects were fixed in a neutral position. The transducer was placed in a rectangular position on the ankle. Due to the ellipsoid anatomy of the Achilles tendon and its marked medial obliquity17 the transducer was inclined until the maximal diameter of the Achilles tendon was reached (fig 1).

The Achilles tendon was first scanned for a longitudinal image and then the transducer was rotated by 90 degrees to achieve an image of the cross-sectional axis, which is standard in Achilles tendon ultrasound. In this position, the near and far boundaries were demonstrated. The images were intermittently stored with the cine view function of the ultrasound system and directly afterwards the images were digitally recorded on a disk (Sony DKR-700, Tokyo, Japan) to minimise the intra-beat variability of the ATT. All examinations were also videotaped in order to be able to allow further interpretation of the US images if required. A total of 24 US images were taken by two independent sonographers in order to study inter-observer variability. A total of 18 images were taken twice by the same sonographer in order to study intra-observer variability. The readers of the images were blinded to the tendon status of the person whose images were analysed.
Manual and automatic identification process of the Achilles tendon layers
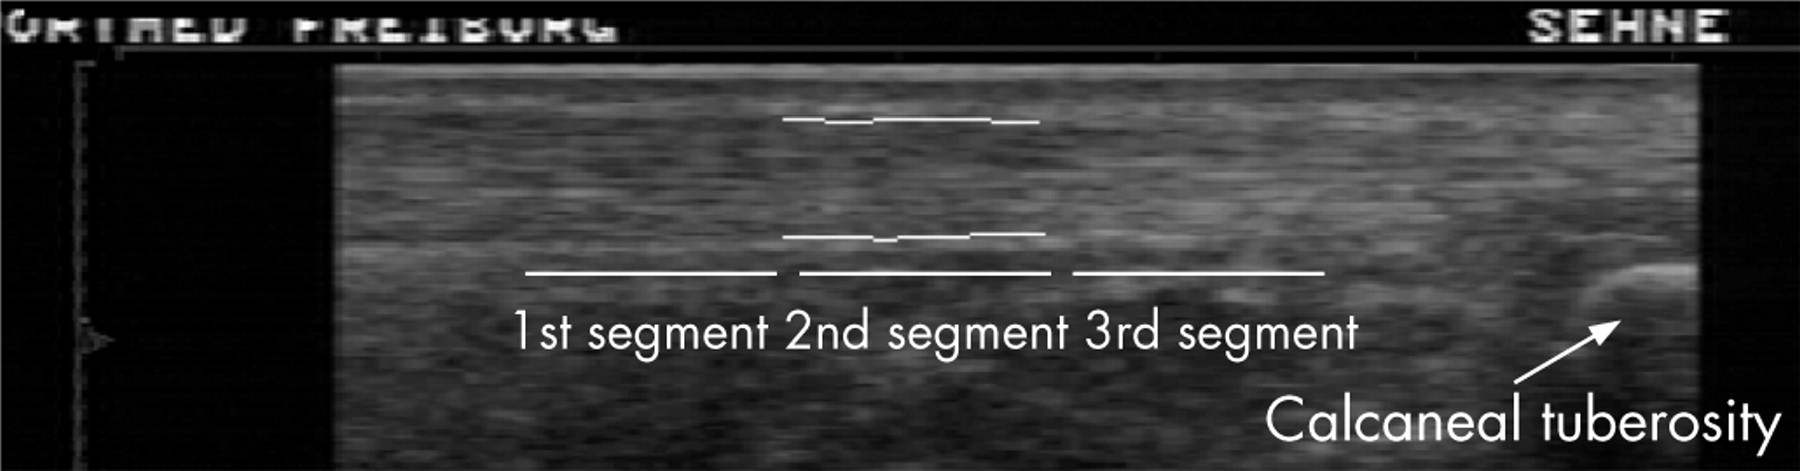
The far and the near wall were defined as the two first echogenic layers across the more hypoechogenic zone inside the Achilles tendon. The near and far walls were retraced automatically and manually (length 3 cm). The segment was divided into three sub-segments (each 1 cm). The starting point of the measurement was the cranial border of the calcaneal tuberosity, to guarantee better reproducibility and standardisation. Manual and automatic detection were processed by use of the same starting point. Between the ending point of the third segment and the starting point, neither the AI process nor the MT process was able to detect the contour reproducibly and robustly. Because of the histopathological characteristics of this segment of the Achilles tendon, it is very difficult to demonstrate the contours sonographically in this region.
A manual analysis was performed on 115 images. The far and near wall were retraced five times. The average of these five measurements was used to quantify the ATT. The maximum ATT was defined as the highest value of the ATT in the segment, and the mean ATT was the arithmetic mean of 72 measurement points in each 1 cm sub segment (depending on the magnification of the image).
The AI process takes into consideration the echo gradient values and continuities of the two boundaries of the Achilles tendon.14 15
For the assessment of the inter-reader variability of the MT and the AI procedure, two experienced readers traced the near and the far boundaries twice, once using MT and once using the AI procedure. All tracings were performed blinded to each other. If the AI procedure detected a tendon segment incorrectly judged by visual monitoring, these tendon segments were excluded from the analysis. To make sure that only the reading differences between MT and AI procedure, and not the influence of anatomical variations, were evaluated, one reader repeated the MT of the tendon segments five times (MT5x). The mean values for all five measurements were calculated. An accurate measurement of four fixed points (1, 2, 3 or 4 cm away from starting point) were extracted from the AI and the MT5x procedures. To assure that only the reading difference between AI and MT procedure and not the influence of anatomical variations were evaluated, the same start and endpoints were used for all AI and MT analysis of any given image (fig 2).

Statistics
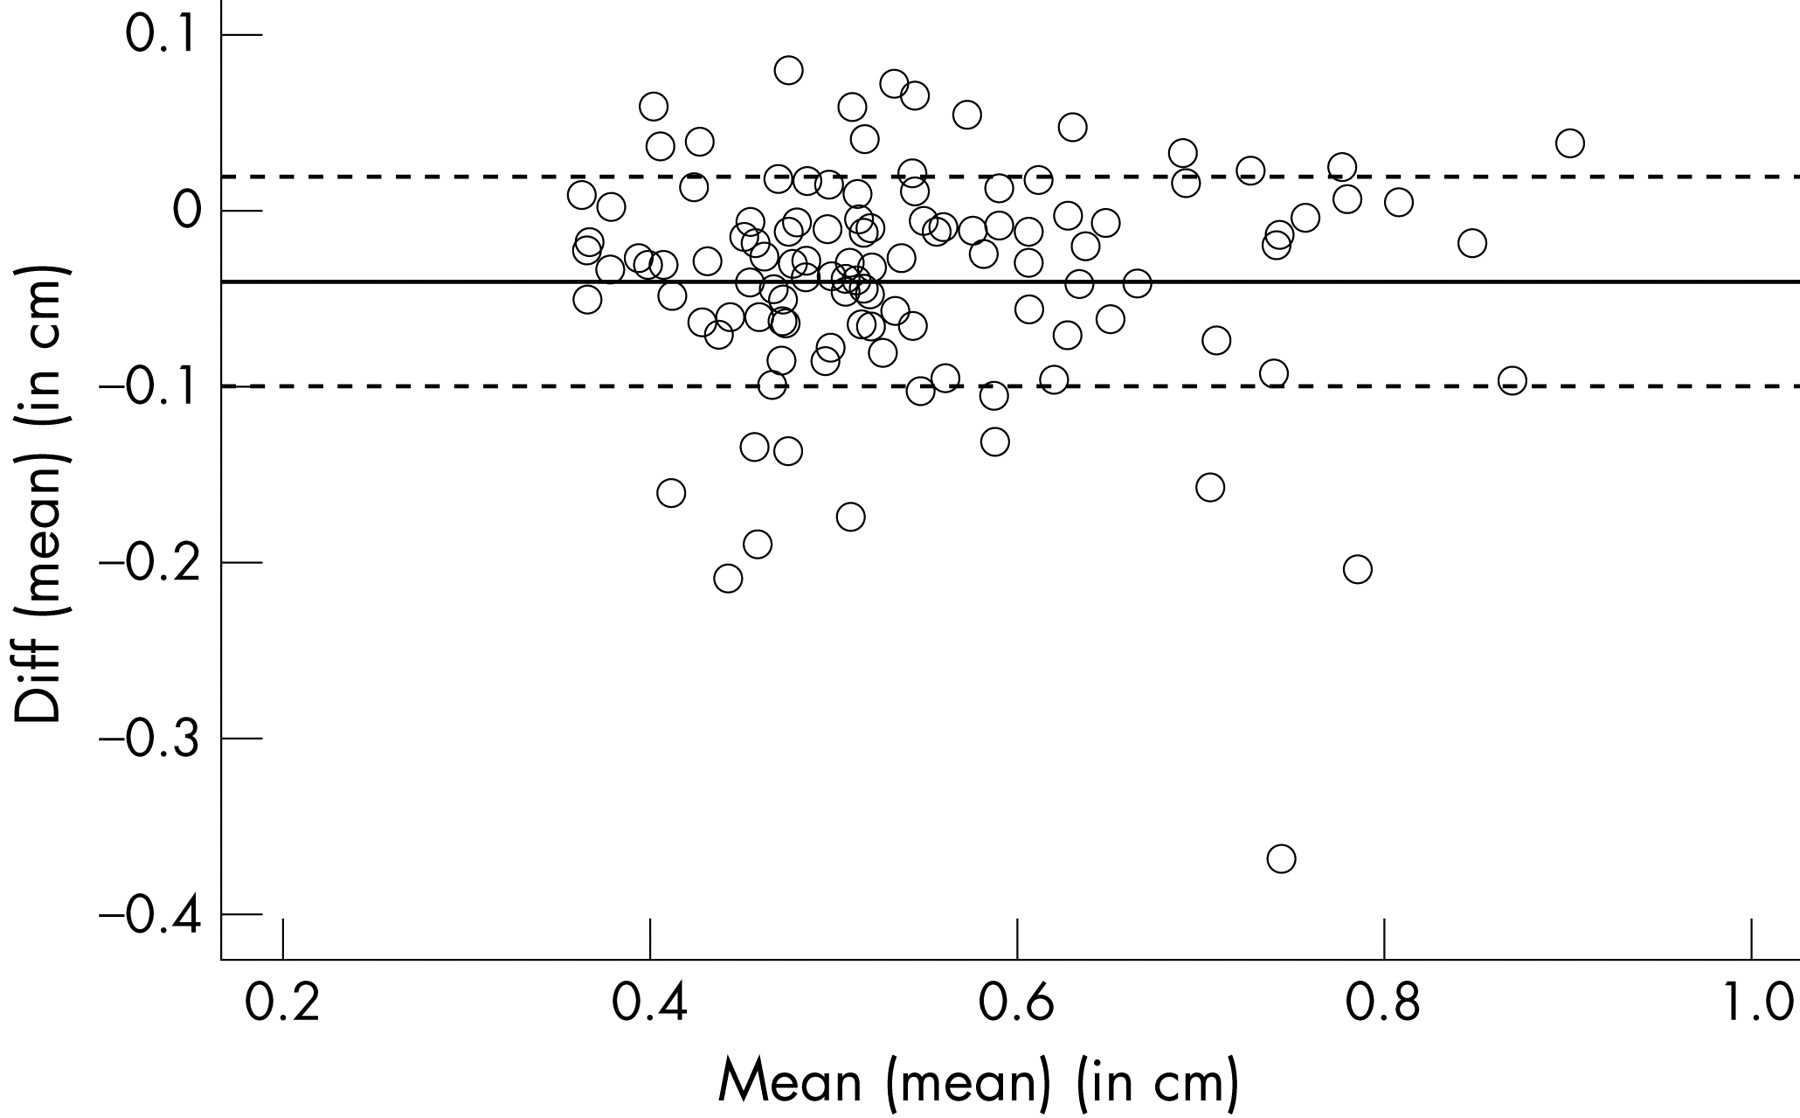
For statistical analysis the statistic program SPSS V. 14.0 was used. The arithmetic mean and the standard deviation SD of the methods and readers were used for descriptive statistics. A Bland and Altman (1986) analysis was performed to describe the mean of the mean differences (mean (d)) between the methods and the readers. Means of CS and MTS respectively were compared by the aid of a nonparametric Mann–Whitney U Test.
For all tests, a p value of <0.05 was considered to be significant and a p value of <0.01 highly significant.
RESULTS
The arithmetic mean and SD of the parameters are shown in table 1. The comparison between AI and MT5x revealed a small difference of 0.4 mm with systematically higher values for the manual tracing (tables 1 and 2).
The Bland and Altman analysis showed a significant correlation between the two methods (MT and AI procedure) (table 3, figs 3 and 4).


In the ultrasound analysis, MTS, compared to CS, had a significantly higher mean ATT and maximum ATT (table 4).
Reproducibility of data
For 18 subjects of the CS group the examination was performed twice by the same observer and in 12 subjects twice by two different observers. Automatic and manual detections were performed by two different readers for 70 images. Intra- and inter-observer error, intra- and inter-reader error were calculated according the formula S = SD. For the manual method, the intra-observer and inter-observer variability were 17.8% and 20.7%, respectively, for the mean ATT. For automatic detection, the intra-observer and inter-observer variability were 5.6% and 4.8%, respectively, for the mean ATT. This represents a reduction of 69% and 77%, respectively. The intra-reader and inter-reader variability were, respectively, 1.6% and 3.9% for the automatic detection and 3.0% and 6.8% for the manual method. The reduction was by 45% and 43%, respectively (tables 5 and 6).
DISCUSSION
The main findings of this study were: (1) the AI identification procedure can improve the measurement of ATT compared to MT procedures, (2) the AI identification procedure detects the maximal sagital diameter more reliably and robustly than the MT procedure, and (3) the MTS and CS groups showed significant differences in mean ATT and maximum ATT.
What is already known on this topic
For qualitative diagnostics of these acute and chronic disorders B-mode ultrasound has become the gold standard during the last few years.
B-mode ultrasound gives more spatial and contrast resolution for superficial tendon structures than MRI, and allows dynamic, real-time examination.
Ultrasound is cost-effective, less time-consuming during examinations, has wide accessibility and is non-invasive.
Achilles tendon thickness can be measured on ultrasound images and is an established parameter for quantifying the degeneration of the Achilles tendon.
Intra- and inter-observer errors due to lack of examiner experience are causing high variability in manual examination of ATT in ultrasound images.
What this study adds
This study establishes a new contour detection program based on the algorithm for intima–media thickness analysis for Achilles tendon ultrasound that allows the detection of the maximal and mean Achilles tendon thickness (ATT) in a more objective and reproducible way.
The automatic identification procedure (AI) can improve the measurement of the ATT compared to manual tracing (MT) procedures.
The AI detects the maximal sagital diameter more reliably and robustly than the MT procedure.
Subjects with manifest Achilles tendinosis and healthy subjects show significant differences concerning mean ATT and maximum ATT.
B-mode ultrasound of the Achilles tendon combined with the AI procedure represent a reproducible and quantitative diagnostic that could be used as a screening method or for follow-up studies to detect chronic disorders in the Achilles tendon.
Automatic detection methods as applied in ultrasound of the carotids could reduce variability and afford a better reproducibility of Achilles tendon ultrasound.
Punctual measurement vs AI identification procedure
Ultrasound of the Achilles tendon is considered as a more qualitative diagnostic tool, especially in relation to the echogenicity and the appearance of neighbouring structures.8 Defined reference values for the sagital diameter have been published in a few studies.9 11 18 19 These studies made use of accurate manual tracing procedures for the measurement of the ATT.9 10 18 20 21 The earlier studies have neither a systematic imaging protocol nor results concerning the inter- and intra-observer/reader variability.11 21 To ensure standard reference values, Schmidt et al detected the ATT in a defined location.19 O’Connor et al further defined a standardised imaging protocol.10 Despite the standardised conditions, inter-observer variability, which is said to be the main disadvantage of detection of ATT via ultrasound images, was up to 60%.3 10 In our study, even the computer-assisted segmental MT (which seems to be best suited for the most reproducible measurements of ATT) showed an inter-observer-/reader variability for the measurement of ATT in all three assessed segments with a range of 20.7% and 6.8%, whereas the AI process showed a inter-observer-/reader variability with a range of 4.8% and 3.87%. This represents a reduction of the variance by the new automatic method of nearly 50%.
The AI compared to the MT showed a systematically lower measurement of ATT in all three segments. An explanation might be that the threshold for visibility of the echo interface differs slightly between the human eye and algorithm. This difference between the two methods is systematic and thus will not have any influence on further studies if only one analysing system is used.12 14 15
Detection of the maximum sagital diameter
To show a manifest degeneration in a Achilles tendon, Astrom et al measured the maximum sagital diameter,9 defined by the observer. In several studies concerning Intima Media Thickness in ultrasound images of the carotids, it was demonstrated that the observer is not able to reproduce the absolute maximum within a curve that includes several local maxima.22 The AI is able to detect the absolute maximum of a processed curve of the tendon in a reproducible and robust way.
Quantification of manifest tendinosis
In most studies the US examination of the tendon is said to only be a qualitative diagnostic.4–7 The results of the Mann–Whitney U test have shown a highly significant difference between the MTS and CS group concerning the mean ATT and the maximum ATT. The analysis of the inter-/intra-reader variability and the inter-/intra-observer variability have demonstrated that these results are easily reproducible and robust. The AI is best suited for the second segment in which mean ATT and maximum ATT were correctly detected in 93.9% and 96.6% of the images (fig 4).
The starting and the ending point of the second segment (3 and 2 cm away from the calcaneus bone) were correctly detected in 92.6% and 94.7% of tests, respectively. As well as a clear imaging protocol, the examiner needs to produce images with a sharply bounded contour. This clear contour is most easily available from neutral position of the ankle.
The examination of the ATT has already been used in several studies to quantify the extent of degeneration in the Achilles tendon.4 23 In these studies, a decrease of thickness and a normalised structure are associated with a decrease of symptoms.
Practical impact
The aim of this study was to establish a standardised automatic procedure to differentiate between normal and chronically degenerated tendons. Currently, the measurement of the ATT is one established parameter in diagnostics of these disorders.9 10 20 21 Several studies concerning quantification of the intima–media thickness in US images showed that a punctiform measurement is less sensitive than measuring detecting thickness within a section.21 The present study demonstrates a method to detect the tendon boundaries by MT and AI. To receive a correct and reproducible result, the MT has to be repeated five times whereas the AI procedure turned out a reproducible result with the first detection. The automatic detection represents a less time consuming, reproducible and practical method to quantify the mATT and maxATT. The two populations compared in this study demonstrated that the AI procedure allows for the differentiation between normal and chronically degenerated tendons in a quantitative way. This quantification is important to provide evidence of progression or regression of the degeneration that is associated with increase or decrease of the ATT.4 23
B-mode ultrasound of the Achilles tendon, combined with the AI procedure, represents a reproducible and quantitative diagnostic that could be used as screening method or for follow-up studies to detect chronic disorders in the Achilles tendon.
Based on the AI procedure, we intend to develop new parameters concerning the texture of the chronically degenerated Achilles tendon with the help of a three-dimensional model (fig 5).

Such parameters might be able to differentiate tendinosis from other disorders of the Achilles tendon. Further prospective studies have to be undertaken, but based on our current data we suggest the new method could be a new gold standard for the prediction of tendinosis of the Achilles tendon.
In conclusion, the AI program presented provides time-saving, accurate measurements of the ATT compared to computer-assisted MT for all three processed segments, minimising the reader-associated variability of MT. The AI process represents a clear improvement over the manual tracing procedures and the manual punctual measurements. The AI allows a more objective diagnostic of tendinosis associated with a significant increase of tendon thickness.
REFERENCES
Footnotes
- Abbreviations:
- AI
- automatic identification
- AT
- Achilles tendon
- ATT
- Achilles tendon thickness
- MT
- manual tracing
- US
- ultrasound