Article Text

Abstract
Objectives To identify the relationship between field performance in a hot environment and individual heat acclimatisation responses in football players.
Methods Nineteen semiprofessional football players completed a match in 21°C followed by 6 days of acclimatisation in dry heat (38–43°C, 12–30% relative humidity) and a match in ∼43°C. A heat-response test (30 min walk+30 min seated; 44°C) was performed at the beginning and end of the acclimatisation period.
Results The acclimatisation period increased sweat rate by 34% during a standard heat-exposure test and reduced sweat sodium concentration by 18% (both p≤0.005). Plasma volume changes showed large interindividual differences (−10 to +20%). Match-running performance was impaired in hot ambient condition and demonstrated marked interindividual differences (total distance −6.0±5.8%, high-intensity running −16.4±21.5%, both p≤0.002). Only haematological markers investigated during the heat-response test correlated with the ability of the player to cope with heat stress in a competitive situation; that is, changes in haematocrit between the heat-response tests were correlated to changes in total running during the game, r=−0.75; 90%CI [−0.88 to −0.51].
Conclusions Heat acclimatisation responses and in turn, match-running performance in the heat, are highly individual. The players displaying the largest haematological adaptations were able to maintain the same activity when playing in the heat as when playing in temperate conditions. As such, team doctors might use acclimatisation indicators obtained from a heat-response test to predict the ability of individual players to cope with heat in competitive situations and individualise their preparation accordingly.
Statistics from Altmetric.com
Introduction
Several international sport events take place in the summer months and often in countries with hot environmental temperatures. Elite football players participating in events such as the FIFA World Cup in Qatar will be partly acclimatised as a result of physical training in temperate environmental conditions.1–3 However, these adaptations are different,4 or incomplete,3 and do not replace acclimatisation per se.5 Even if heat acclimatisation increases work capacity in both temperate6 ,7 and hot7–10 ambient conditions, endurance performance and its associated physiological responses remain impaired in the heat compared with temperate conditions.11
Acclimatisation is dependent on the heat exposure characteristics. Natural acclimatisation is more complex than artificial acclimation using a laboratory protocol,12 as it includes factors such as learning pacing strategies. Physiological responses to heat acclimatisation also show some interindividual variability. For example, the commonly observed lowering in core temperature has been reported to occur in some, but not all individuals following an acclimatisation protocol.13–15 Therefore, identifying the specific acclimatisation responses of athletes is an important factor to optimise performance in a hot environment. In addition, whereas most of the literature has described the responses of groups of soldier, worker or voluntary participants in laboratory situations, data on competitive athlete in real training conditions are needed.16
Therefore, a protocol was designed to characterise the individual acclimatisation responses of North European football players who participated in 1-week17 acclimatisation camp in Qatar. The aim of the study was to identify the relationship between field-running performance in a hot environment and individual heat acclimatisation responses to a standardised heat-response test in football players. Given that evidence form the laboratory suggest that heat acclimatisation facilitates performance,7–10 we hypothesised that individual physiological/adaptation responses would be associated with different game performance responses when playing in a hot environment.
Methods
Participants
Nineteen semiprofessional Scandinavian football players participated in this study. Their mean±SD age, height and body mass were 27±5 year, 184±6 cm and 80.1±7.1 kg, respectively. Participants were all outfield players and usually trained 5–6 times a week plus one or two competitive games per week. Participants provided their informed consent prior to enrolling in the study, which conformed to the recommendations of the Declaration of Helsinki.
General procedure
Players were from Denmark and Faroe Islands (local temperature ∼5–15°C at the time of the experiment) and participated to an in-season acclimatisation camp in Qatar in October 2010. The training period lasted for 11 days and replicated their usual training/game cycle (figure 1). During the three first days, all the training, including a control match, were performed indoors in temperate conditions (20–21°C, wet-bulb globe temperature (WBGT) ∼18.8°C). From the 4th day, the training and a match with identical set-up as the indoor match, were performed outdoors in hot and dry conditions (38–43°C, 12–30% relative humidity (RH), WBGT ∼34.7°C). On days 4 and 10 of the training camp all players participated in a heat-response test.

Schematic overview of the training camp. The camp lasted for 11 days and replicated the usual training/game cycle of the players. Days 1–3 (white boxes) were in temperate conditions (20–21°C). Days 4–10 (grey boxes) were in hot conditions (38–43°C). Game represents a regular football game (preceded by the same type of training focusing on skills and tactic); Rec., represents the recovery session; Train., represents the regular football training session; and Test represents the heat-response test.
Heat-response test (laboratory)
All tests were performed in the afternoon, at the same time-of-day.18 Participants rested for 30 min before the test (laboratory temperature ∼21°C) during which time they were instrumented. Thereafter, participants entered the climatic chamber (44°C, 44% RH; Tescor, Warminster, Pennsylvania, USA) to perform 30 min of walking at 5 km/h (1.39 m/s, 1% grade) on a treadmill (Cosmed T170, Rome, Italy), followed by 30 min of seated rest. No fluids were consumed during the test. Urine specific gravity (USG) was analysed at the end of the test (URC-NE, Atago, Tokyo, Japan).
Rectal temperature was continuously recorded during exercise and recovery via a telemetric sensor (precision 0.01°C, VitalSense, Mini Mitter, Respironics, Herrsching, Germany) inserted the length of a gloved index finger beyond the anal sphincter.19 Heart rate (HR) was also continuously recorded (Polar Team System 2, Polar Electro, Kempele, Finland). Sweat loss was calculated as the difference in pre and post body mass (weighed in underwear, body dried; Seca, Germany).
Sweat samples were collected for the duration of the test via an absorbent pad with protective dressing (Tegaderm+Pad, 3M Health Care, Borken, Germany) positioned on the back of the participant (at the level of the right shoulder) after cleaning the skin with deionised water. Samples were analysed for sodium concentration ([Na+]sweat) (Dimension Xpand Plus, Siemens, Munich, Germany).
End-of-test blood samples were collected at the 55th minute of the acclimatisation test, before leaving the climatic chamber. Resting blood samples were collected in the morning (09:00–10:00 am), before any exercise or heat exposure. The blood was collected in K2EDTA Vacutainers (Becton Dickinson, Franklin Lakes, NJ, USA) after 25 min of rest in a seated position. The analysis for the complete blood count, including erythrocytes (red blood cells, RBC), haemoglobin (Hb) and haematocrit (Hct), was conducted within 1 h on a Sysmex XT 2000i haematology analyser (Sysmex, Norderstedt, Germany). The analytical variation, expressed as percentage of coefficient of variation (CV%) was 0.3% for Hb, 0.4% for Hct and 0.4% for the RBCs. The day-to-day variation in healthy athletes was 2.2% for Hb, 2.0% for Hct and 2.4% for the RBCs. In addition, estimated plasma volume (PV) changes are indicated using the formulas previously described by Van Beaumont20 and Dill and Costill.21
Acclimatisation procedure (outdoor)
The organisation of the camp is presented in figure 1. During the first 3 days of the camp, players trained and played indoors (controlled environmental conditions between 20 and 21°C, WBGT ∼18.8°C) on a synthetic turf (Classic Series, G3, Mondo, Italia). Then, they trained and played outside on a synthetic turf (Classic series, G1, Mondo, Italia) from the 4th to the 10th day. The diurnal environmental conditions during this experimental acclimatisation phase ranged from 38 to 43°C for temperature, 12–30% for relative humidity and 32–37°C for WBGT. From dinner to breakfast, players rested and slept in a controlled environment between 20 and 21°C.
Before and during the experimental acclimatisation phase, players maintained their usual training cycle consistent with that used over the preceding 3–4 months (ie, two light training sessions to recover from the previous game followed by training focusing on skills and then on tactics for the next game). In addition, training loads were estimated via calculation of training impulses (TRIMP) using training time and associated HR.22 They were the same during the experimental phase than during the control phase in temperate condition (ie, ∼50 TRIMPs for recovery training, ∼100–150 TRIMPs for regular training, ∼250 TRIMPs for game).6 The experimental acclimatisation phase included a full 7-day cycle with a game on the 6th day. Players trained once a day, from 10:30 to 12:30. Players could drink ad libitum and were provided with a post-training nutrition plan developed by a nutritionist to ensure adequate fluid and nutrient intake between the sessions (∼15% proteins, ∼25% fat and ∼60% carbohydrates).
Match-running performance
As a part of their training/game cycle, players participated in two experimental friendly football games (11 vs 11, FIFA rules), one before the heat acclimatisation procedure (temperate environment; ∼21°C, 55% RH; WBGT 18.8°C; Aspire Dome, Doha, Qatar) and one on the 6th day of heat exposure (hot environment; ∼43°C, 12% RH; WBGT 34.9°C; Aspire Field, Doha, Qatar). The two games were played on similar pitches (70×100 m), controlled by the same match officials and with the same coaching, pregame and half-time procedures. The details of the games, the methodology employed to track performance and the results have been presented elsewhere.23 Briefly, the total distance covered and the amount of high-intensity running (>14 km/h) was determined during each game for each player by a multiple-camera semiautomatic passive tracking system (Amisco Pro, V. 1.0.2, Nice, France).24 ,25
Statistical analyses
Data were coded and analysed in PASW software V.18.0 (SPSS, Chicago, Illinois, US). One-way repeated-measure (ie, within subjects) analysis of variance (ANOVA) was performed to examine the effect of the acclimatisation procedure. Blood parameters obtained both before and after the heat-response test were analysed via a two-way repeated-measure ANOVA (time of sampling×preacclimatisation versus postacclimatisation). The variables continuously recorded (eg, body temperatures and HR) were also analysed via a two-way repeated-measure ANOVA (time of recording×preacclimatisation versus postacclimatisation). ANOVA assumptions were verified preceding all statistical analyses. Outcome variables were assessed for normality by inspecting histograms and homogeneity of variance was assessed using the F-Max test. Whenever outcome variables displayed departure from normality, logarithmic transformations were applied to moderately skewed data and inverse transformations for highly skewed data. In addition, all variables were tested using Mauchly's procedure for sphericity. Whenever the data violated the assumption of sphericity, a p-value based on Greenhouse-Geisser correction was reported instead. The level of statistical significance was set at p<0.05. Effect-sizes are described in terms of Partial η2 (with η2≥0.06 representing a moderate difference and η2≥0.14 a large difference). Data are presented as mean±SD along with the mean differences (95% CI). In addition, Pearson's product–moment correlation analysis was also used to assess the relationship between the modifications observed during the game (in %) and the amplitudes of variation recorded during laboratory testing (in %). The magnitude of correlation (r (90% CI)) between test measures were assessed with the following thresholds: <0.3, trivial to small; 0.3–0.5, moderate; 0.5–0.7, large; 0.7–0.9, very large and 0.9–1.0, almost perfect. In addition, the relationships were described as significant if the p-value of the linear regression was <0.05.
Results
Clinical parameters
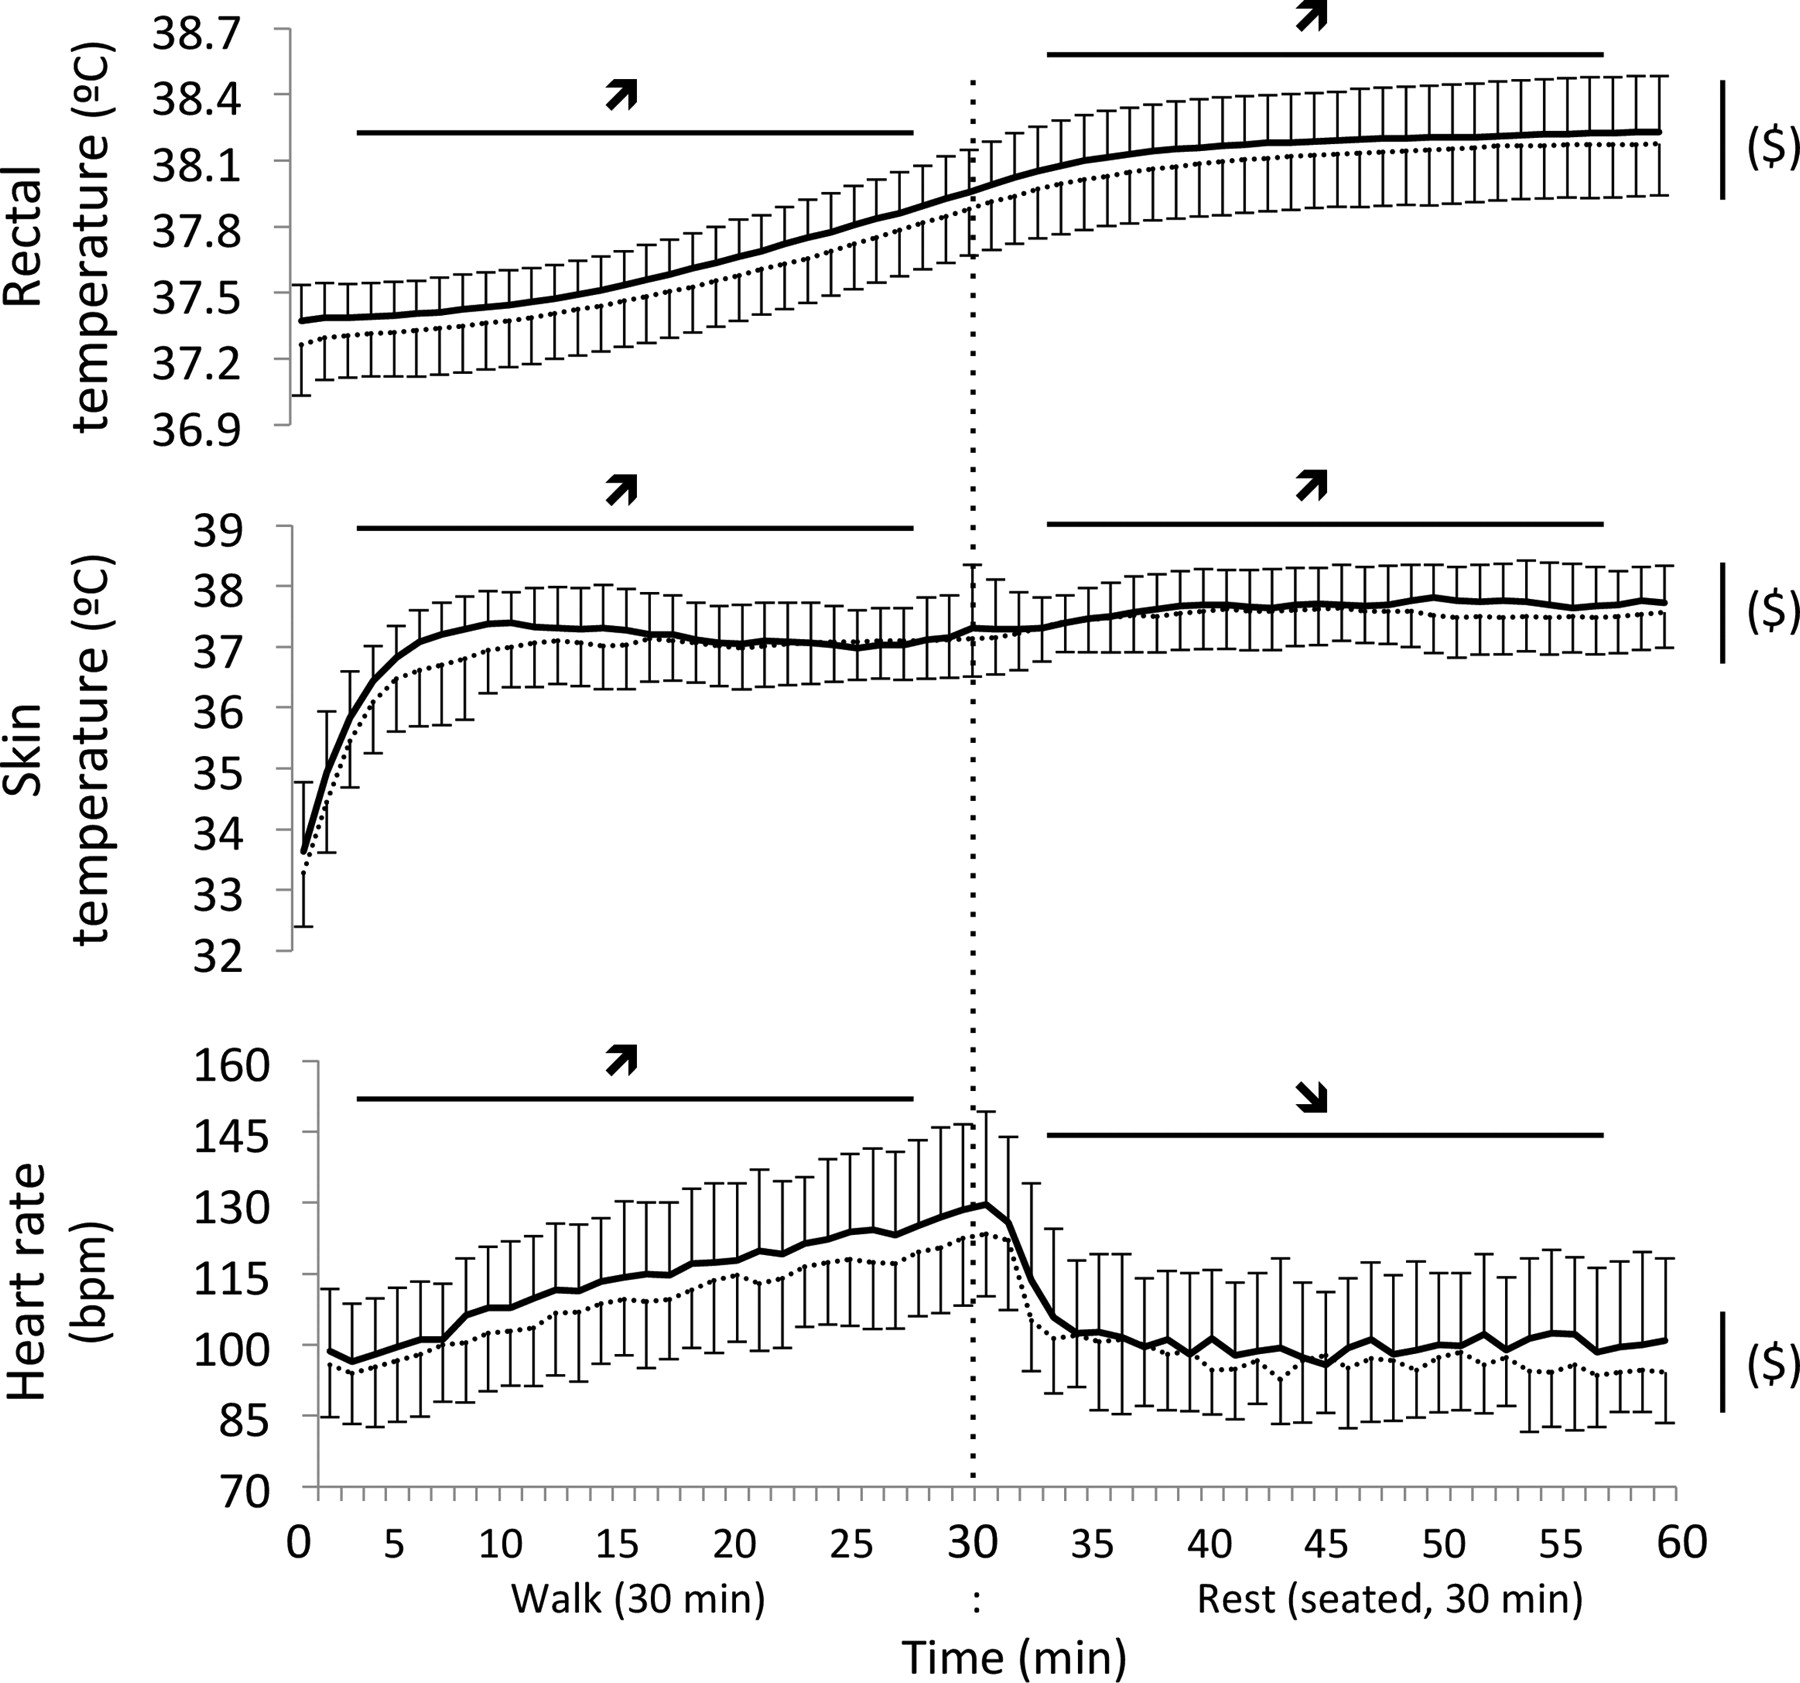
Rectal temperature (figure 2) throughout the heat-response test was moderately (η2=0.11), but not significantly (p=0.17), lower following acclimatisation (mean difference: −0.07(−0.18; 0.03)°C). Rectal temperature increased significantly during both the walk and rest segments of the heat-response test (p<0.001, η2≥0.74), independently of acclimatisation (p=1.0, η2=0.02). As with rectal temperature, skin temperature was moderately (η2=0.11), but not significantly (p=0.17), lower following acclimatisation (mean difference: −0.16(−0.40; 0.08)°C). Skin temperature increased significantly during both segments of the heat-response test (p<0.001, η2≥0.24), independent of acclimatisation (p=0.82, η2=0.05). HR (figure 2) was also largely (η2=0.14), but not significantly (p=0.18), lower following acclimatisation (mean difference: −4.2(−10.6; 2.1)bpm). HR increased significantly during the walk (p<0.001, η2=0.87) and then decreased during the rest (p<0.001, η2=0.60) of the heat-response test, independently of acclimatisation (p=0.13, η2=0.09).

Temperature and heart rate responses to the heat-response test before (plain line) and after (dashed line) the 7-day acclimatisation period. ↗↘ represent an increase or a decrease during the test (p<0.001, η2≥0.77), $ represents a moderate (η2 = 0.11), but not significant (p=0.17) lowering in rectal and skin temperature as well as in heart rate (η2 = 0.14, p=0.18) following the acclimatisation week. Value in mean±SD.
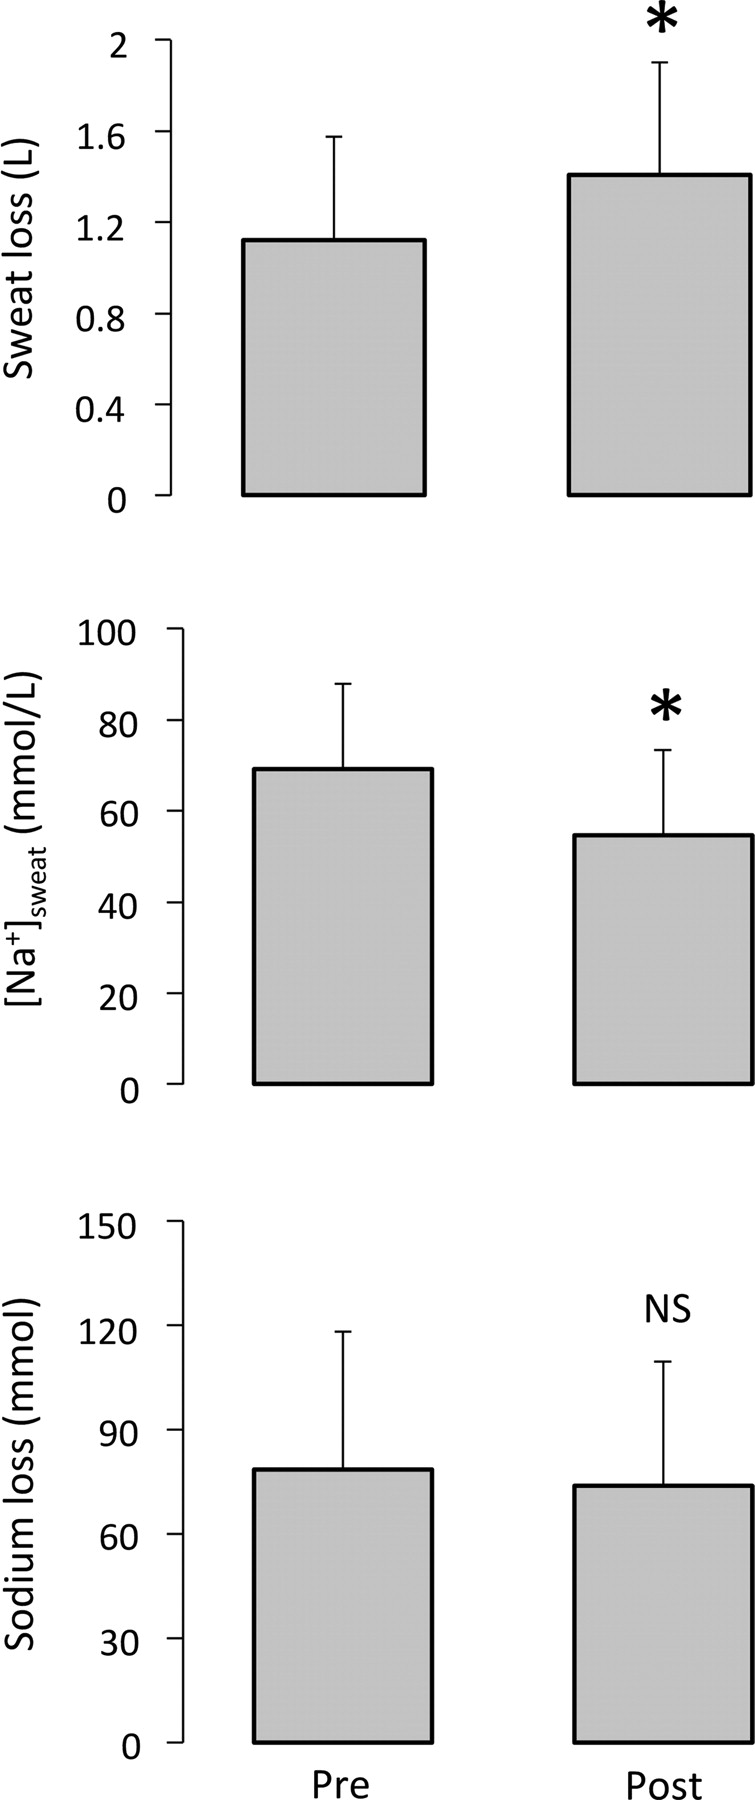
Total sweat loss (figure 3) during the heat-response test was significantly higher (p=0.005, η2=0.38) after acclimatisation (mean difference: 0.3(0.1;0.5)litre). Conversely, [Na+]sweat decreased (p<0.001, η2=0.60) following acclimatisation (mean difference: 13.0(7.3;18.7)mmol/l). The sodium loss (ie, sweat loss × [Na+]sweat) was similar during the tests performed before and after acclimatisation (p=0.75, η2=0.01; mean difference: −2.0(−15.3;11.2)mmol). The USG was also similar at the end of the heat-response test performed before and after acclimatisation (1.020±0.010 vs 1.019±0.010 g/ml, p=0.50).

Sweat responses to the heat-response test before (pre) and after (post) the 7-day acclimatisation period. * represent an increase in sweat loss (p=0.005, η2 = 0.38) and a decrease in sodium concentration (p<0.001, η2 = 0.60). The sodium loss was not significantly different (non-significant, NS; p=0.75; η2 = 0.01). Value in mean±SD.
Haematological adaptations
Data showed that all blood count variables (RBC, Hb and Hct; figure 4) were not significantly affected by the test (all p≥0.85, η2=0.00), but decreased after acclimatisation (all p<0.02, η2≥0.31), independent of sampling time (ie, morning or after the heat-response test) (all p≥0.20, η2≤0.10).
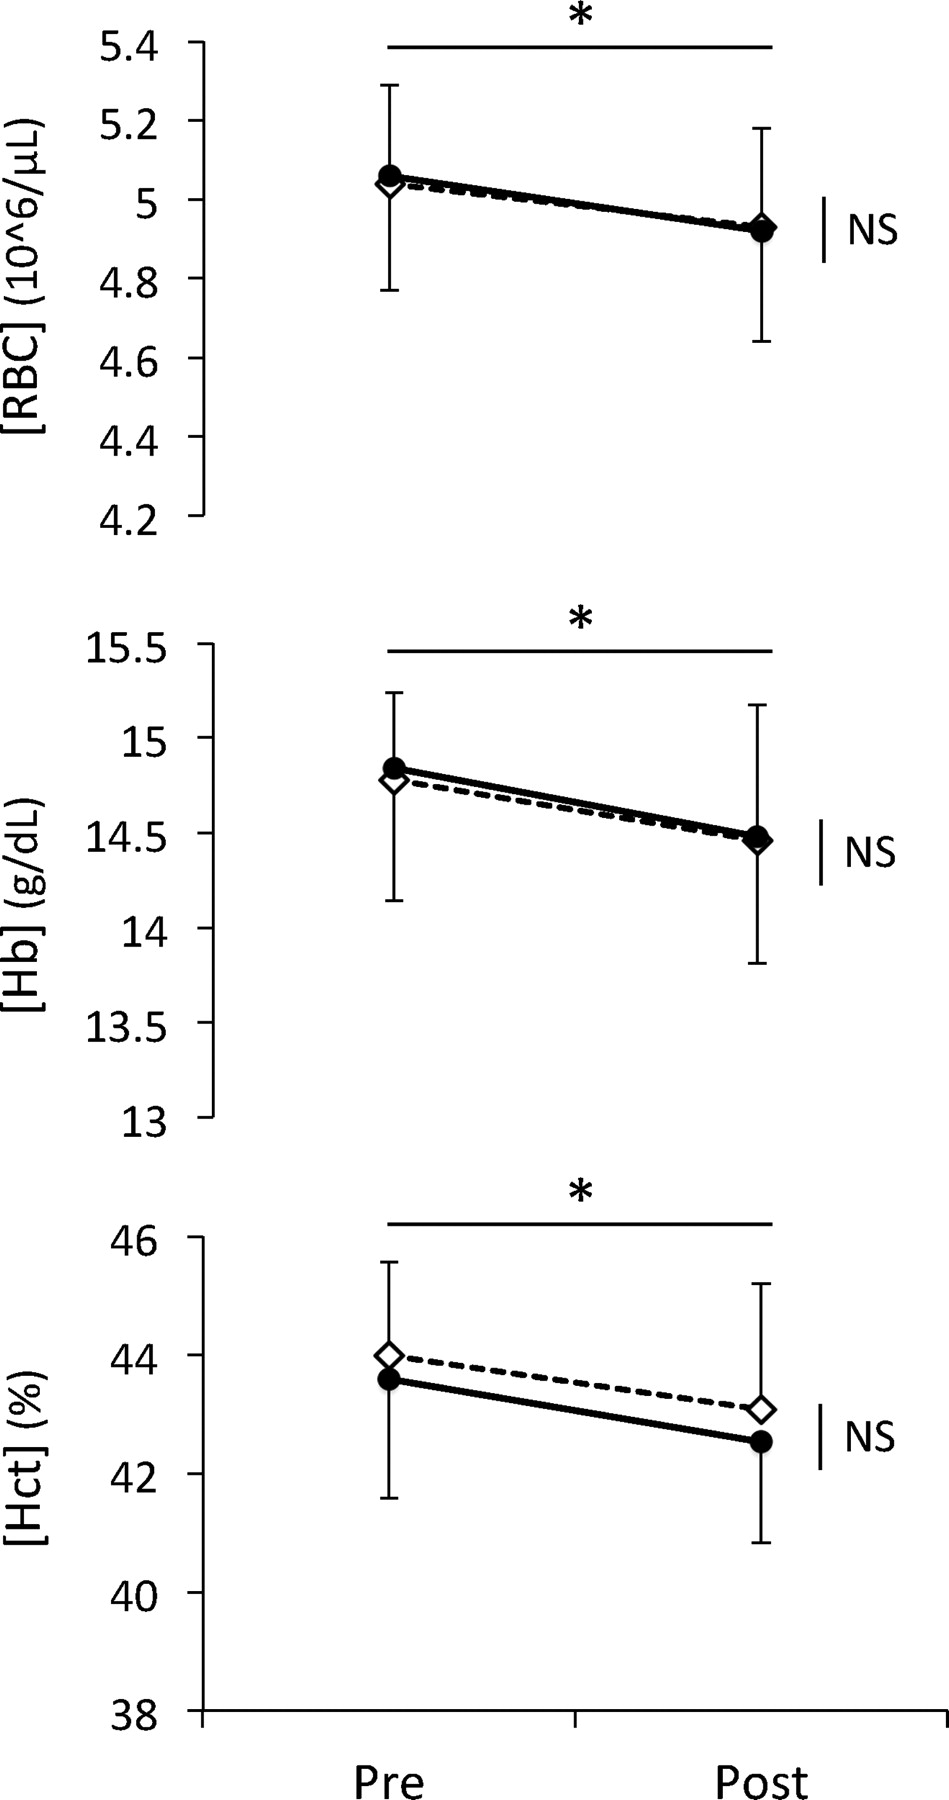
Haematological responses to the heat-response test before (pre) and after (post) the 7-day acclimatisation period. * represents a decrease (p<0.02, η2≥0.31) after acclimatisation. Average values were not significantly different between the samples drawn in the morning (dashed lines with open diamonds), or at the end of the heat-response test (plain lines with black discs) (non-significant, NS; all p≥0.85; η2=0.00). Value in mean±SD.
These changes corresponded to a mean plasma volume increase of ∼4%. There were no differences between the average PV increase calculated from the morning and heat-response test samples (4.0±6.5% vs 4.3±7.9% using;20 4.2±7.3% vs 3.6±6.3% using;21 both p>0.76). However, there was no clear correlation between PV changes measured in the morning and after the heat-response test (r=0.25(−0.17;0.59) using;20 r=0.31(−0.11;0.63) using21). In addition, the SD of the differences between the heat-response test and the morning samples was large (0.26±8.89% using;20 0.57±8.05% using21), showing a large interindividual variation.
Performance changes in the heat and associations with acclimatisation responses
The total distance covered was 6.0 (±5.8)% lower during the game performed in the hot environment (9593±724 m) compared with the game performed in temperate conditions (10226±743 m) (p=0.001, η2=0.53, mean difference: −633(−950;−316)m; figure 5). This decrement was significant (p<0.05, η2 > 0.31) during both the first (−6.7±5.5%) and second (−5.2±8.1%) halves of the game. A 16.4 (±21.5)% decrement was observed in total high-intensity running (p=0.002, η2=0.45, mean difference: −429(−681;−177) m).

Correlation between changes in match-running performance (ie, total disctance covered) while playing in the heat and acclimatisation responses (% change of haematocrit). Note that the players displaying the largest acclimatisation response (ie, the largest haematocrit decrememt) maintained the same level of activity during the game in the heat, compared with the game in temperate conditions. The players who failed to acclimatise (ie, no changes in haematocrit) presented a larger total distance decrement than the average of the team. One individual player displayed a marked haemoconcentration that was associated with the largest performance decrement.
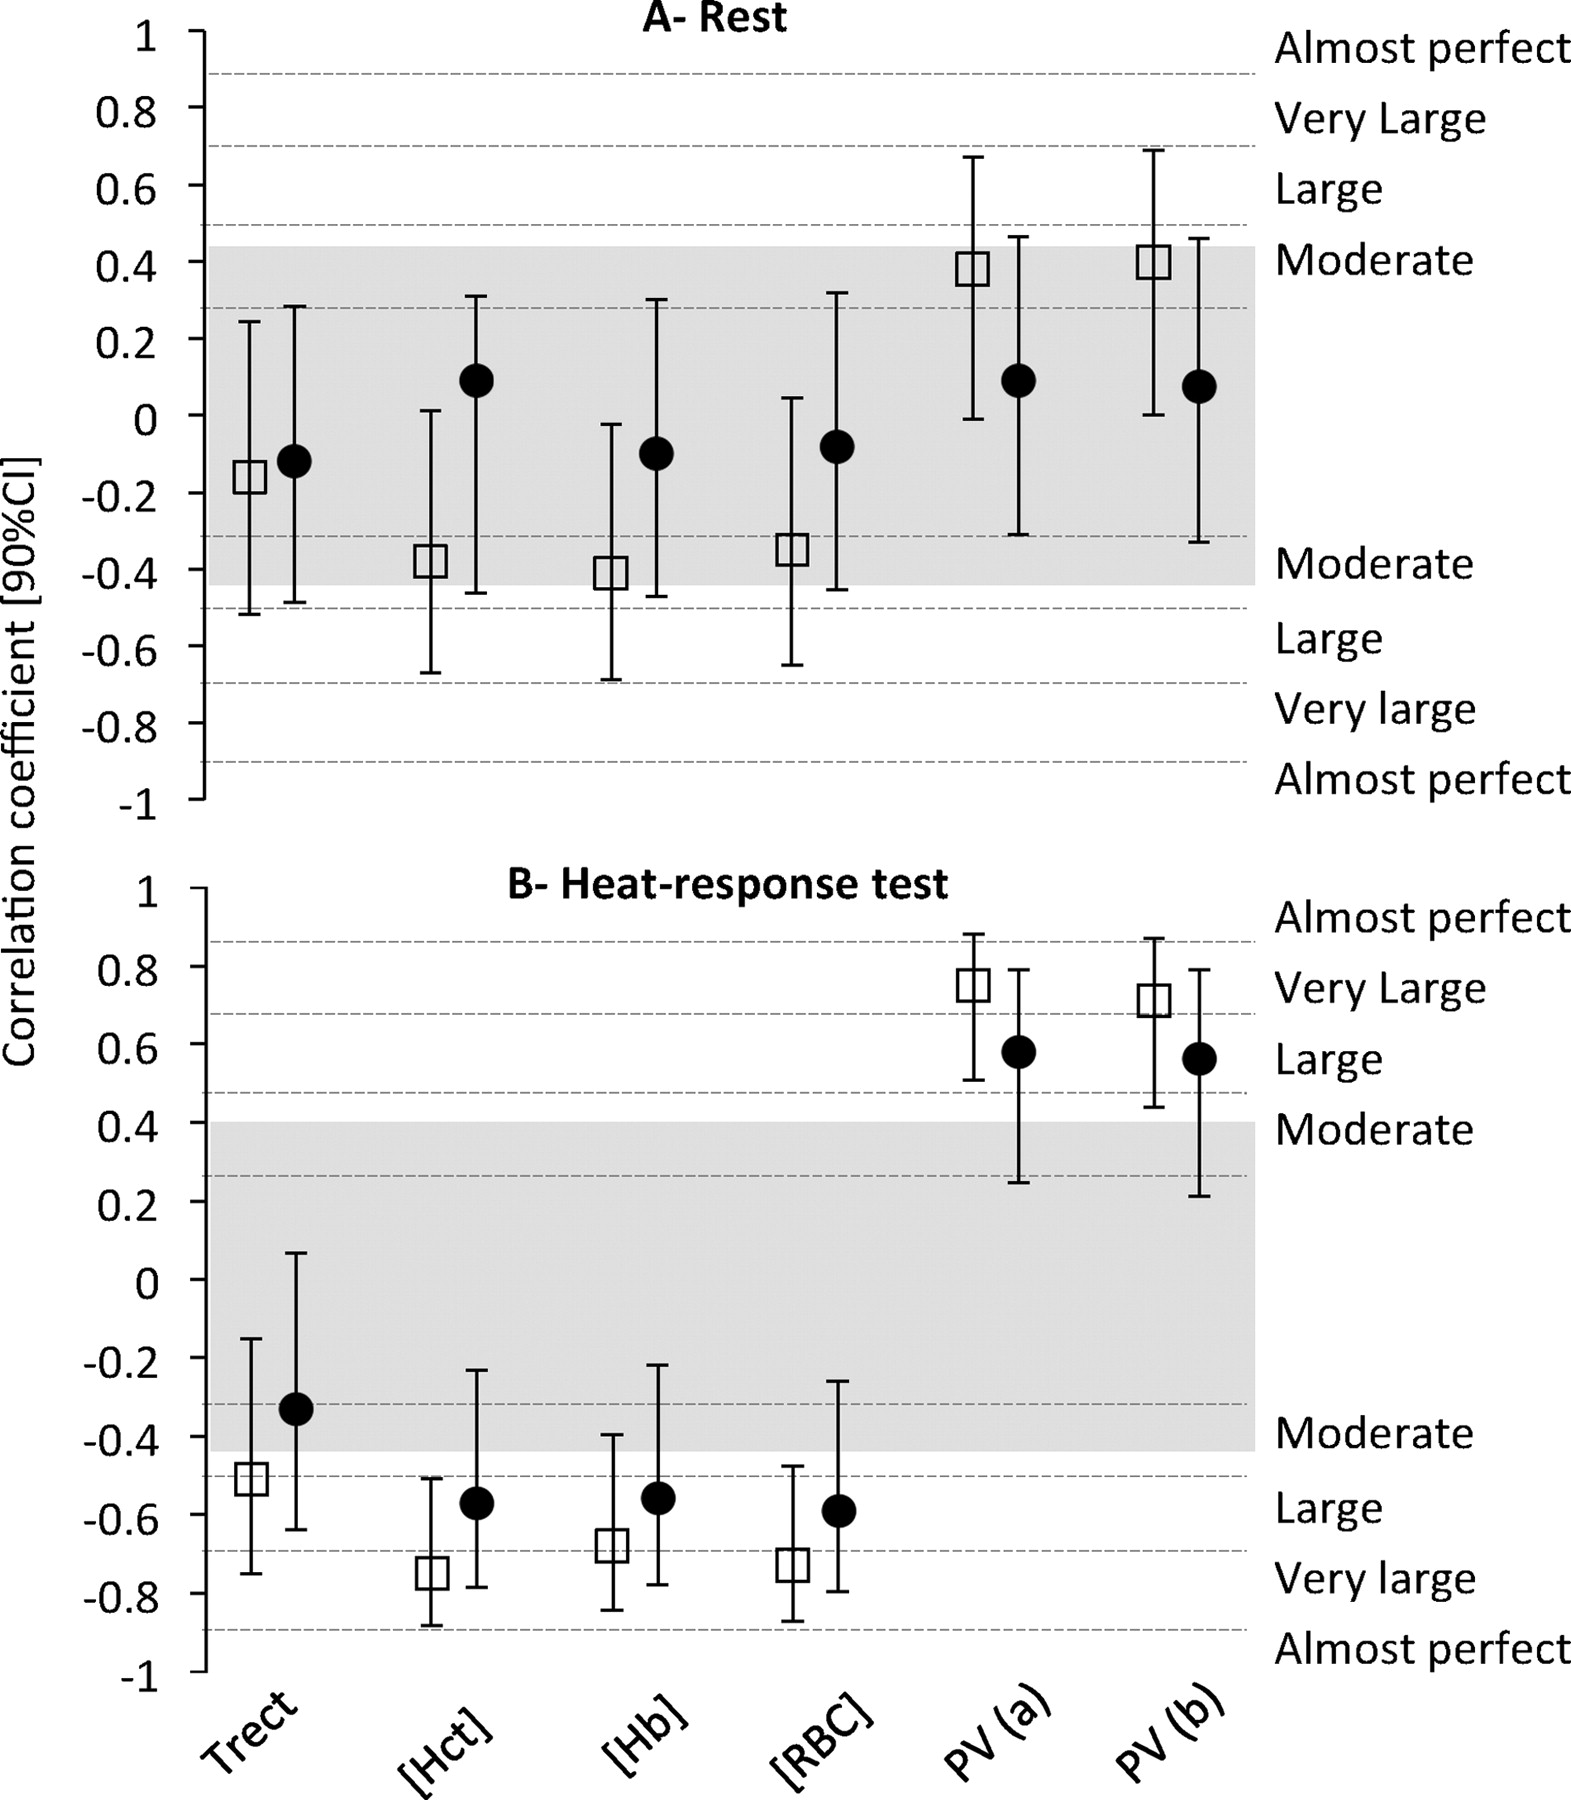
The decrements in match-running performance under hot environmental conditions were not correlated to the acclimatisation adaptations observed at rest (linear correlation: r ≤ 0.41, all regressions non-significant; figure 6). However, the decrements in match-running performance were correlated to the haematological changes observed during the heat-response test (r ≥ 0.51, p<0.05; figures 5 and 6).
Relations between running activity during a football game in a hot environment (distanced covered: open square, high intensity running: black dot) and acclimatisation responses recorded at rest (top graph) and during a heat-response test (bottom graph). Values represent the correlation coefficient (r) (90%CI) between the relative changes (%) in running activity from a control game in temperate conditions to a game in a hot environment, and the relative change (%) in the different physiological measures recorded at rest (ie, in the morning) and during the heat-response test following 1 week of acclimatisation. PV (a) and PV (b) represents the changes in plasma volume estimated from Van Beaumont20 and Dill and Costill21 equation, respectively. The grey area represents the range of values for which the regression analyses were not significant (p>0.05).
Neither the adaptation to acclimatisation (r≤0.46; regressions non-significant) nor the changes in match-running performance (r ≤ 0.34, regressions non-significant) were correlated to the body mass, body mass index, age or physical fitness (estimated from a YOYO test, see 23 for details) of the players.
Discussion
One week of ‘normal’ football training in a hot and dry environment induced heat acclimatisation (eg, sweat rate +34%, sweat sodium concentration −18%) with large individual variations (eg, PV −10 to +20%). The ability to cope with heat stress (as indicated by the change in match-running performance when playing in a hot environment) correlated with individual haematological adaptations (figure 5). However, only markers investigated during a heat-response test were predictive of the players’ ability to play in the heat (figure 6).
Acclimatisation in elite football players
Heat acclimatisation can be referred to as a general adaptation process allowing to better cope with heat stress. It includes an increase in sweat rate,8 ,9 ,11 ,26 ,27 as well as decreases in sweat concentration in sodium,8 core temperature8 ,10 ,11 ,26–29 and HR.11 ,26–28 The change in sweat rate appears to be more marked than the changes in temperature and HR,27 with some previous studies failing to observed any change in temperature30 or HR.29 The current data showed that significant changes in sweat sodium concentration and sweat rate can be observed in football players after no more than a week of training in the heat (figure 3), with moderate to large (η2>0.11), but not significant, decrements in HR and rectal and skin temperatures (figure 2). In accordance with a recent 5-day of controlled laboratory acclimation protocol utilising hyperthermia and dehydration in highly trained athletes,31 the current data showed that heat acclimatisation during training is a simple natural method to induce adaptations in semiprofessional players.
Match-running performance
Despite this partial heat acclimatisation, match-running performance was impaired in hot ambient conditions. There were vast individual variations in match-running performance as demonstrated by the large SD for changes in total distance −6.0 (±5.8)% and high-intensity running −16.4 (±21.5)%. The details of the games have been analysed and presented elsewhere.23 Briefly, it has been reported that neither delta changes, nor absolute measures of core or muscle temperature, end of the game blood lactate or HR can predict the heat-induced decline in work capacity.23 Conversely, the current data showed a correlation between the haematological adaptations during the heat-response test following acclimatisation and the changes in running performance during the game (figures 5 and 6). This suggests that heat acclimatisation is a major factor in determining the ability of a player to cope with heat stress and his relative physical performance when competing in hot ambient conditions.
Utilisation of a heat-tolerance test
The changes in sweat rate and sweat sodium concentration were not correlated with the changes in running performance during a football game. Conversely, the changes in haematological responses were predictive of the decrement/preservation of match-running performance. The changes in Hct measured at the end of the heat-response test appeared to be an individual indicator of the acclimatisation level and, in turn, of the ability to physically perform in the heat (figure 5). However, our data showed that the same markers investigated at rest and during a heat-response test might have a different meaning. Indeed, the different haematological adaptations observed at rest in the morning (before any activities) did not correlate with the changes observed during the heat-response test, or during the game (figure 6). This confirms that a test in a temperate environment cannot be used as a substitute to a test in hot ambient temperatures.32 Conversely, the haematological adaptations observed during the heat-response test of the current experiment were largely correlated to changes in the activity pattern during the game (figures 5 and 6). This suggests that team doctors could record changes in haematocrit concentration after a heat-response test to determine the short-term acclimatisation response of players and their ability to cope with the heat. Additionally, the 60-min heat-response test used in the current study appears to be applicable in the professional setting where time is generally limited.
Individual responses
Most of the literature on heat acclimatisation reports average data obtained from the testing of military personnel or other small groups of volunteers. By following semiprofessional football players during an in-season heat-acclimatisation camp, the current study provides an insight into the individual adaptations of competitive players. Our data showed large interindividual differences in acclimatisation and ability to play in the heat within a homogenous group of similar training background and ethnicity (ie, Scandinavian). On the basis of these data, we were able to identify responders and non-responders to the week of acclimatisation. This can have direct implication for practitioners when programming training/competitive camps in hot environments. The ‘non-responders’ in the current study could just be ‘slow-responders’ as most of them were in the range of ±2.5% of variation in Hct (figure 5). However, the player who displayed the biggest decrement in total distance covered (ie, −15.6%) was also the player showing an adverse reaction to the acclimatisation camp with a marked haemoconcentration. Whereas a single exercise bout in the heat can induce hemoconcentration,33 repeated heat-exposures leading to heat-acclimatisation should induce hemodilution.9 ,30 ,33 Therefore, this player might have required additional days or weeks to acclimatise optimally. Interestingly, this player was not dehydrated (urine specific gravity of 1.010 and 1.016 g/ml at the end of the heat-response test, before and after acclimatisation respectively; no value available throughout the camp) and we were unable to identify other possible mechanisms predicting his particular response. Indeed, the anthropometric characteristics and the physical fitness of the players did not correlate with their acclimatisation responses. In addition, the players failing to acclimatise (ie, displaying an increase in Hct, instead of a decrease) played in all positions (ie, defenders, midfielders and strikers). As such, present data suggest that team doctors and coaches preparing for international events in hot ambient conditions should consider organising acclimatisation camps with heat-response tests to determine how long each player may need to acclimatise, and which player might not be able to acclimatise.
Limitation and perspectives
Our data suggest that Hct changes (an indicator of PV expansion) might represent a good indicator of acclimatisation and, therefore, of the ability to cope with the heat during a game for player coming from a temperate/cool country. However, a correlation does not represent a causal link. Whereas the Hct change represents a valuable indicator, it is probably not the physiological mechanism improving exercise capacity in the heat given that an artificial increase in PV does not appear to improve thermoregulatory function.34 ,35 In addition, PV can be affected by recent activity and hydration, suggesting that non-responders should be closely followed to optimise fluid intake.
Whether a given player remains a ‘responder’ or ‘non-responder’ over consecutive and repeated heat exposures at different times of the year/career should also be examined to distinguish between a player's intrinsic responsiveness to heat acclimatisation and the variability in responses to the test itself. Lastly, it is recommended to investigate acclimatisation possibilities over longer periods, as well as the potential to transfer various levels of acclimatisation between different ranges of temperature and humidity. Such investigations should be carried on with specific populations such as elite athletes.16
Conclusion
Our data showed that 1 week of football training in hot ambient conditions induces heat acclimatisation in semiprofessional football players, but with very large interindividual differences in the amplitude of response. A simple heat-response test can help in determining the acclimatisation response of the players and their ability to maintain their match-running performance in a competitive situation in the heat.
What is known on this subject
-
Heat-acclimatisation can improve physical performance in both temperate and hot environments.
-
Mean group data have been reported from soldiers, workers or other groups of volunteers showing partial heat-acclimatisation after ∼1 week.
What this study adds
-
Outdoor football training in hot ambient conditions induces heat acclimatisation in semiprofessional football players.
-
Heat acclimatisation responses and subsequent match-running performance in the heat are however highly individual.
-
Team doctors might use a heat-response test prior to and following acclimatisation to predict the ability of players to cope with heat in competitive situations and individualise their preparation accordingly.
Acknowledgments
The authors thank the players for their effort. The authors also thank Dr Hakim Chalabi and Pitre Bourdon for the support from Aspetar and Aspire Academy. The authors thank the nurses, physiotherapists and sports medicine physicians from Aspetar for taking care of the players.
References
Footnotes
Patient consent Obtained.
Provenance and peer review Not commissioned; externally peer reviewed.