Article Text

Abstract
Background Foul play has been considered as one of the most important known extrinsic risk factors for injuries in football.
Aims To compare the incidence and characteristics of foul play injuries and non-foul injuries.
Methods Team physicians’ postmatch injury reports and official match statistics were obtained from all matches of the 2002, 2006 and 2010 Fédération Internationale de Football Association World Cups.
Results The number of injuries was associated with the number of fouls in a match. The incidence of foul play injuries (20.6/1000 match-hours, 95% CI 17.3 to 24.4) was significantly lower than that of non-foul injuries (42.6, 37.7 to 47.9), which also applied to all playing positions. The causation of injury (foul/non-foul), match period and teams’ drawing/losing/winning status were associated with the injury incidence. The interactions between the causation of injury (foul/non-foul) and match time, as well as the teams’ drawing/losing/winning status or playing position were not statistically significant. The median (IQR) days of absence resulting from foul play injuries were significantly shorter than that of non-foul injuries. The lower leg and ankle were more common locations for foul play injuries than for non-foul injuries, whereas the opposite was observed for thigh injuries. Contusions were a more common type of foul play injuries than non-foul injuries, while the opposite was found for muscle strains/ruptures/tears.
Conclusions The numbers of injuries and fouls in a match were significantly associated. No significant differences in the variation of foul play and non-foul injury incidences regarding match period, teams’ current winning/drawing/losing status and playing position were observed, suggesting that foul play injuries and non-foul injuries may share similar underlying risk factors.
- Sporting Injuries
- Soccer
- Epidemiology
Statistics from Altmetric.com
Introduction
The Fédération Internationale de Football Association (FIFA) has promoted Fair Play since 1988.1 Fair Play includes playing according to the Laws of the Game and respecting the players, referees, opponents and fans.2 Fair play is also an important aspect of injury prevention, since foul play (defined as unfair play in a game or sport)3 has been considered as one of the most important known extrinsic risk factors of football injuries.4 According to FIFA’s Laws of the Game, a foul in football is an infringement of the rules leading to a free kick or a penalty kick. This definition includes use of excessive force and careless or reckless offences on opponents by players or teams.5 Additionally, the following requirements for a foul have been outlined: (1) it must be committed by a player, (2) occur on the field of play and (3) occur while the ball is in play.6
There is no consensus on the definition of foul play injuries. Neither the consensus statement on injury definitions and data collection procedures in studies of football (soccer) injuries7 nor the Union of European Football Associations model8 included a definition of foul play injuries. Some authors have based their definition of foul play injuries on the referees’ decisions,9 ,10 while others have based it on the team physician’s report.11–14 Two studies comparing referees’ decisions in injury incidents during the match and the interpretations by a referee panel, performed by retrospectively viewing the incidents on video, have shown that the panel and the referee do not agree on all decisions,15 ,16 reflecting the difficulty in refereeing during match conditions. Factors like the home/away team status, match period and crowd size appear to influence football referees’ decisions.17 ,18
Foul play is involved in 14–37% of all football injuries,9–12 19–22 and in 35–80% of injuries resulting from contact between the players.12 ,13 ,15 ,23 ,24 The injuries caused by foul play are mostly sprains or contusions affecting the lower extremity (mainly the ankle, lower leg, thigh and knee).9 ,11 Although foul play injuries appear to be less severe than other injuries,20 they are responsible for 21–31% of all severe injuries.10 ,21 ,25 The proportion of contact injuries identified as fouls by the match referee varies in different areas of the pitch, being lowest in the attacking goal area.15 Junge et al26 reported that 90% of footballers were ready to commit an intentional (‘professional’) foul if required, depending on the score and importance of the match. Taking this into consideration, foul play injuries could potentially increase in certain match conditions, for example, depending on the teams’ drawing/losing/winning status or the match period.
Although foul play has been regarded as one of the causal factors for injuries in most football injury studies, detailed comparisons between foul play injuries and non-foul play injuries are rare. Two studies have concentrated on rule violations (foul play) and injuries in football,15 ,16 both of which concentrated mainly on factors influencing referees’ decisions.
The aims of the present study were to investigate differences between foul play injuries and non-foul injuries with regard to their characteristics and the match circumstances in which they occur, as well as the relationship between the number of fouls and the injuries per match in three FIFA World Cups. The hypothesis was that there is an association between the number of fouls and the number of injuries in a match.
Materials and methods
The study is based on the team physicians’ reports on 441 injuries from the FIFA World Cups in 2002, 2006 and 2010,10–12 and FIFA’s official match statistics for all 192 matches in the same tournaments.27
The match statistics included the time and number of goals, red cards and yellow cards, as well as the total number of fouls. The injury report forms and the data collection method have been described in previous publications,11–14 and followed the consensus statement for injury definitions and data collection procedures.7 The team physicians were requested to report the type and location of the injury, the time in the match when the injury occurred, the circumstances (non-contact, contact, foul play) and consequences (referees’ sanction, medical treatment) of the injury, as well as an estimate of the absence from training and/or playing football resulting from the injury.11–14
An injury was defined as any physical complaint incurred during the match that received medical attention from the team physician regardless of the consequences with respect to absence from the match or consequent training.11–14 Injuries were divided into foul play injuries and non-foul injuries based on the judgement of the team physician.
Severity of injuries
The definition of injury severity was based on the duration of absence from match play or training, as a consequence of the injury.7 ,8 In the present study, the team physicians estimated the duration of absence (in days) after the match.11–14 The injuries were categorised as slight (0 days), minimal (1–3 days), mild (4–7 days), moderate (8–28 days) and severe (over 28 days of absence).7 The number of injuries in each category was counted. Furthermore, the medians for the number of days of absence resulting from foul play injuries and non-foul injuries were calculated and compared.
Time in the match of foul play and non-foul injuries
The match was divided into six periods of 15 min. A possible extra time and minutes of additional time were excluded. The injury incidences of foul play injuries and non-foul injuries for the different match periods were calculated and compared.
Teams’ drawing/losing/winning status at time of injury
Foul play injuries and non-foul injuries were divided into three groups according to the team's drawing/losing/winning status at the time of the injury: (1) drawing, (2) losing and (3) winning.28 For the time of injury, the information provided on the injury report form was used, while the score at the time of injury was assessed from official match statistics. The time of the different match periods was calculated by using the times of goals from official match statistics.27 The injury incidences for all groups were calculated and compared.
Foul play injury incidence in relation to playing position
The incidences of foul play injuries and non-foul injuries were calculated and compared for all playing positions, assuming a hypothetical 1 : 4 : 4 : 2 formation (one goalkeeper, four defenders, four midfielders and two forwards).29 The playing position of each injured player was retrieved from FIFA’s official tournament statistics.27
Number of injuries and fouls per match
The matches were categorised in four groups according to the total number of injuries (0, 1–2, 3–4, ≥5) in order to ensure group sizes suitable for comparison. The mean number of fouls per match for each match category was calculated and compared.
Statistical analysis
The incidence of injury per 1000 match-hours was calculated using the formula: (number of injuries×1000 match-hours)/((minutes of exposure/60)×N players exposed). The number of players exposed was 22 for calculation of incidence in the different match periods and 11 for calculation of incidence for the drawing, losing or winning teams. Minutes of additional time were not taken into account.
The injury incidence (per 1000 match-hours) with 95% CI for foul play injuries and for non-foul injuries was calculated assuming a Poisson distribution. Incidence rate ratio (IRR) and the test for a significant trend in injury incidence across the groups were calculated using Poisson regression models. Frequencies, cross tabulations and χ2 test were applied for comparison of injury types and locations.
Statistical significance for the hypotheses of linearity between the total numbers of fouls per match and numbers of injuries per match was evaluated by using a bootstrap-type analysis of variance. In case of violation of the assumptions (non-normality), a bootstrap-type test was used. The normality of the variables was tested by using the Shapiro-Wilk W test.
Mann-Whitney’s test was used for comparison of the medians for the number of days of absence resulting from foul play injuries and non-foul play injuries.
The incidences of injury for foul play injuries and non-foul injuries during the different match periods, according to the team’s drawing/losing/winning status at the time of injury and according to the player's position were analysed with random effect Poisson regression models for the panel. The model included a random intercept to account for clustering within a match, as well as fixed effects for injury type (foul vs non-foul), as well as for match time (match period), the teams’ current drawing/losing/winning status and playing position. The interaction term allowed assessments of differences in injury causation (foul vs non-foul) between the different match periods, between the groups based on the teams’ drawing/losing/winning status and between playing positions.
The level of significance was set at p values <0.05. The STATA V.12.1, StataCorp LP (College Station, Texas, USA) statistical package was used for the analyses.
Results
In the three consecutive FIFA World Cups, a total of 134 injuries (30% of all injuries) resulted from foul play and 278 (63%) injuries were incurred without foul play. For 29 injuries (7%), the causation was not reported. The incidence of foul play injuries (20.6/1000 match-hours, 95% CI 17.3 to 24.4) was significantly (IRR 2.07, 95% CI 1.68 to 2.54; p<0.001) lower than the incidence of non-foul injuries (42.6, 95% CI 37.7 to 47.9). All foul play injuries were contact injuries, while 152 (54.7%) of the non-foul injuries were contact injuries and 125 (45%) were non-contact injuries. For one non-foul injury, the involvement of contact was not reported on the injury form.
Location and type of injuries
The injury locations of foul play injuries and non-foul injuries are presented in tables 1 and 2.
Locations of foul play injuries and non-foul injuries
Types of foul play injuries and non-foul injuries
Severity of injuries
For 127 (94.8% of all) foul play injuries and 254 (91.4%) non-foul injuries, an assessment of injury severity was reported on the injury form. The numbers of injuries in the different severity categories are presented in table 3. The median (IQR) days of absence resulting from foul play injuries were significantly shorter than for non-foul injuries (1 (0, 3) and 2 (0, 5), respectively; p<0.01).
Injury severity for foul play injuries and non-foul injuries
Timing of foul play injuries and non-foul injuries within the match
Figure 1 shows the incidences of foul play injuries and non-foul injuries during six 15 min periods of the match. The causation (foul vs non-foul) of injury and match time had a significant main effect on the injury incidence (p<0.001, both). No interaction between causation of injury (foul/non-foul) and match time was observed (p=0.99).

Injury incidence (with 95% CIs) in different match periods for foul play injuries and non-foul injuries.
Foul play injuries and non-foul injuries and teams’ drawing/losing/winning status
The incidences of foul play and non-foul injuries for the drawing, losing and winning teams are presented in figure 2. The causation of injury (foul vs non-foul) and the teams’ current drawing/losing/winning status had a significant main effect on the injury incidence (p<0.001 and p=0.01, respectively). The interaction between causation of injury (foul/non-foul) and the teams’ drawing/losing/winning status was not statistically significant (p=0.34).

Incidence of foul play injuries (with 95% CIs) and non-foul injuries according to teams’ current drawing/losing/winning status.
Incidences of foul play and non-foul play injuries for different playing positions
The incidences of non-foul play injuries were significantly higher than those of foul play injuries for all playing positions (forwards: 53.2 (95% CI 41 to 68.2) vs 26.2 (95% CI 17.8 to 37.2) (p<0.01), midfielders: 34.3 (95% CI 27.2 to 43.6) vs 21.6 (95% CI 16.1 to 28.4) (p<0.05), defenders: 46.1 (95% CI 37.9 to 55.6) vs 17.3, (95% CI 12.5 to 23.5) (p<0.001), goalkeepers: 28.8, (95% CI 16.8 to 46.1) vs 5.1 (95% CI 1.1 to 14.8) (p<0.01); figure 3). The interaction between the causation of injury (foul/non-foul) and playing position was not statistically significant (p=0.085).
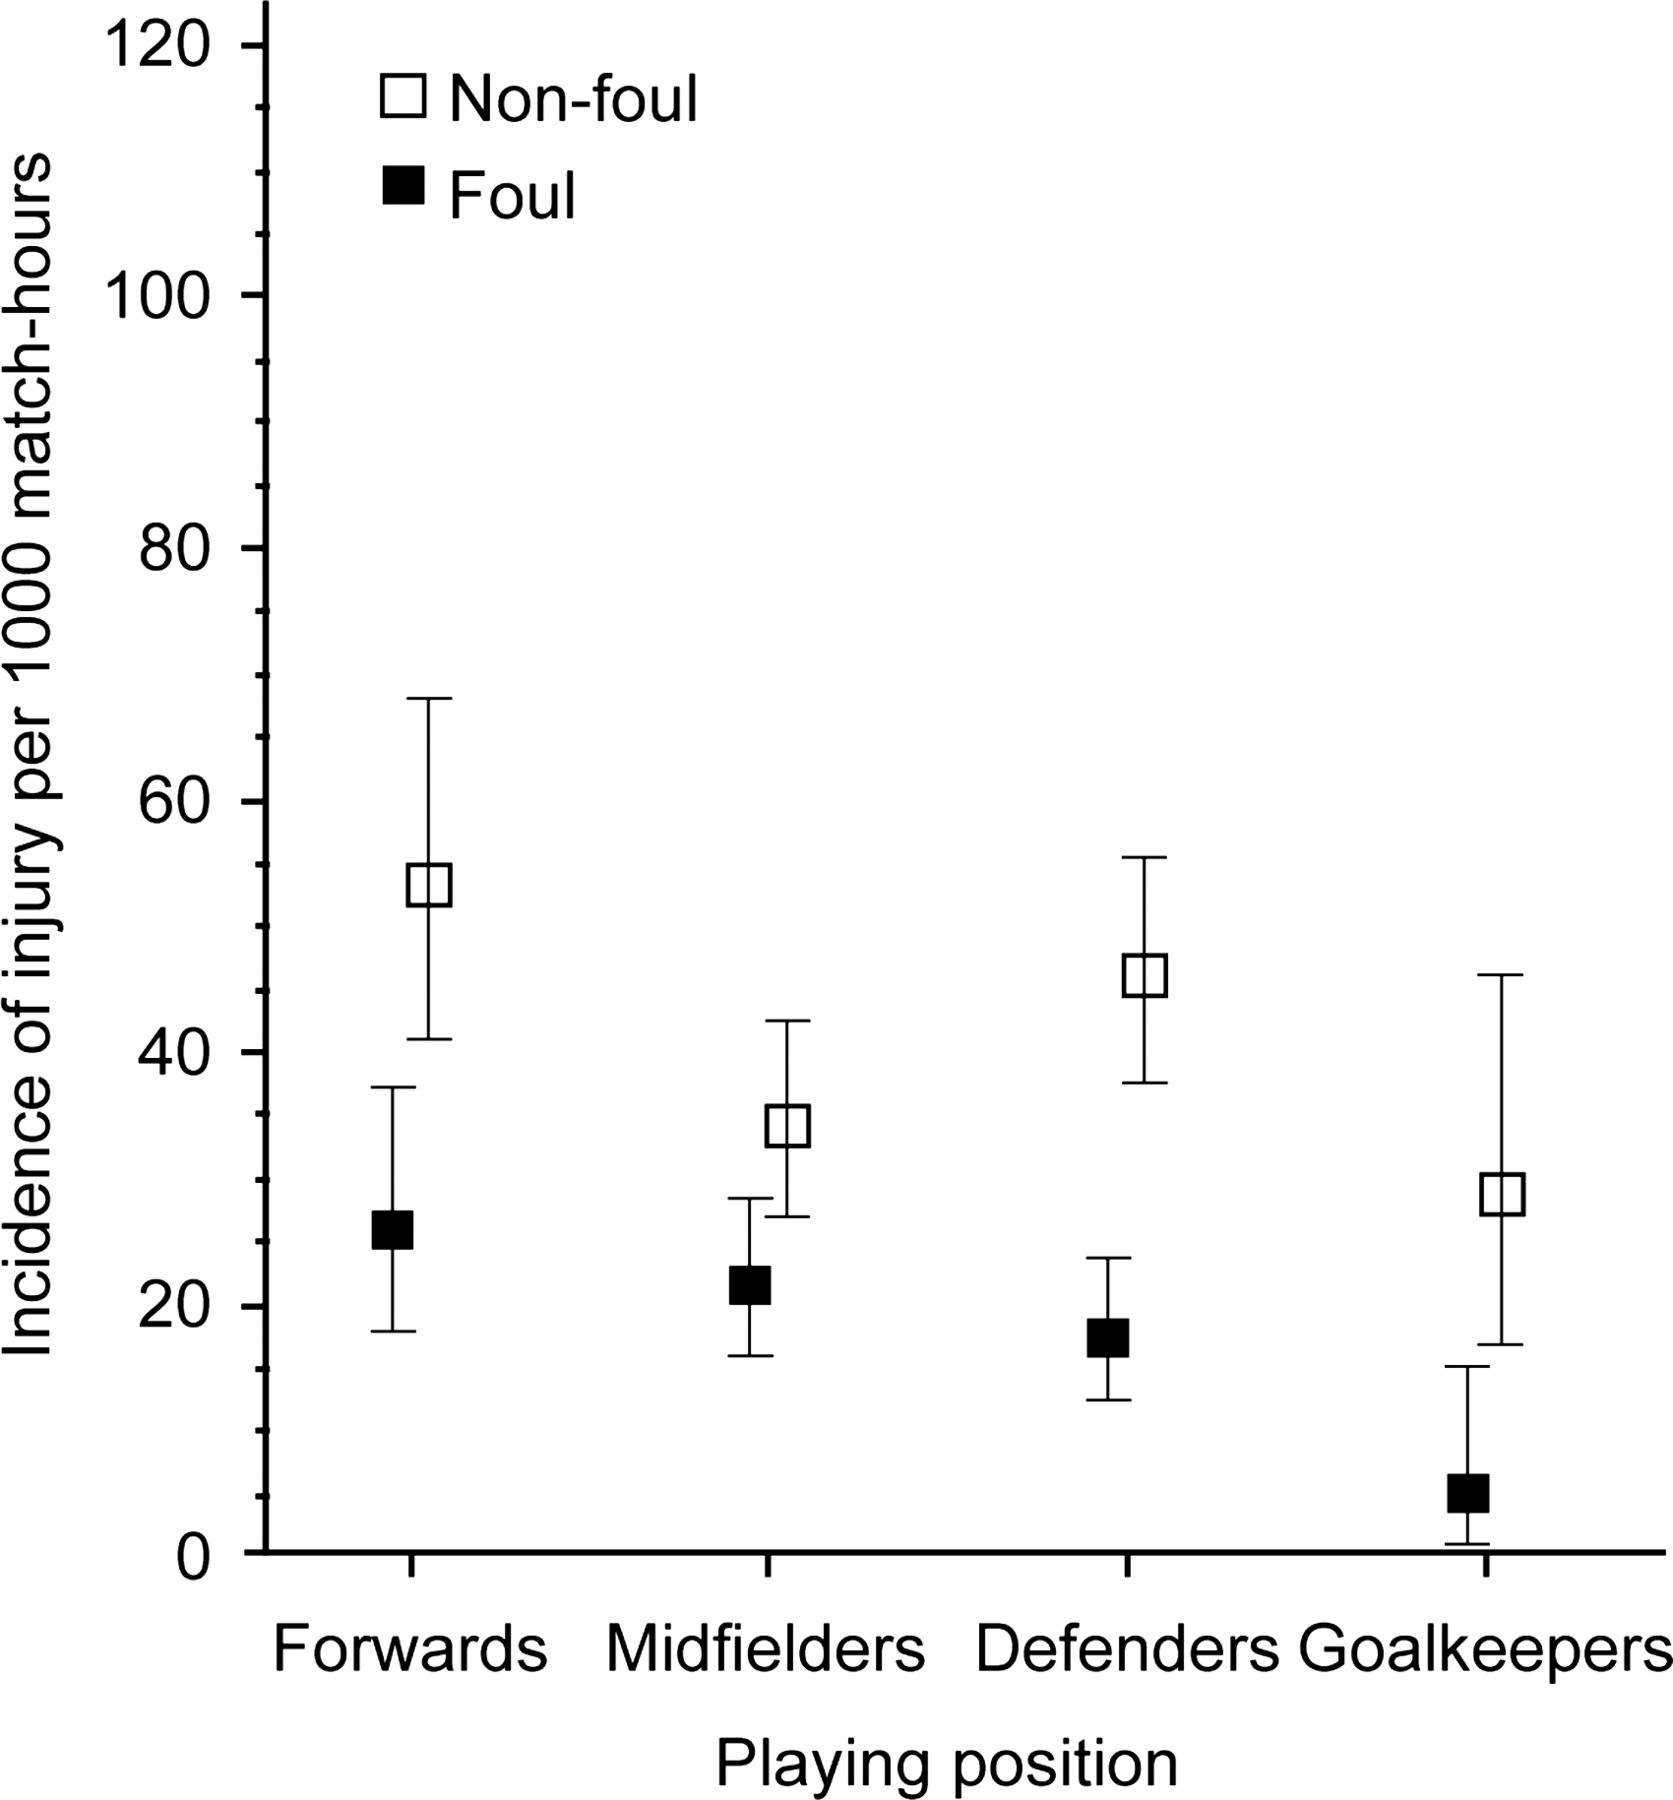
Incidence of foul play injuries (with 95% CIs) and non-foul injuries according to playing position.
Injury frequency per match in relation to number of fouls
A total of 6678 fouls were registered in the three FIFA World Cups (2002: 2300, 2006: 2367 and 2010: 2011). The number of fouls per match varied between 13 and 62, with a mean of 35 fouls per match (SD 1.7). From 22 matches, no injuries were reported, from 101 matches 1–2 injuries, from 46 matches 3–4 injuries and from 23 matches five or more injuries. There was a statistically significant relationship between the number of fouls per match and the number of injuries (figure 4; p for linearity <0.001).

Average number of fouls (with 95% CIs) in matches with different number of injuries.
Discussion
The main finding of the present study was that the number of fouls and the number of injuries in a match during FIFA World Cups were associated (p<0.001). To our knowledge, this association has not been reported previously. Hawkins and Fuller30 did not find a correlation between free kicks and injuries in the 1994 FIFA World Cup, using video analysis and media coverage as injury data, making direct comparisons difficult. A tendency of high foul frequency in the beginning of a match resulting in high total foul rates in a match has been shown, in the Turkish Football Super League.31 Whether or not the association between the number of injuries and fouls is caused by an increasing number of foul play injuries could not be assessed. However, the results suggest that a high foul frequency is also associated with a high non-foul injury incidence. The general injury incidence has previously been shown to be higher after yellow or red cards, injuries and goals.32 Previous research also suggests that an athlete’s concentration is negatively affected by aroused, angry behaviour and by a social environmental setting of considerable complexity and stress.33 Psychological stressors and situation-dependent emotional states also seem to have an effect on athletes’ risk of injury.34 These previous findings provide some possible underlying factors for the association between the frequencies of fouls and injuries.
In the present study, most foul play injuries did not result in any absence from playing football, and were less severe than non-foul injuries. They accounted for one-fourth of all the severe injuries (3/12) and a fifth of all the moderate injuries (9/40), which is in accord with previous studies.10 ,21 ,25 The clinical relevance of this finding remains unclear, due to the low total numbers of severe injuries. A small proportion of severe injuries is a common finding in studies relying on postmatch medical reports.11–14 ,35 Future studies should assess, for example, by use of follow-up questionnaires, whether underestimation of injury severity occurs in postmatch conditions.
The findings that contusions (mainly of the lower leg and ankle) constituted a larger proportion of foul play injuries compared with non-foul injuries and that the opposite was found for muscle strains/ruptures/tears (mainly of the thigh), support the results of previous studies,9 ,11 and appear to be logical, as all foul play injuries were contact injuries, while almost half of the non-foul injuries did not result from contact between players.
Waldén et al20 found no differences in the frequency of foul play injuries between six 15 min periods of a match in the European Championships. However, their data included only 17 foul play injuries. Junge et al11 reported that the number of foul play injuries increased from the first to the second 15 min period of a match and thereafter remained stable in the 2002 FIFA World Cup. Ekstrand et al9 found no differences in frequency of foul play injuries between the two halves of a match in European professional men’s club football. In the present study, the variation in foul play injury incidence within the different time periods of a match was similar to that of non-foul injuries, and their interaction was not statistically significant, showing that foul play injuries and non-foul injuries peaked during the same match periods (figure 1). The interaction between foul play injuries and non-foul injuries was not significant according to the teams’ current drawing/losing/winning status either. Ryynänen et al28 reported previously that teams currently leading the game in FIFA World Cups had the highest injury incidence.
The incidence of injury has previously been shown to vary significantly between different playing positions in FIFA World Cups.28 In the present study, all playing positions were found to have a higher incidence of non-foul injuries than of foul play injuries. No interaction was found between foul play injuries and non-foul injuries according to playing positions. These observations suggest that none of the positions run a substantially higher relative risk of suffering an injury caused by foul play compared with the other positions. However, while the incidence of foul play injury was similar for all playing positions, forwards and defenders had a substantially higher non-foul injury incidence than midfielders and goalkeepers (figure 3), as shown previously for all injuries.28
Implications for football authorities and teams’ management
Recognising match conditions and/or player groups with an increased risk of foul play injuries may be of use for the football governing bodies in order to adjust the rules of football for maximising the protection of players. It may also guide the referees to emphasise their injury protective role, that is, by severely sanctioning fouls during these match conditions. Team management and medical staff may also benefit from the knowledge, as it may enable them to take precautions, such as substitutions of players already under increased risk of suffering an injury, due to a recent previous injury, for example.
Developing means for efficient intervention at the beginning of the match may be important. A possible way to reduce injuries could be the referees’ early interventions in matches that start with high foul frequencies, for example, by severely sanctioning foul play or by communication with the team captains and/or management, in order to caution the teams or resolutely instruct them to play fair.
Definition of foul play injuries
The optimal method for defining foul play injuries may not have been the team physicians’ estimations, as the rules of football may not be their area of expertise. Therefore, some misinterpretations regarding the causation of injury (foul/non-foul) may have occurred. However, considering the factors affecting the match referees’ decisions during match circumstances, as discussed in the introduction, the referees’ decisions may also be biased, and therefore not optimal. While the match referee often has to make a decision within a fraction of a second, the team physician can base the postmatch evaluation on several factors: detailed incident description by the injured player, clinical examination of the injured player, discussion with other team staff, referees’ decision, his/her own vision of the incident and, in some cases, postmatch video recordings. Therefore, the evaluation may be easier for the team physician in postmatch conditions than for the match referee under match conditions.
Study limitations
Limitations of the present study are that all injury information were based on the team physicians’ reports after the matches, the exclusion of minutes of additional time and the assumption that all teams played in the 1 : 4 : 4 : 2 formation (one goalkeeper, four defenders, four midfielders and two forwards).
A possible source of bias may have been the inclusion of non-contact injuries in the analysis. As all non-contact injuries were non-foul by causation, they could have distinguished non-foul injuries from foul play injuries due to some different underlying risk factors for contact and non-contact injuries. All injuries were included in the analysis, because we wanted to investigate whether foul play injuries show some characteristics that distinguish them from all other injuries. The finding that, despite the potential bias, no significant differences in match conditions between foul play injuries and non-foul injuries were observed may suggest that non-contact and contact injuries share similar underlying, and partly unknown, risk factors.
The accuracy of postmatch diagnoses and of the estimation of injury severity was not assessed. As many players return to their clubs after international tournaments, the follow-up and treatment of injuries is often taken care of by the clubs’ medical staff.
Conclusions
In summary, the present study showed an association between the number of fouls and the number of injuries in a match. No significant differences in the variation of foul play and non-foul injury incidences regarding match period, teams’ current winning/drawing/losing status and playing position were observed, suggesting that foul play injuries and non-foul injuries may share similar underlying risk factors. Studies using alternative approaches (eg, video analysis) are needed for identifying factors underlying foul play in greater detail.
What are the new findings?
-
The average numbers of fouls and injuries in a match were associated.
-
The distribution of foul play injuries and non-foul injuries was similar with regard to time in the match, teams’ current drawing/losing/winning status and playing position.
-
The incidence of non-foul injuries was higher than that of foul play injuries for all playing positions.
How might it impact on clinical practice in the near future?
-
The teams may be able to reduce the risk of injuries through interaction between players, team medical personnel and team management.
-
The findings may be of use for referees in order to prevent more fouls and associated injuries during matches with high initial foul frequencies.
Acknowledgments
The authors gratefully acknowledge FIFA (Fédération Internationale de Football Association) for the funding of this study. We also greatly appreciate the co-operation of all team physicians who provided the injury data.
References
Footnotes
-
Contributors JR coordinated the study, collected part of the data, conducted the statistical analysis together with HK, and drafted the manuscript. All authors participated in the study design, through revision and by partly writing the research plan, as well as approving the final manuscript. JD and LP played a key role in the collection of injury data. AJ prepared the anonymous injury data files. JK, AJ and MB participated in the revision and writing of the research plan, the first draft, and the final manuscript.
-
Funding Fédération Internationale de Football Association (FIFA).
-
Competing interests None.
-
Ethics approval The ethics approval for injury surveillance was obtained previously by F-MARC. This approval covers the data of the present study and articles based on these data have been published previously.13
-
Provenance and peer review Not commissioned; externally peer reviewed.
-
▸ References to this paper are available online at http://bjsm.bmj.com