Article Text

Abstract
Background Musculoskeletal symptoms limit adherence to exercise interventions for individuals with type 2 diabetes. People with diabetes may be susceptible to tendinopathy due to chronically elevated blood glucose levels. Therefore, we aimed to investigate this potential association by systematically reviewing and meta-analysing case–control, cross-sectional, and studies that considered both of these conditions.
Methods Nine medical databases and hand searching methods were used without year limits to identify all relevant English language articles that considered diabetes and tendinopathy. Two authors applied exclusion criteria and one author extracted data with verification by a second author. Meta-analysis was conducted using a random effects model. Results were expressed as odds ratio (OR), mean difference or standardised mean difference with a confidence intervals (95% CI). Heterogeneity was assessed by I2.
Findings 31 studies were included in the final analysis of which 26 recruited people with diabetes and five recruited people with tendinopathy. Tendinopathy was more prevalent in people with diabetes (17 studies, OR 3·67, 95% CI 2·71 to 4·97), diabetes was more prevalent in people with tendinopathy (5 studies, OR 1·28, 95% CI 1·10 to 1·49), people with diabetes and tendinopathy had a longer duration of diabetes than people with diabetes only (6 studies, mean difference 5·26 years, 95% CI 4·15 to 6·36) and people with diabetes had thicker tendons than controls (9 studies, standardised mean difference 0·79 95% CI 0·47 to 1·12).
Interpretation These findings provide strong evidence that diabetes is associated with higher risk of tendinopathy. This is clinically relevant as tendinopathy may affect adherence to exercise interventions for diabetes.
- Diabetes
Statistics from Altmetric.com
Introduction
Tendon pathology (tendinopathy) is a complex condition that reduces tolerance to exercise and functional activities.1 This is important in conditions such as diabetes mellitus where exercise optimises glycaemic control.2 Up to 50% of participants who drop out of lifestyle interventions for type 2 diabetes do so due to musculoskeletal symptoms.3
In addition to excess load, current thinking acknowledges the potential for systemic risk factors for tendinopathy.4 For example age, sex,1 adiposity,5 statin use6 and elevated blood glucose levels,7 such as in diabetes mellitus, have been associated with predisposition to tendinopathy and so may affect its presentation and course.
Given the chronic nature of diabetes and the demonstrated effect of elevated glucose levels on tendons it is possible that people with diabetes are predisposed to tendinopathy. However, potential confounders exist that predispose to both diabetes and tendinopathy. In particular, the widespread prescription of statins to control hypercholesterolaemia in people with diabetes8 presents an additional risk for a type 1 error in meta-analysis.
The aim of this study was to systematically review and meta-analyse case–control, cross-sectional and cohort studies investigating the association between diabetes and tendinopathy.
Methods
Database search strategy
The search strategy and inclusion criteria were specified and documented in advance. An electronic search was conducted across nine medical literature databases: Allied and Complementary Medicine, Biological abstracts, CINAHL Plus, Current Contents Connect, EMBASE, MEDLINE, Scopus, SportDiscus, Web of Science from database inception to May 2015. Studies that included at least one tendon-related variable and one diabetes-related variable were sought. No publication year limits were applied but results were limited to English language papers. The search strategy used medical subject headings (MeSH) and free text search terms, as well as use of wildcards and truncations,9 and was deliberately broad to capture all relevant papers (see online supplementary appendix 1).
Three methods were used to find potentially relevant papers not identified by the electronic search. First, the reference lists of all included manuscripts were searched to identify any relevant studies. Second, publications citing any of the included manuscripts were identified using forward citation tracking on the Web of Science (Thomson Reuters, New York, New York, USA) database. Third, the ‘related articles’ function within the PubMed database was used with the top 50 ‘related articles’ for seven papers closely aligned with the core objectives of the review.
Study selection
Records were imported into referencing software (Endnote X7, Thomson Reuters, New York, New York, USA), and duplicates removed.
Inclusion criteria
Diagnoses of tendinopathy had to be made with clear clinical criteria (by a suitable expert), through analysis of tissue samples or via imaging (ie, MRI, ultrasound (US), X-ray or CT). Tendon thickness was recorded for comparison but was not considered diagnostic of tendinopathy.
Diabetes diagnosis was recorded in the patient's medical history, or tested with oral glucose tolerance test, fasting blood glucose test according to American Diabetes Association criteria.10 Patients recruited from specialist diabetes clinics were deemed to have an accurate diagnosis. Gestational diabetes was not considered in this review.
Exclusion criteria
Conference proceedings, reviews, case reports, case series, retrospective studies, technical notes, bulletins, animal studies and studies lacking a control group (or using population data as comparison) were excluded. Bursitis, carpal tunnel syndrome, Dupuyteren's contracture, frozen shoulder, limited joint mobility and plantar fasciitis were excluded as these are not primarily disorders of tendons.
Study inclusion was determined by two authors (TAR, AMYW) who independently considered title, abstract and full text. Disagreement was resolved by consultation with a third author (JLC). This was only necessary for one study.11
Data collection and risk of bias
One author (TAR) extracted data from the included studies using a structured form that allowed subgroup comparisons of participants with diabetes to be recorded. Extracted data were verified by a second author (JEG). Study authors were emailed to request additional data or clarification of methods in four studies.12–15
Data extracted included demographic characteristics of cases and controls (age, gender, body mass index (BMI)), type and method of diagnosis of diabetes, tendon studied, method of diagnosis of tendinopathy, study design, prevalence of tendinopathy in people with diabetes (and vice-versa) and tendon thickness. We also recorded diabetes duration, glycated haemoglobin (HbA1c) and presence of diabetic comorbidities.
Risk of bias in individual studies was assessed using a custom checklist drawn from published guidelines (see online supplementary appendix 1).16–19 The checklist was customised to better reflect the methodological considerations of case–control and cohort studies (rather than interventional studies) as they were expected to be the bulk of the included studies. An explicit decision rule was written for each item to reduce ambiguity. Four domains were assessed: study population, outcome measurement, analysis and reporting. These were considered separately and not combined for an overall score in line with PRISMA guidelines.20
One author performed the risk of bias assessment for all studies (TAR). A second author (AMYW) assessed the risk of bias in eight studies (15%) that were selected at random to allow for inter-rater reliability testing.
Risk of publication bias was assessed using funnel plots generated in RevMan. To generate 95% CI RevMan requires a fixed effects model. The fixed effect model was only used while creating these graphs.
Statistical analysis
Meta-analysis was performed using RevMan (V.5·2, The Cochrane Collaboration, Copenhagen, Denmark). A random-effects model was used due to clinical and methodological heterogeneity among the included studies.21 Continuous data were weighted using the inverse variance method and dichotomous data were weighted by the Mantel-Haenszel method. Odds ratios (OR) were used to compare the prevalence of diabetes among individuals with tendinopathy to controls, and the prevalence of tendinopathy among individuals with diabetes to controls. The mean difference (MD) in duration of diabetes (years) was calculated. Standardised mean difference (SMD) in tendon thickness was calculated to account for different tendons being studied.
Results were considered statistically significant when the 95% CI did not cross 1 for ORs, or did not cross 0 for MD and SMD. Heterogeneity was assessed using the I2 statistic which describes true variation across studies as a percentage, with a lower value indicating less heterogeneity between studies.22 Heterogeneity was considered high when I2 exceeded 50%.22 Missing SDs were calculated from either the SEM23 (using the equation  ), or estimated as either 25% of the range of values24 ,25 or from the average SD from similar studies.26
Data were combined when continuous variables were reported in multiple groups for: age,13 ,27–31 BMI,13 ,27–29 ,32–34 tendon thickness13 ,29 ,35 and duration of disease.24 ,33 This was done using the mean, SD and number of participants in each group using appropriate equations.36 In one study this was done with a calculated SD.24 Data from the dominant or right side have been used where both sides were presented.
To ensure that the same patients were not included more than once in any meta-analysis, we selected the study with the clearest reporting of our variables of interest in the case of studies reporting on different aspects of the same patient cohort.
In the case of separate studies reporting different variables from the same patient registry (eg, rotator cuff and lateral elbow tendinopathy) we selected one study from each registry according to the clearest reporting of our variables of interest.
Results
Search yield
The electronic search identified 1193 unique papers that were considered for inclusion (figure 1, flowchart). Assessment by title and abstract excluded 1058 papers. Full text assessment of the remaining 135 reduced the yield to 33 papers.11 ,13–15 ,24 ,27 ,29–35 ,37–56 Reference list checking of these 33 papers identified a further two papers26 ,57 for inclusion, PubMed related articles identified one paper;23 citation tracking did not identify any papers. Thirty-six papers were included at this stage.
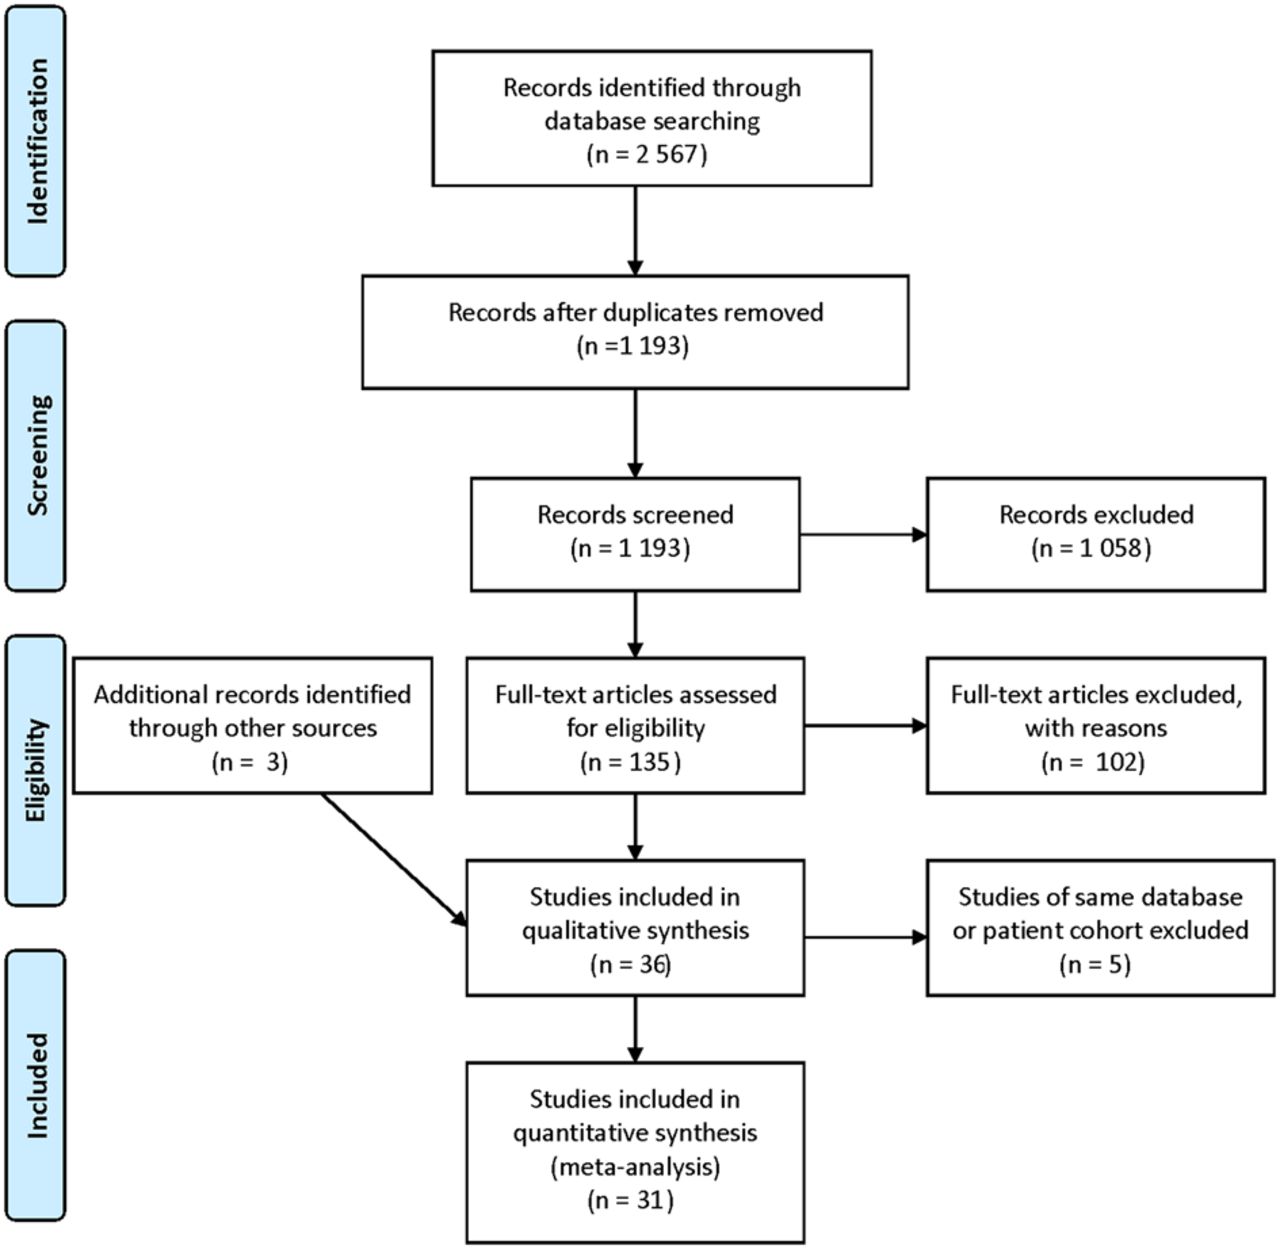
Flow chart showing studies retained at each stage of selection process.
Nine studies shared a dataset with at least one other included paper. Five reported results on different tendons (eg, elbow and shoulder) but used the same database,49 ,50 ,53 ,54 ,56 two reported different outcomes from the same patient cohort,13 ,55 and two shared the same cohort where the second paper was a follow-up with a slightly increased numbers.11 ,23 From these, four representative studies were included and the other five were excluded. A total of 31 studies were included for review.
Characteristics of included studies
Twenty-six of the 31 studies recruited participants with diabetes (table 1A). Of these, 13 exclusively recruited people with type 2 diabetes, none exclusively recruited people with type 1 diabetes, seven included people with either type 1 or 2 diabetes and six did not specify diabetes type. Four studies with both type 1 and 2 diabetes reported outcomes separately for these groups.24 ,33 ,34 ,42 Only one study34 found a significant difference in prevalence of tendinopathy between people with type 1 and 2 diabetes and reported that this was accounted for by duration of disease. The others did not find a significant difference between groups.24 ,33 ,42
Shows information from all included studies that included people with diabetes as cases (A) and that included people with tendinopathy as cases (B)
Five of the 31 studies recruited participants with tendinopathy. Two investigated tendon rupture, one rotator cuff syndrome, one lateral epicondylitis and one upper extremity tendonitis (table 1B).
Risk of bias assessment
The intraclass correlation coefficient for absolute inter-rater agreement was 0.700 (95% CI 0.570 to 0.791). The included studies performed best in the study population (average score, 71%) and reporting domains (average score, 88%) (see online supplementary appendix 2). Outcome measurement (average score 50%) and analysis (average score 61%) were less well performed.
Few studies reported use of a protocol which made it difficult to make informed comments on reporting bias. Studies tended to report variables for all their stated aims but did not specify which aims were determined in advance of conducting the study. Many studies, however, included negative results.
Funnel plots were used to assess publication bias (see online supplementary figures S6 and S7). Two plots (duration of diabetes and prevalence of diabetes in people with tendinopathy) did not have a sufficient number of studies to allow a meaningful interpretation. The funnel plot for the OR of tendinopathy prevalence in people with and without diabetes demonstrates some evidence of publication bias as the majority of small studies cluster to the right (ie, larger effect) of the pooled effect size. The funnel plot for the SMD of tendon thickness between those with and without diabetes does not suggest publication bias as most studies fell on or about the weighted mean.
Meta-analysis
Four outcomes were explored with meta-analysis. These were the prevalence of tendinopathy in people with diabetes (n=17 studies, figure 2), the prevalence of diabetes in people with tendinopathy (n=5, figure 3), the duration of diabetes in people with tendinopathy compared to those without tendinopathy (n=6, figure 4) and the tendon thickness of people with diabetes compared to controls (n=9, figure 5). Comparison of the rate of diabetic comorbidities and HbA1c between people with diabetes and tendinopathy, and people with diabetes only were reported in two33 ,51 and three studies,14 ,33 ,45 respectively. This was deemed insufficient for meaningful comparison so further analysis was not performed.

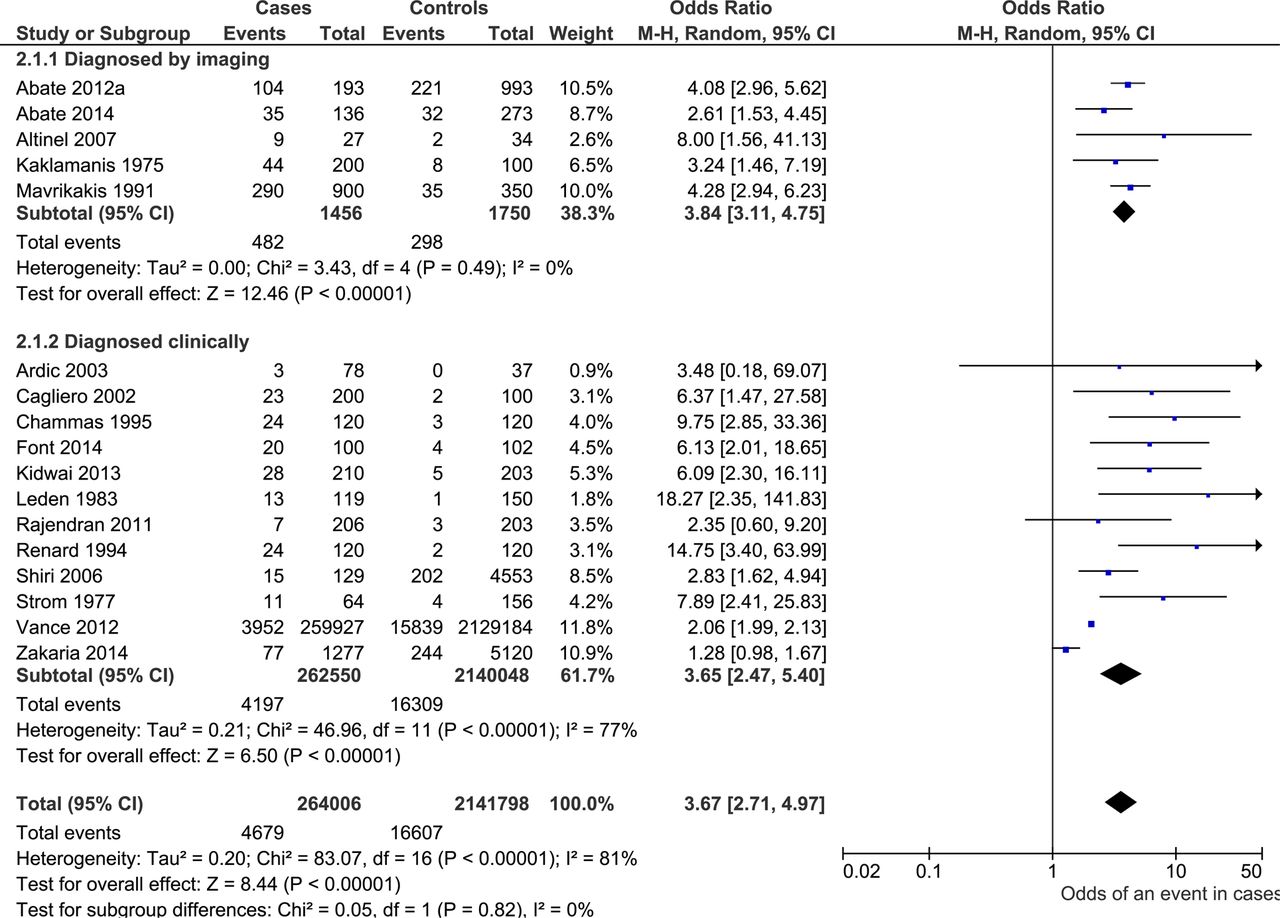
Forest plot showing OR and 95% CI of tendinopathy in people with diabetes (cases) compared to people without diabetes (controls). An OR of greater than 1 indicates increased probability of tendinopathy in people with diabetes.

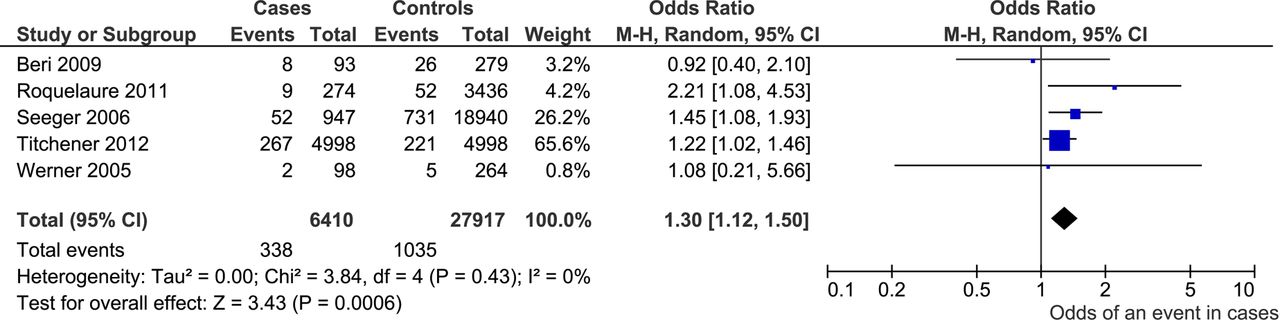
Forest plot showing the OR and 95% CI of a diagnosis of diabetes in people with tendinopathy (cases) compared to people without tendinopathy (controls).

Forest plot showing the mean difference and 95% CI of diabetes (since time of diagnosis in years) in people with diabetes and tendinopathy (cases) compared to people with diabetes but not tendinopathy (controls). Mean difference greater than 0 indicates increased average duration of diabetes in cases.

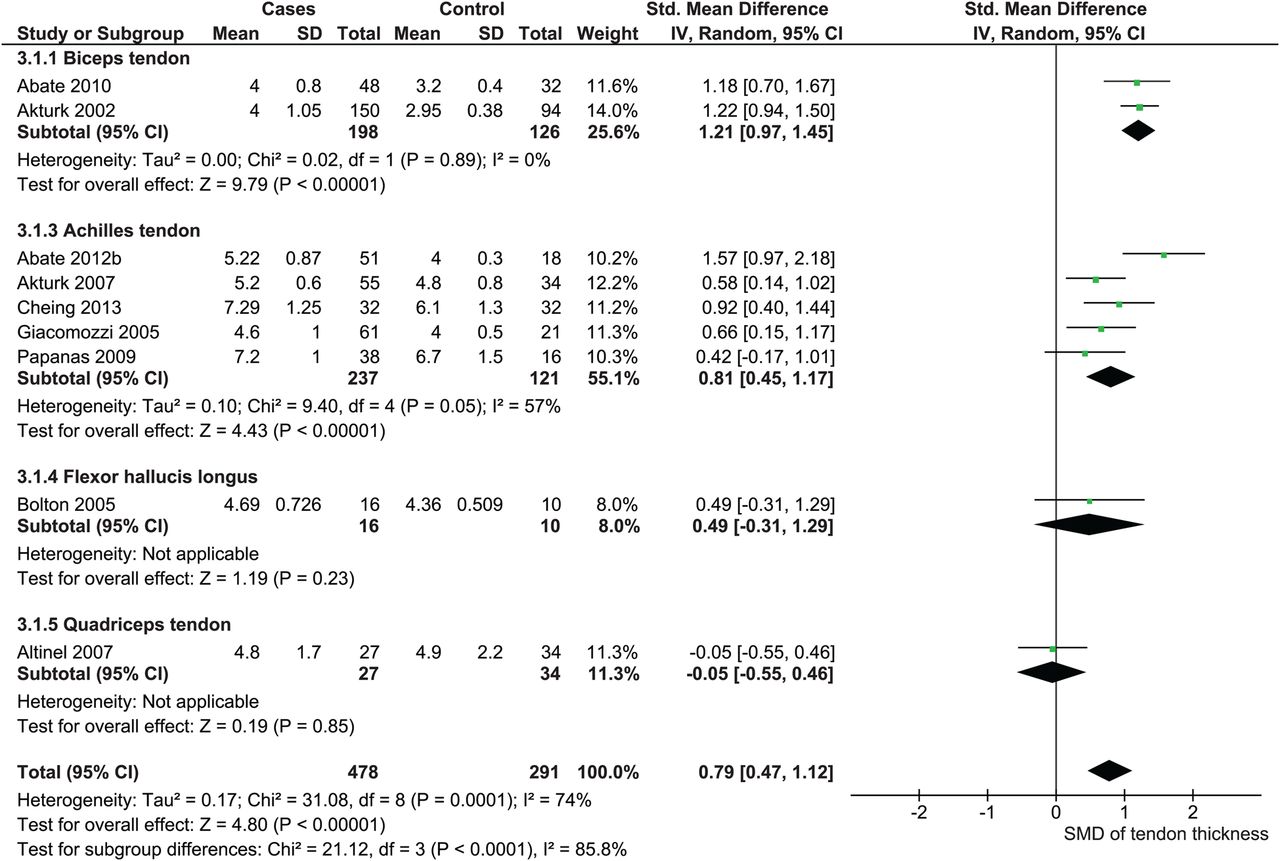
Standardised mean difference (SMD) and 95% CI of tendon thickness in people with diabetes (cases) compared to people without diabetes (controls). SMD greater than 0 indicates thicker tendons in people with diabetes.
Subgroup analyses
Studies reporting prevalence of tendinopathy in people with diabetes were subgrouped according to whether they diagnosed tendinopathy with imaging (n=5 studies, figure 2.1) or with clinical criteria (n=12, figure 2.2). There was minimal subgroup heterogeneity (between groups I2=0%) so pooled analysis was deemed valid. Both subgroups showed a significantly greater prevalence of tendinopathy among individuals with diabetes compared to controls and this was consistent with the pooled analysis (OR 3·67, 95% CI 2·71 to 4·97).
All of the studies that diagnosed tendinopathy with imaging were case–control. Three examined tendons using ultrasound (US)14 ,38 ,40 and two used X-ray.23 ,26 Despite differences in imaging modality and in diagnostic criteria for tendinopathy (table 1) there was minimal heterogeneity (I2=0%) and consistent, significant findings of greater prevalence of tendinopathy in people with diabetes than controls (OR 3·84, 95% CI 3·11 to 4·75). In contrast, studies that diagnosed tendinopathy clinically had high levels of within group heterogeneity (I2=77%) and inconsistent findings.
The prevalence of diabetes was higher in people with tendinopathy than those without tendinopathy (OR 1.30 95% CI 1.12 to 1.50, figure 3). Results between studies, however, were mixed with two finding no significant association between diabetes and tendinopathy whereas three identified a positive association. Three of these studies reviewed large medical databases15 ,48 ,50 and two sampled cohorts of working populations47 ,57 but subgrouping in this way did not correspond to studies that reported significant associations.
Six studies found greater duration of diabetes in participants with both diabetes and tendinopathy compared to those with diabetes but not tendinopathy (figure 4). This finding was significant in four of the six individual studies, the pooled result was significant (MD 5·26 years, 95% CI 4·15 to 6·36).
Tendon thickness
People with diabetes had thicker tendons compared to controls (pooled SMD 0·79 95% CI 0·47, 1·12, figure 5). Statistically significant subgroup differences, (between group I2=85·8%, chi2=21·12, p<0·001) indicated this effect might vary in different tendons. Individually, only six of nine studies showed significant results. Studies used various means to acquire images—seven used US,13 ,14 ,29 ,30 ,37 ,39 ,40 one used CT35 and one used MRI.31 Of the seven US studies one had non-significant findings,40 whereas the CT and MRI studies had non-significant findings.
Discussion
This review provides compelling evidence for an association between tendinopathy and diabetes. People with diabetes had more than three times the odds of tendinopathy compared to controls (OR 3.67, 95% CI 2.71 to 4.97, I2=81%, figure 2). People with tendinopathy had 1.3 times increased odds of diabetes compared to controls (OR 1.30, 95% CI 1.12 to 1.50, I2=0%, figure 3). People with both diabetes and tendinopathy had a longer duration of diabetes than people with diabetes but not tendinopathy (MD 5.26, 95% CI 4.15 to 6.36, I2=46%, figure 4). People with diabetes had thicker tendons than people without diabetes (SMD 0·79 95% CI 0·47, 1·12).
A biological pathway exists whereby hyperglycaemia associated with diabetes affects collagen cross-linking in tendons7 and reduces proteoglycan content.58 One previous systematic review has investigated the association between diabetes and tendinopathy.59 Six studies were included in a qualitative synthesis to investigate whether tendon thickness was increased in people with diabetes. Despite finding homogeneous results suggestive of an association between the two conditions, a link could not be established due to the methodological limitations of the included studies.59 Participant selection and measurement reproducibility were highlighted as methodological weaknesses. In our review we found very few studies that reported the time period over which cases and controls were recruited (33%). In contrast most studies used acceptable methods for obtaining measurements with the notable exception of assessor blinding, which was reported in only 21% of the included studies.
Confounding factors
In addition to methodological issues, there are potential confounders to a relationship between diabetes and tendinopathy. The use of statins has been advocated to control cholesterol levels in people with diabetes.8 ,60 Given the reported prevalence of hypercholesterolaemia in people with diabetes increased in the USA from 1999 to 2006 it is likely their use is widespread in this population.61 There is observational evidence that statins induce tendinopathy in humans62–64 so this may represent an important confounder for the observed relationship. Moreover, the average BMI of people with diabetes is as high as 30 kg/m2 (ie, obese),61 suggesting high baseline levels of adiposity in people with diabetes. There is evidence for an association between tendinopathy and adiposity so this may be another important possible confounder.5 ,65 ,66
The findings of increased prevalence of tendinopathy in people with diabetes and increased prevalence of diabetes in people with tendinopathy suggest a relationship exists between the two. However, given these confounders (ie, cholesterol, statins, adiposity) we cannot be sure of a direct causal link between diabetes and tendinopathy. Hyperglycaemia has been demonstrated to contribute to other microvascular complications of diabetes67 and it is plausible that tendinopathy develops by the same pathway. Irrespective of causality, these findings are of clinical relevance due to tendinopathy's limitation of exercise capacity,1 which may affect adherence to lifestyle interventions in type 2 diabetes.3 Awareness of predisposition to tendinopathy in people with diabetes may facilitate early diagnosis and management of this condition.
Diagnosis and monitoring
Studies that reported prevalence of tendinopathy via imaging in people with and without diabetes consistently showed a link with diabetes (OR 3.84, 95% CI 3.11 to 4.75, I2=0%, figure 2). This contrasts with results from studies that diagnosed tendinopathy clinically (OR 3.65, 95% CI 2.47 to 5.40, I2=77%, figure 2), which despite also being statistically significant had much higher levels of heterogeneity. This may be due to the reported discrepancy between tendon imaging and clinical presentation.68
A study of volleyball players found that players with abnormal tendon imaging could be pain free and players with normal imaging could present with pain.68 However, both groups were at greater risk of abnormal imaging and pain at the end of a 5-month season. This suggests both abnormal imaging and pain are independent predictors of tendinopathy. Both reducing pain (ie, clinical presentation) and improving structure (ie, observed on imaging) have been advocated as reasonable goals for tendinopathy management, with symptom resolution taking precedence.1
Changes in tendon presentation over time are particularly relevant given the finding of an association between increased duration of diabetes and tendinopathy (MD 5.26 yrs, 95% CI 4.15 to 6.36, I2=46%, figure 4). This has been observed in other diabetic comorbidities. A large cross-sectional study of people with diabetes in Canada found a small but significant increase in the OR of developing macrovascular and microvascular complications of diabetes as duration of disease increased after accounting for confounders (though they do not specifically mention statins).69 Furthermore, they found that glycaemic control is increasingly impaired as duration of diabetes increases irrespective of covariates and increasing management.69 This finding suggests that people with a long duration of diabetes are at greater risk of tendinopathy than people with a short duration. Cross-sectional studies that also ask about duration of diabetes, tendinopathy and statin use may be an effective way of clarifying the effect of statins on tendinopathy.
Clinical implications
Clinically, the finding of a link between tendinopathy and diabetes suggests that careful monitoring of load progression is particularly important in people with diabetes.70 ,71 What's more, some aspects of diabetes management may affect tendinopathy rehabilitation. For example, a lower average blood glucose level and blood glucose variability (ie, postprandial excursion72) would likely be beneficial for tendinopathy rehabilitation. This indicates the need for co-management by allied health and medical practitioners in the rehabilitation of tendinopathy in people with longstanding diabetes.
Limitations
There were a number of limitations to this study. There was inconsistency in the method of tendinopathy diagnoses, some studies used imaging and others clinical diagnosis. This was shown to affect the consistency of results. Despite this, both methods yielded an overall result in the same direction and of similar magnitude.
Publication bias may be present in studies detailing the prevalence of tendinopathy in people with and without diabetes. The clustering of small studies above the pooled mean suggests that small studies showing a positive effect were more likely to be submitted and accepted for publication. Duration of diabetes tended to be reported as a secondary outcome (ie, not the main investigation of the study) so may be subject to reporting bias,73 but it is difficult to discern the extent to which this would affect the results.
Several studies did not report the type of diabetes considered or combined results from participants with type 1 or 2 diabetes. While both types of diabetes expose the body to hyperglycaemia, other factors such as insulin resistance, adiposity and elevated lipids, more commonly found in individuals with type 2 diabetes,72 are associated with tendon pathology.5 ,75 ,76 It was not possible to compare participants by type of diabetes as too few studies included people with type 1 diabetes only. Further investigation of tendinopathy comparing its presentation in people with type 1 diabetes to people with type 2 diabetes may be of interest.
Finally, there were methodological shortcomings in many of the included studies. Most did not comment on assessor blinding and many did not specify the time period over which they recruited participants. Also, due to the nature of the studies it was not possible to account for potentially confounding variables. Nevertheless results can be applied to the general population of people with diabetes.
Summary
People with diabetes had more than three times the odds of tendinopathy compared to controls, people with tendinopathy had 1.3 times increased odds of diabetes compared to controls. These results offer strong evidence for a link between diabetes and tendinopathy. Cause and effect cannot be established but there are plausible biological pathways by which high blood glucose can affect tendon structure. Future research in this area should measure potential confounders such as adiposity, lipids, and statin use. Particular attention should be given to ensuring outcome assessor blinding and appropriate selection of control participants.
What are the findings?
This systematic review with meta-analysis provides compelling evidence for an association between diabetes and tendinopathy.
Tendinopathy is more common in people with diabetes and diabetes is more common in people with tendinopathy.
People with diabetes and tendinopathy have a longer duration of diabetes than those with diabetes but not tendinopathy.
How might it impact on clinical practice in the future?
Clinicians working with people who have diabetes should consider a gradual progression of exercise load to minimise risk of tendinopathy.
Improved diabetes management may improve tendinopathy rehabilitation in people with diabetes.
Co-management by medical and allied health practitioners may be indicated for people with tendinopathy and longstanding diabetes.
References
Supplementary materials
Supplementary Data
This web only file has been produced by the BMJ Publishing Group from an electronic file supplied by the author(s) and has not been edited for content.
- Data supplement 1 - Online supplement
- Data supplement 2 - Online Appendix 1
- Data supplement 3 - Online Appendix 2
- Data supplement 4 - Online figures
Footnotes
Correction notice This paper has been amended since it was published Online First. The following annotation was missed from table 1: “§§ Separate data is provided on the number of individuals with tendinopathy and the total number of tendinopathies so double counting can be avoided.”
Twitter Follow James Gaida at @tendonresearch
Note The authors are aware of a relevant publication by de Jonge, Rozenberg et al77 that is currently in-press. This paper was not detected by the database searches, as it had not yet been indexed.
Contributors TAR was involved in the literature search, manuscript preparation, tables and figures, data collection, data analysis, data interpretation. AMYW was involved in the data collection, data analysis, data interpretation, tables and figures. JLC was involved in the study design, literature search, data interpretation, manuscript preparation. JEG was involved in the study design, literature search, manuscript preparation, data collection, data analysis, data interpretation.
Funding JLC was supported by the Australian Centre for Research into Sports Injury and its Prevention, which is one of the International Research Centres for Prevention of Injury and Protection of Athlete Health supported by the International Olympic Committee (IOC). JLC is a NHMRC practitioner fellow (ID 1058493). A Research Foundation Grant awarded to Jamie Gaida by Sports Medicine Australia supported this research.
Competing interests None declared.
Provenance and peer review Not commissioned; externally peer reviewed.