Article Text

Statistics from Altmetric.com
Extremely low body weight and associated eating and body composition disorders are becoming prevalent in many sports, and can be summarised into three groups:
I. Sports in which weight restricts performance due to mechanical (gravitational) reasons. Among these are ski jumping, high jumping, long-distance running, jockeying, sport climbing, mountain running, up-hill bicycling, etc.
II. Weight class sports in which unhealthy short-term weight reduction behaviour, associated with extreme dehydration, can be observed because the athletes await an advantage when they are classified in a lower weight class. This group includes: wrestling, judo, boxing, kick-boxing, taekwondo, weight lifting, rowing, etc.
III. Aesthetic sports, in particular judged female sports, in which athletes (or their coaches) expect higher scores when their body weight and shape conform to their perceived body-ideals, eg, rhythmic and acrobatic gymnastics, figure skating, diving, synchronous swimming, dancing, etc.
The reasons why weight can be a performance factor are manifold and the effects have to be analysed within the context of all other performance determinants of a given sport. In climbing, for instance, it is the relation of force applicable through the fingers and toes to the body weight that determines performance to a large extend. In sports in which the body mass has to be lifted in the earth’s gravitational field low body weight will result in higher speed at a given energy turnover rate and mechanical efficiency of the human body. The role of weight as a performance factor in ski jumping has been studied in detail recently.1 2 3 4 5 6 7 8 9 In long distance running mechanical work necessary for accelerating body parts, and the body’s centre of mass at every step can be expected to be lower when compared with heavier athletes. However, the analysis of running economy is complex and weight is just one performance determinant among others.10 11 12 13 14 15 In weight class sports it is evident that athletes who are several kilograms heavier than their opponents (who did not reduce their weight for the weigh-in procedure) may have major advantages. Rapid weight loss and rapid weight gain practices in weight class sports have been described in several scientific publications.16 17 18 19 20 21 22 23 24 A survey from the physiological point of view on the effects of body weight reduction on sports performance can be found in Fogelholm.25
A number of studies has found a higher frequency of eating disorders in female athletes than in the control group; this is particularly the case in those athletes competing in sports that emphasise leanness and low body weight.26 27 28 29 30 31 32 33 34 35 36 37 38 39 40 41 Coaches and the general public believe that body weight and shape influence the scoring of the judges; this has been supported in female ice skaters with a history of eating disorders.42 In female gymnastics a lethal case of anorexia nervosa was reported.43 Seriously underweight athletes can develop clinical eating disorders such as anorexia nervosa, which is associated with grave mental and physical effects and can even lead to death.35 44 45 Eating disorders of female athletes are often combined with amenorrhoea and osteoporosis, which is called the female athlete triad.46 47 48 49
A large percentage of underweight athletes and cases of anorexia nervosa has also been reported in ski jumping of male athletes in the past. The problem in this sport is now reduced as a result of new regulations. However, a second step of regulation changes is missing that would further improve the health situation. The solution approach used in ski jumping, in which low weight development was counteracted by aerodynamic means, will be outlined in this publication and this may serve as a heuristic example for solution strategies based on research in other sports.
Assessment of relative body weight in terms of MI and BMI: the BMI as exceptional case (k = 0) of the general term for MI
The body mass index (BMI = m/h2; m body mass in kg; h body height in metres) is widely used to define appropriate body weight. The World Health Organization (WHO)50 defines three grades of thinness: grade I, BMI from 17 to 18.49, II from 16 to 16.99, III for BMI below 16. However, the BMI is a rough measure that does not distinguish between persons with alternative body properties. The Cormic index (s/h; with s sitting height and h body height), characterises the relative leg length, which should be considered for the classification of thinness or overweight.51 According to Norgan,52 Cormic index means range from 0.50 to 0.55 in different populations; correspondingly, the individual leg length affects relative body weight substantially. The BMI definition, the Cormic index C as a measure for the individual leg length, and the anthropometric data presented by N Norgan were the starting points for the deduction of a new measure for relative body weight: the mass index (MI), which takes the relative leg length of the individual into consideration.4 In his analysis of anthropometric data Norgan found an increase of BMI with increasing Cormic index: “Using the sitting height to body height ratio (Cormic index) C = s/h as an index of body shape in 158 groups (18 000 individuals), the regression coefficient of BMI on C was 0.90 kgm−2 per 0.01 C.” This increase mirrors the pronounced effect of individual leg length on BMI. The MI, which has recently been suggested,4 is a modification of the BMI according to the definition equation:

with C being the individual Cormic index s/h and

a value chosen in the middle of the Cormic index continuum. The original intention was to define a new measure for relative body weight MI that is independent of the relative leg length and thus independent of the Cormic index. Using the regression coefficient of 0.9 kgm−2 per 0.01 C, as found by Norgan, k could be determined: k = 2.015≈2; with k = 2 the simple formula for the MI results as:4

The unit is the same as for the BMI: kgm−2. With k = 2.0, the body height h does not appear in the final equation for the MI. In case further studies would imply using anthropometric datasets resulting in a value for the exponent k ≠ 2.0, both h and s would remain in the formula and the general term for MIk would result in:

From the infinite possibilities to define a MIk, (all are modifications of the BMI and consider the leg length as described in the general formula above), four examples for the values k = 2, k = 1.5, k = 1, k = 0.5 are given below. The mass index defined with a chosen k is termed MIk.


The MI0 (k = 0) is identical with the BMI:

For example, for a person with a BMI of 21.75 kgm−2 (weight of 66.6 kg, 1.75 m body height), and with a Cormic index of 0.51 (s = 0.893 m, ie, a person with long legs) we get: MI2 = 23.49 kgm−2, MI1.5 = 23.04 kgm−2, MI1 = 22.60 kgm−2, MI0.5 = 22.20 kgm−2, MI0 = 21.75 kgm−2 (ie, the the BMI value). Further research projects are necessary to figure out which k and thus which MIk formula is the best choice. Not only anthropometric studies of BMI dependency on C within various ethnic groups need to be the basis for defining the MI adequately. Many approaches are imaginable and can contribute to the determination of the k value. For instance, the appropriate calibration factor k can be determined by correlating MIk with body fat: the best choice for this type of question will be the k value that results in the highest correlation coefficient (the original intention of the introduction of the BMI was to assess total body fat). However, it has to be mentioned that large sample sizes may be necessary and that the various body composition measuring techniques have limited accuracy. It can be expected that a best choice of k shows better correlations with medical diagnoses in diseases in which low relative body weight plays an important role when compared with other choices of k or with the BMI (the BMI is just a specific case of the general MIk formula for k = 0). A thoroughly defined MIk for assessing relative body weight will be of high importance for the diagnosis of anorexia nervosa in individuals with short or long legs. Currently, one of the four criteria for diagnosing anorexia nervosa is a BMI below 17.5 kgm−2. In the future, the (appropriately chosen) MIk of 17.5 kgm−2 should be used instead the BMI. All future anthropometric datasets of both patients and athletes should include the sitting height, which is as easy to determine as the height;51 it takes just a few seconds and provides important additional information.
Scientific approach to counteract underweight tendencies: ski jumping as an example
The example of ski jumping has shown that scientific studies that explain the reasons for low-weight tendencies and that enable a detailed analysis of the quantitative effects of performance factors can be used advantageously for developing strategies for health hazard reductions. Similar approaches may also detect health problems in other sports and will be a reliable basis for the discussion of possible regulation changes in order to reduce health hazards in these sports. The first important step is the investigation of a representative part of the athletes (in ski jumping 100% of the World Cup athletes were investigated anthropometrically) in order to establish the possible existence of a health problem on a scientific basis.
Development of the sport
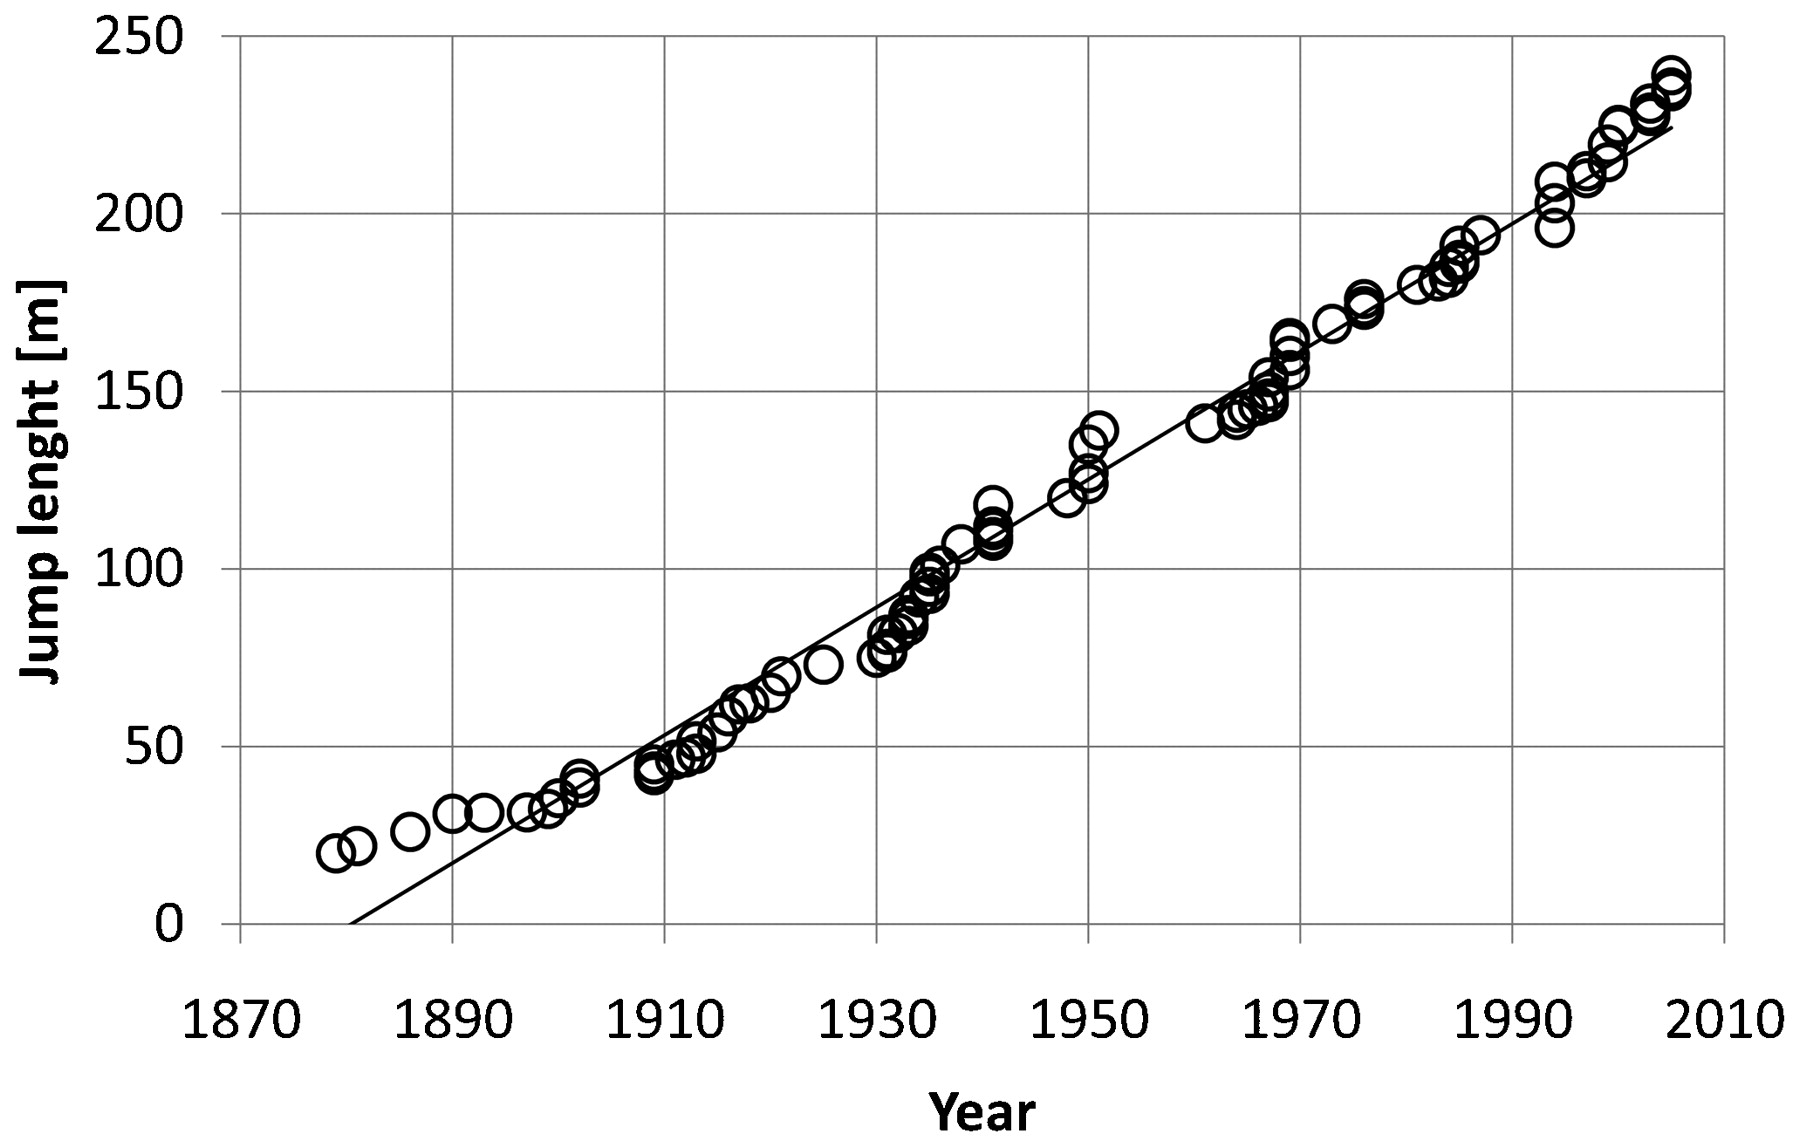
Since the early days of ski jumping the technique has changed several times. The first analytical model of ski jumping mechanics was developed by R Straumann in 1927,53 and many scientists have analysed the in-run and take-off technique and the flight styles in the various phases of the historical development of this sport. Ski jumping has been an Olympic event since 1924 (first gold medallist at the Olympic Games in Chamonix, France, was Jacob Tullin Thams) and still fascinates both athletes and spectators. The world record in ski jumping increased continuously over the years,54 from 35 m in 1900 to 239 m (BE Romören, Norway) in 2005 (fig 1). Olympic events include competitions on “normal hills”, designed for jumps up to 110 m and on “large hills” for jumps above 110 m.55 The world record was obtained on a “ski flying hill” designed for flights above 185 m in Planica, Slovenia. The height difference between ramp and run-out is limited by International Ski Federation (FIS) regulations and therefore improvements in the world record were only possible with increased aerodynamic forces and reduced weight, which result in a better glide path angle.

Development of ski jumping (ski flying) world records since the very beginning of ski jumping.
V-style ski jumping aerodynamics and the tumbling accident problem
All competitive ski jumpers now use the V-technique pioneered by J Boklöv (Sweden) in 1985: during the flight the skis are not held parallel to each other, thus this style is called V-style (fig 2). This flight style results in increased jumping length at a given in-run velocity due to the aerodynamic advantages when compared with the old parallel style.8 In addition, athletes found that they could lean forward in a more pronounced way when mounting the binding further back on their skis; the extreme flight style obtainable this way led to a very high tumbling risk, and many severe accidents caused by an unbalanced pitching moment occurred. Within the framework of a research project, supported by the FIS, the first aerodynamic investigation of V-style ski jumping was conducted. This research included large-scale wind tunnel measurements and the development of a computer model of ski jumping.8 9 Based on the analysis of the aerodynamic forces and the pitching moments associated with various flight positions and angles of attack, a limitation of the maximum percentage of front ski to total ski length was suggested. From the season 1994/5 on, the percentage was limited to 57% by the FIS. This regulation eased the pitching moment balance effectively and only one tumbling accident occurred during the 1994/5 World Cup, compared with 10 cases in 1993/4. Since then, tumbling accidents have occurred very rarely and can be attributed in most cases to gusts or to equipment defects. In these years it became obvious that most athletes were very thin and many of them were underweight, although no anthropometric data were available at the time. The first concept on how to counteract this unhealthy development was published in 1995:9

V-style ski jumping (World Cup and Ski Flying World Cup winner 2008/2009 Gregor Schlierenzauer). Photo: A Furtner.
“Another urgent problem is the anorexia deliberately induced by the athletes (low weight increases the jump length). We suggest a regulation relating ski length to body weight (a self-regulating approach).”
Body weight and performance
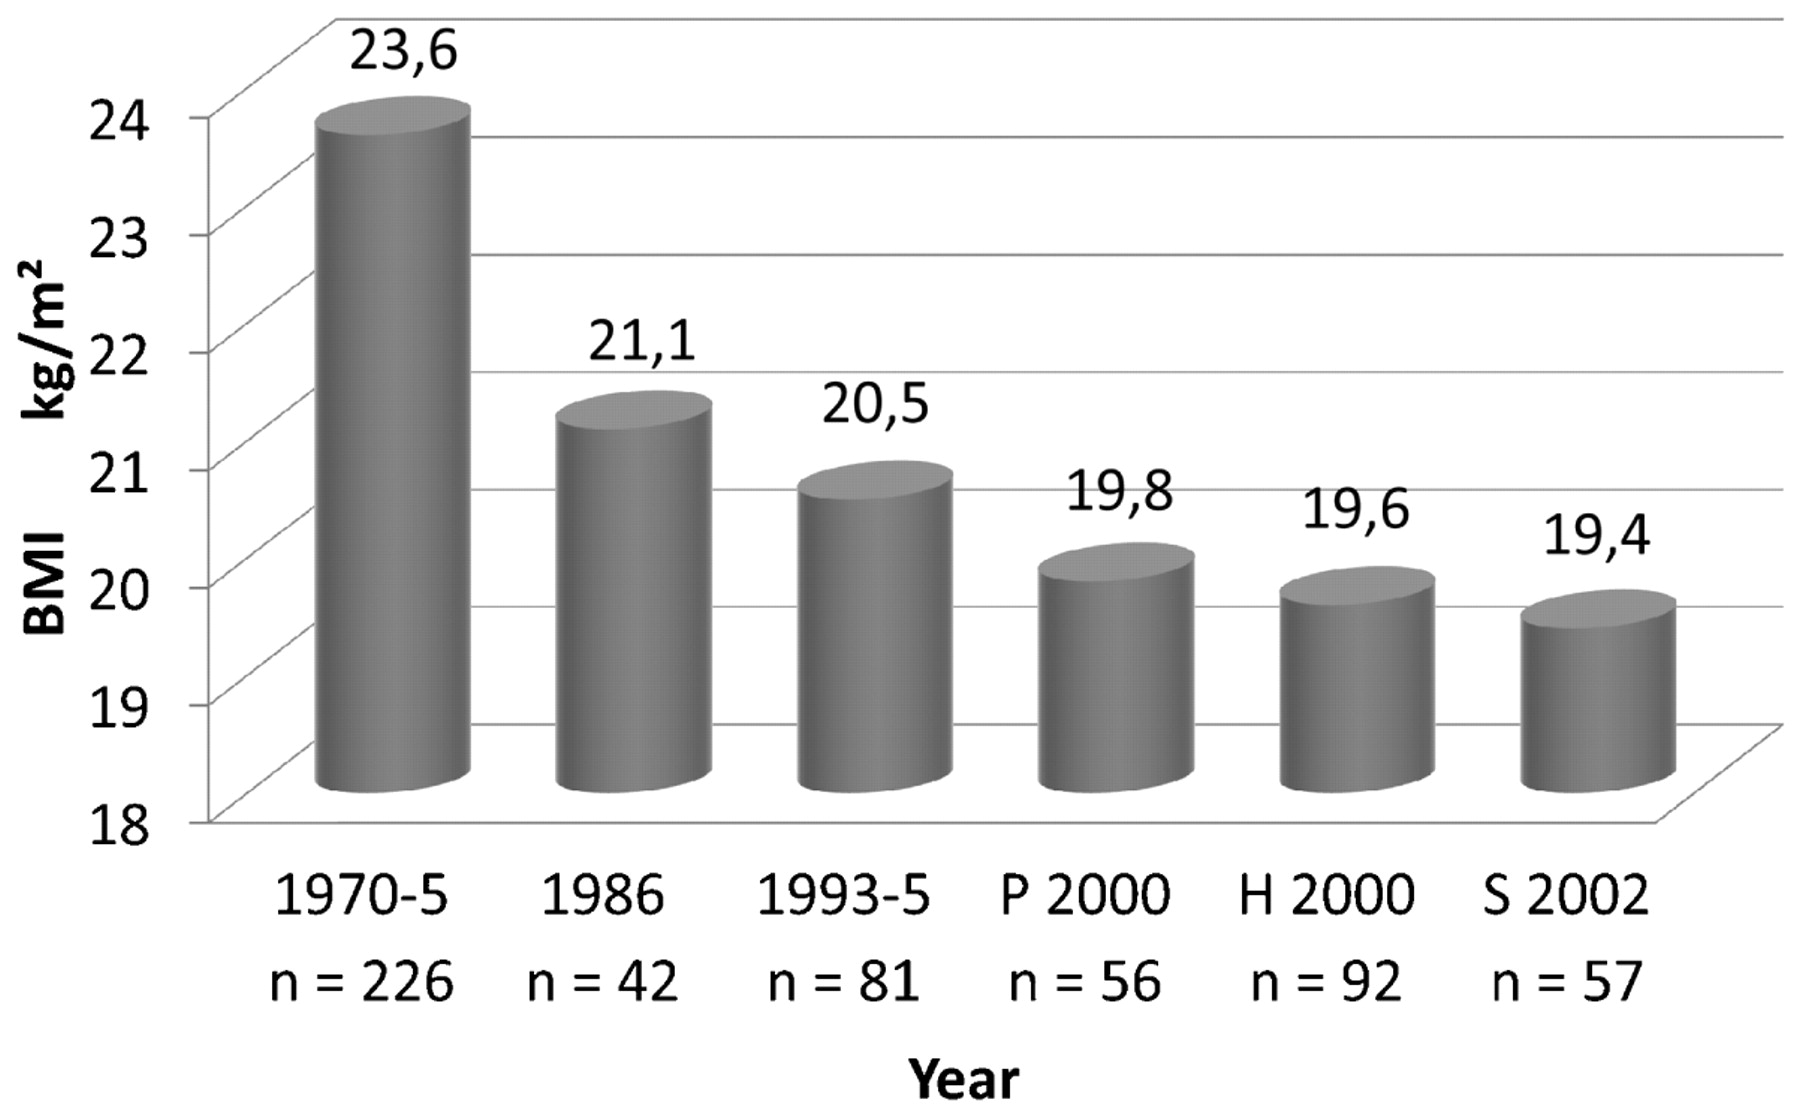
Due to broader and lighter skis, larger jumping suits made of thicker and stiffer materials and as a result of the V-style, aerodynamic forces (lift and drag) have increased greatly. Comparative wind tunnel measurements of typical parallel and V-style flight positions in the years 1976 and 1993, respectively, have shown that the V-style resulted in an increase in both the lift and the drag force of approximately 80%.8 Body weight became a pronounced performance factor because ski jumping became dominated much more by flight characteristics than by the jumping force of the athlete.2 6 7 8 9 The mean BMI has decreased from 23.6 kgm−2 in 1970–5 to 19.4 kgm−2 in 2002,4 56 57 ie, by more than four BMI units (fig 3), and extreme values found in World Cup athletes of 2002 were as low as 16.4 kgm−2. For a ski jumper with a body height of 1.80 m, for example, this decrease in the BMI by 4.2 kgm−2 would correspond to a 13.6 kg reduction in body weight. A decrease in the parameter mass of 13.6 kg in the computer simulation protocol results in an increase in jumping length of approximately 13 m on a large hill (fig 4a).5 6 8 9 This simulation does not take into consideration that light athletes can lean forward in a more pronounced way, which has additional aerodynamic advantages: the overall effect may be 20 m or even more.6 8

Decrease in relative body weight of ski jumpers from 1970 to 2002. Mean body mass (BMI) indices according to anthropometric measurements of Vaverka56 57 and Müller et al.4 The lowest measured value in 2002 among world class ski jumpers was 16.4 kgm−2. “P” indicates a study conducted in Planica (Slovenia), “H” in Hinterzarten (Germany), and “S” in Salt Lake City (USA).
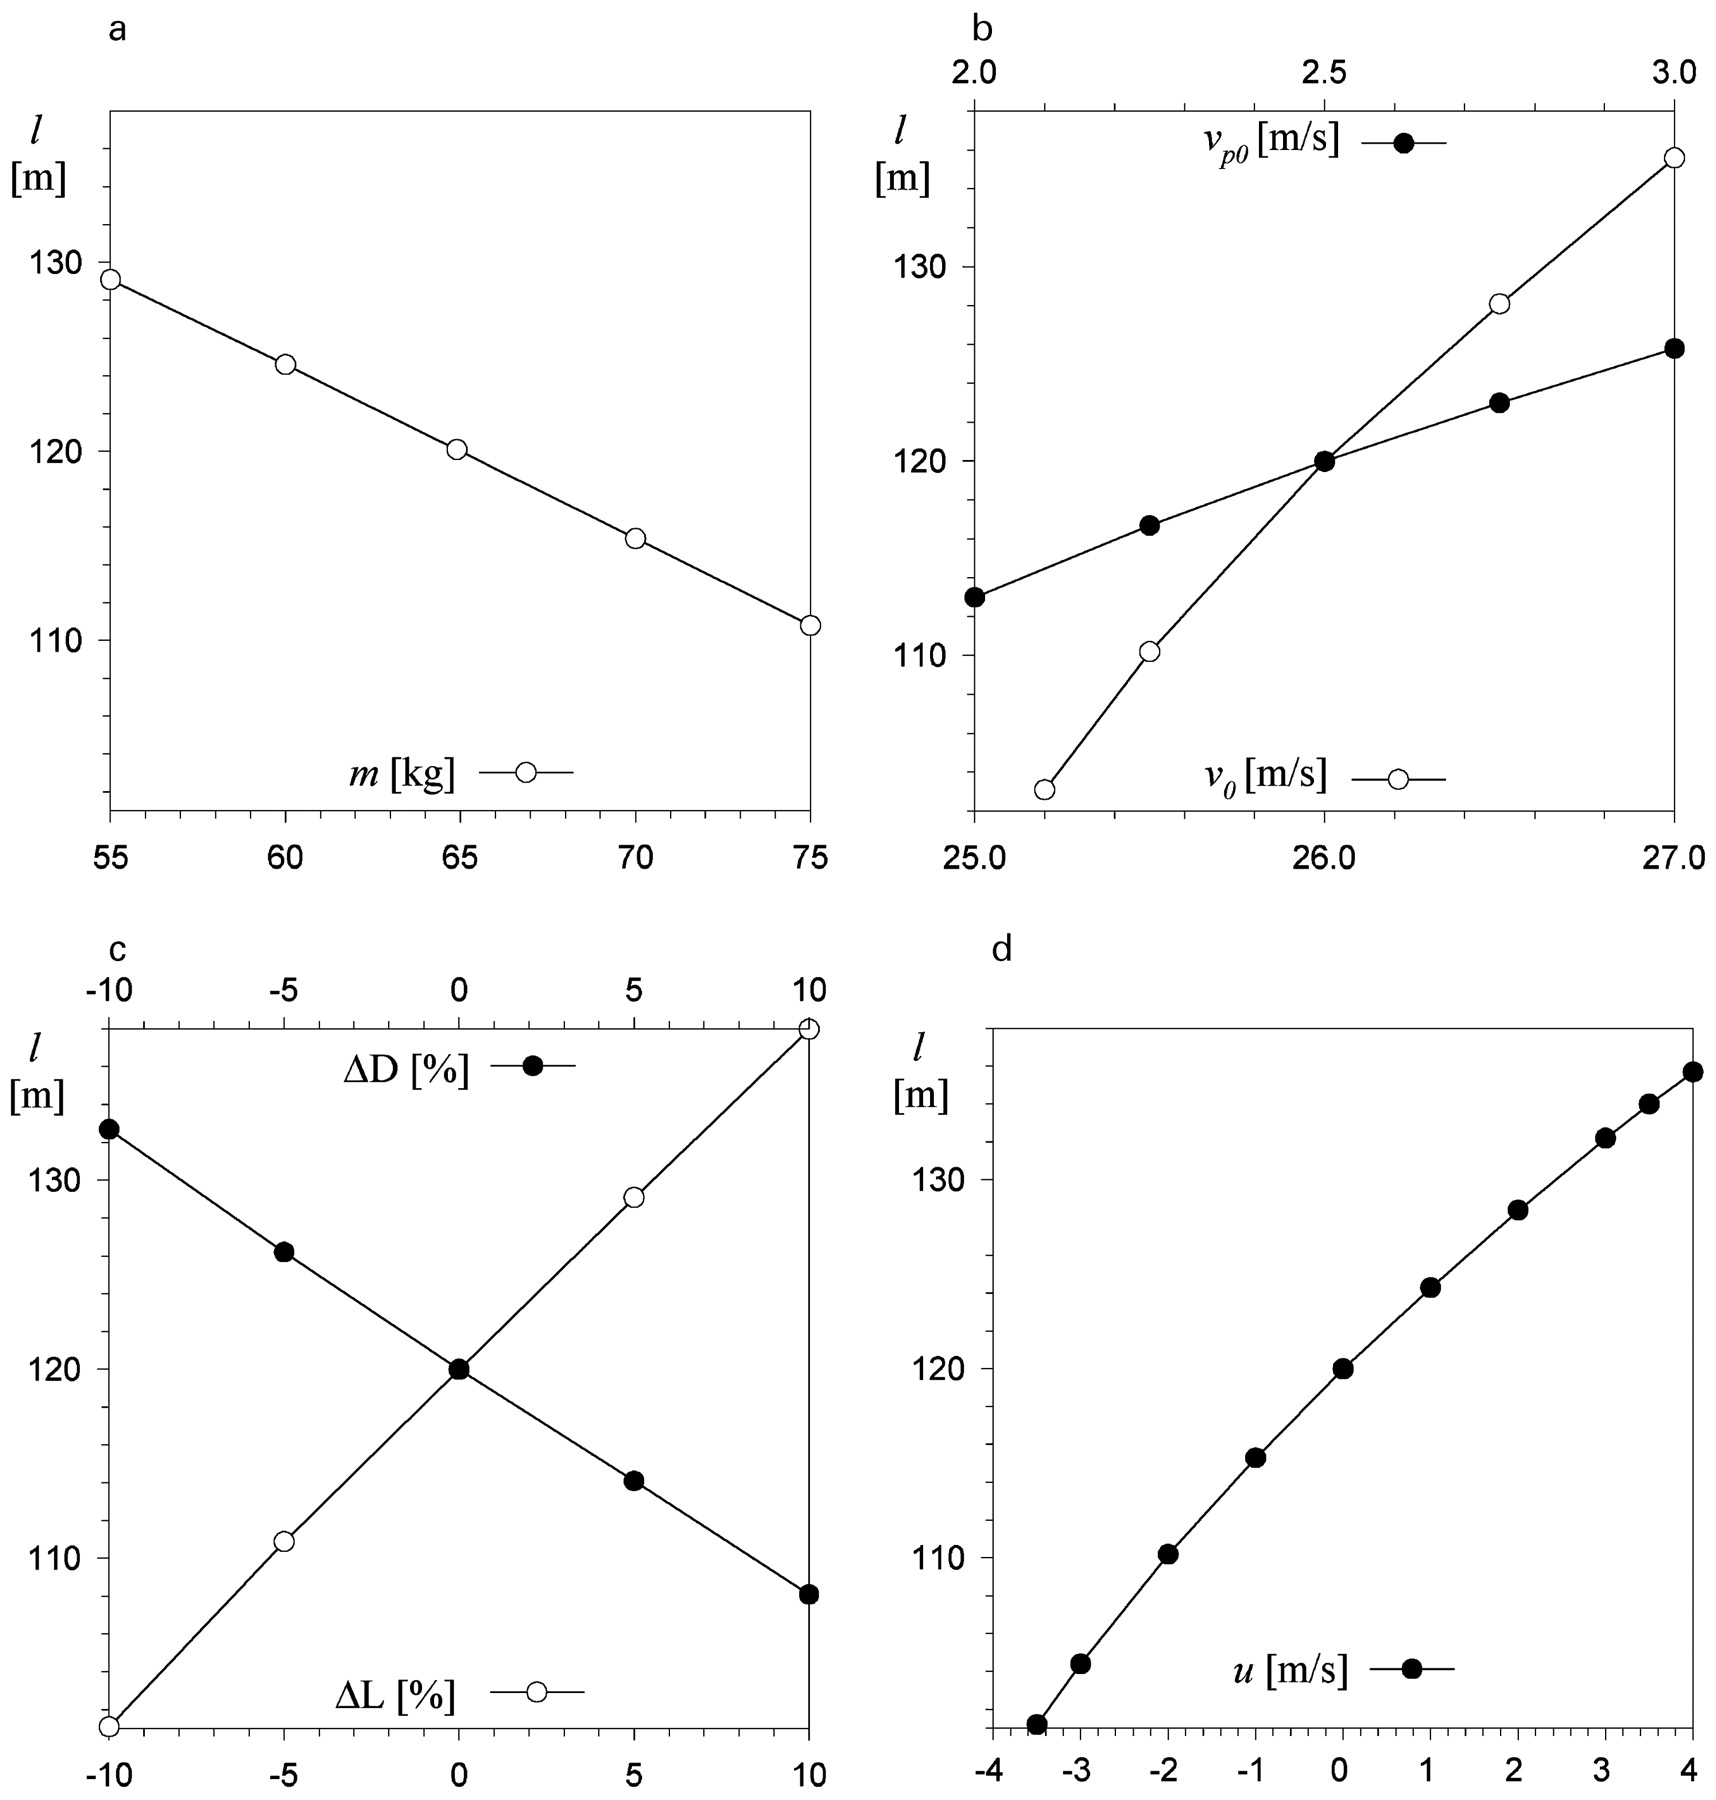
Parameter and initial value variations on the jump length. Reference jump A, representing a good jump of a world class athlete, has been used as a starting point.6 Characteristics of the starting-out protocol for the series of simulations: approach velocity v0 = 26 ms−1; take-off velocity perpendicular to the ramp vp0 = 2.5 ms−1; mass of athlete with his equipment m = 65 kg. All simulations use the new profile of the jumping hill in Innsbruck (K = 120 m). Simulation results used in this figure are from Müller and Schmölzer, 2002.62 (a) Effect of variation of the mass m (athlete with equipment) on the jump length l. The results do not contain secondary aerodynamic effects due to improved flight positions obtainable by an athlete when his weight is reduced. Slope: −0.9 m/kg. (b) Effects on the jump length l at varied in-run velocities v0 and velocities perpendicular to the ramp vp0 (as a result of the jump at take-off). Slope of the v0 – graph at l = 120 m: 16.2 m/ms−1; slope of the vp0 – graph: 12 m/ms−1. (c) Effects of shifts of L(t) and D(t) functions on the jump length. L and D are functions of flight time. In these simulation studies the values of the function were reduced or increased in steps of 5% with respect to the original values of the reference jump, within a range of −10% to 10%. Slopes: L: 1.8 m/%; D: −1.2 m/%. (d) Wind speed u; u positive for wind blowing constantly up the hill (angle ζ = 130°, with respect to x axes) and negative for wind from behind (320°). Slope: 4.3 m/ms−1.
The weight in the context of all other performance factors
Each performance determinant, which has an impact on the flight path and thus on the jump length, has to be seen in the context of the others in order to understand its relative importance; beside the mass of the athlete with his gear (m), the predominant factors are: high in-run velocity v0, high velocity (momentum) perpendicular to the ramp at take-off due to the jumping and the lift force vp0, accurate timing of the take-off with respect to the ramp edge, appropriate angular momentum at take-off in order to obtain an aerodynamically advantageous and stable flight position as soon as possible (this influences the L and D values used in the simulation after take-off and is implemented in the model this way), choice of advantageous body and equipment configurations during the entire flight in order to obtain optimum lift (L being the lift area) and drag values (D drag area), and the ability to control flight stability. Wind blowing up the hill (wind velocity u) increases the jump length dramatically and decreases the landing velocity, which eases the landing,1 8 vice versa for wind from behind. Figure 4(a–d) summarise the computer simulation results when these performance factors, representing all mechanical factors that determine the jump length, are varied in the simulation protocol (the new profile of the jumping hill in Innsbruck was used: K-point of the hill is 120 m). All simulation series of fig 4(a–d) started out from a reference jump (reference jump A) representing a good jump of a world class athlete.1 6
Mapping real world ski jumping to a computer model
The model is based on the equations of motion for a ski jumper.8 9 53 During the flight, the gravitational force Fg, the lift force Fl, and the drag force Fd act on the athlete and his equipment (fig 5) and determine the flight path of the centre of gravity of a ski jumper with a given set of initial conditions and parameters.

Forces acting on a flying object. The forces acting on a ski jumper flying through the air are the weight mg, the lift force Fl, and the drag force Fd. ϕ is the instantaneous angle of the flight path.


w is the relative wind vector (w = u – v, u being the velocity of external wind, v the velocity of motion), cl and cd are the lift and drag coefficients, respectively, A is the reference area (cross-section area), and g is the gravitational acceleration. L = cl A and D = cd A are called the lift and drag areas, which can be measured in a wind tunnel. The air density ρ is a function of the air pressure and thus decreases in the atmosphere with increasing altitude and temperature: ρ = p/RT (p being the air pressure, T the absolute temperature and R = 288.3 JK−1kg−1 is the gas constant).
The equations of motion consider all forces acting during the flight. These equations have already been used in the pioneering work by Straumann in 192753 and later in several analytical studies.58 59 60 They can be solved numerically for a given set of initial conditions with any desired accuracy:


During the flight phase the athlete’s position changes. The athlete can strongly influence the aerodynamic forces by changing his posture. He can affect the drag force, the lift force and the torque; the latter enables him to change his flight position and angle of attack with respect to the air stream. The real problem with simulation studies of the flight path of a ski jumper is the difficulty of obtaining accurate lift and drag area functions L(t) and D(t), respectively, which correspond to the changing postures of the athlete during the flight and to the time functions of the angles of attack of the body parts and the skis. High accuracy can be reached by using large-scale wind tunnel data of flight positions measured during ski jumping competitions.1 6 8 9 Comprehensive discussions of computer simulation studies of practical relevance for training methods, the design of jumping hills,61 62 and for the design of improved regulations as well as detailed description of the underlying field and wind tunnel studies can be found in Müller1 3, Schmölzer and Müller5 6 and Müller et al.8 9
Computer simulation studies
The two-dimensional computer modelling approach described above enables the investigator to predict the trajectory during the flight phase and to investigate the effects of parameter and initial value variations, and also allows the investigator to study wind from various directions (within the plane that contains the flight path).5 6 8 9 The absolute accuracy is in the range of a few meters on large hills (K = 120) and the accuracy of comparative studies of parameter and initial value variations can be expected to be less than 1 m in many cases,6 ie, of the same or even below the accuracy of jump length measurements during real competitions. The accuracy of the computer model as well as of the flight posture field studies and the wind tunnel measurements, which are used as input data in the computer simulations in order to map flight styles investigated during competitions, are discussed in Müller1 3 and Schmölzer and Müller.6 Due to the high accuracy of simulation outputs obtainable, many practically relevant questions can be answered reliably. Each simulation run results in the following outputs: jump length, landing velocity, landing velocity component perpendicular to the landing slope (which allows calculation of the landing impact in terms of “equivalent landing height”), height above ground (for every chosen jumping hill), velocity of motion, horizontal and vertical components of the velocity of motion, the flight trajectory as a function of the horizontal axis or flight time and the lift and drag forces acting on the athlete and his equipment during the entire flight. Of course, further variables, eg, the time function of the linear momentum p(t), or the kinetic energy Ekin(t) can also be calculated and displayed graphically.
Ski jumping weight regulations based on scientific investigations
Reducing the ski length for athletes who are too light can solve the underweight problem: shorter skis are smaller “wings” and when the rule is designed adequately this aerodynamic disadvantage compensates for the advantage of being of low weight. Thereby it is no longer attractive for athletes to be underweight. Studies of the athletes’ anthropometric status on one hand4 and of the importance of weight in the context of aerodynamic forces on the other hand6 8 9 formed the basis for the discussion of the changes to the regulations.63 The FIS has adopted the suggestion to solve the problem by relating maximum permitted ski length to relative body weight in terms of BMI in 2004; however, the BMI cut-off point chosen by the FIS was lower than that suggested.63 In addition to the ski length limitation, which had already been used before (maximum ski length is 146% of body height), this percentage is now reduced for those athletes whose relation of weight (including the jumping shoes and the suit) to body height squared is less than 20 kgm−2. This corresponds to a correctly measured BMI of slightly more than 18.5 kgm−2 (18.5 kgm−2 is the WHO underweight cut-off point). Every 0.5 units below 20 kgm−2 the maximum ski length percentage (of the athlete’s height) is reduced by 2%. For example, a value of 19 kgm−2 would result in a ski length of only 142% of the body height. In the season following the introduction of this new regulation (FIS Congress in Miami, 2004), the number of athletes with BMI values (in kgm−2) between 18 and 18.5 dropped from 14.0% in 2002 to 7.7%, for those with values between 17 and 18.5 from 7% to 1%, and with values below 17 from 1.8% to 0%.4 The fact that currently leading athletes are still below a BMI of 18.5 kgm−2 (corresponding approximately to a “FIS value” of 20) supports the opinion of all those who see a necessity to increase the cut-off point. A regulation should not start at the edge of underweight where one wants to keep the athletes away from; the regulation should start noticeably above it, otherwise an accumulation at the edge point must be expected. In the design of new regulations the slope should be below that used now (currently 4% ski length reduction per unit of BMI). Slopes above 3% per unit BMI make cheating possible (reducing body height on purpose can increase ski length because the BMI effect is dominant in this case). However, if the slope is too low, the regulation will not be effective enough. It is to be hoped that a second step concerning the BMI rule will follow soon, which will further improve the low weight problem in ski jumping. This will also increase fairness because this regulation will enlarge the worldwide pool of potential competitive ski jumpers when those who are not very thin by nature or by reducing their weight deliberately to very low values also get a chance to win a competition—a situation that existed some decades ago.
The research results on the physics of ski jumping and the anthropometric status of world class ski jumpers were advantageously used to help guide the sport’s development towards a reduction of health risks. Two important regulation changes in this regard (the limitation of the front ski percentage and the BMI rule) have already been introduced. Success in translating research results into improved sport regulations can only be obtained if athletes and their coaches as well as the officials of national and international federations are willing to support health-improving or protecting changes to the regulations. This was the case in ski jumping: the FIS, the International Olympic Committee (IOC), and many coaches and athletes supported the introduction of the new rules in 1994 and 2004, respectively. Of course, many discussions were necessary and prejudices had to be disproved, which was only possible on the basis of reliable scientific data. For instance, the often heard argument that “in some sports, like basketball, athletes have to be tall, and, similarly, in ski jumping it is sport-inherent that athletes have to be light” disappeared with reference to fig 3, which clearly demonstrates that athletes were not thin in the history of ski jumping. The introduction of “weight” (in terms of BMI) into the ski jumping regulations was completely new and it took quite a time to overcome psychological barriers (one could hear arguments such as: “we don’t want to become a weight class sport like boxing”) and to convince the ski jumping community that this was a necessity to base the regulations not only on stature but also on body weight in order to solve the underweight problem effectively. Approaches that would lead indirectly to higher weight, eg, the design of ski jumping events with the jumping force being a dominating performance factor again, like competitions on 50 m hills, appeared not to be practicable because such events are not spectacular, and other indirect approaches such as smaller suits in order to reduce aerodynamic forces were not effective enough.
Discussion and conclusions
Low weight can be a performance determinant in several sports; however, it should be made clear to athletes and their coaches that very low weight can cause severe performance setbacks due to a decrease in muscle force, general weakness, reduced ability to cope with pressure and increased susceptibility to diseases. If an upcoming low weight problem can be anticipated or is already established in a sport, regulations can be a tool to stop such unhealthy tendencies. In ski jumping, for example, the problem could be stopped by aerodynamic means, in particular by limiting the ski length for very light athletes.
It is up to the athletes, coaches, sport officials, sports medical doctors, physical therapists, nutritionists and scientists dealing with a sport to induce developments towards a healthy future. In accordance with the primary concern of the IOC Medical Commission, the protection of the athlete’s health must have precedence over all other perspectives. Research projects in the field of body composition and health and performance should be designed and supported in order to develop further this transdisciplinary field of research, which is of great importance for both sports practice and basic medical research.
Anthropometric values of stature, body weight and sitting height can easily be measured with high accuracy using simple equipment; however, the interpretation of weight with respect to body dimensions (“relative body weight”) is not a simple task. The WHO Expert Committee on Physical Status stated in this regard:
“Since BMI is independent of height, it is a more appropriate measurement for most populations than weight alone. Problems arise, however, in adults whose shape differ from the norm, particularly those whose legs are shorter or longer than might be expected for their height.”51
Therefore, whenever the weight and height of an athlete are measured it should be obligatory to measure her or his sitting height, s, as well, which is as easy as the measurement of body height, and all it additionally needs is a table to sit on.64 The design of the new measure MI1 4 considers the relative leg length and is therefore advantageous when compared with the BMI. In the general MI formula the stature h, the sitting height s, and the body mass m determine the value of this index:

with C being the individual Cormic index (C = s/h) and

(this value in the middle of the Cormic index continuum was used to represent “mean leg length”). For k = 2, the general equation reduces to the simple equation:

This choice of k = 2 resulted from anthropometric data;52 however, the slope of the regression is based in this publication on group mean values for BMI and for C, which is not necessarily equal to the mean of the slopes of regression lines within individual groups. Therefore, the definition of the MI in this way is a preliminary one, and further studies will be necessary to show what the best choice is for the MI definition. The BMI is just the special case for k = 0 in the general MIk formula (BMI = MI0). Choosing k = 1 would result in:

Anthropometric measures such as the BMI or the MI can principally never distinguish between fat and the lean body mass of an individual. Determination of body composition is associated with basic measuring problems, and most methods have to use assumptions or are based on correlations with other methods that also have their inaccuracies. For instance, the principle assumption of hydrostatic weighing, which is the reference method for assessing body composition, is that the density of the fat-free mass is constant. Errors will occur in all cases when this underlying assumption is violated. All methods in use have their shortcomings and their accuracy limits can only theoretically be assessed because there is no “gold standard” available: all techniques are being discussed controversially and comparative measurements with various techniques usually show substantial deviations that can even occur within a given method.46 65 Ultrasound can be used for measuring subcutaneous fat thickness; for accurate measurements a correction of the speed of sound in fat is necessary that can easily be done by changing this parameter in the software. This way, measurements with an accuracy of approximately 1 mm or even below are possible, at least in individuals who are not obese (M Horn, W Müller, HPR Graz, unpublished results). This provides information based on measurement and allows determining fat patterning and total subcutaneous fat (the accuracy of the latter depends on the number and distribution of measuring points on the body). It is questionable whether a model-based calculation of total body fat should be done at all due to the inherent problems that we face currently, at least as long as there is no measurement technique available that is capable of measuring visceral fat accurately in the field. Similar problems exist when the hydration status and its change during activity is to be assessed. Turnover of total body water is complex and no measurement is valid for all situations. Validated laboratory methods exist for total body water, but no evidence incontrovertibly demonstrates that any concentration measurement can accurately represent total body water gain and loss during daily activities. Techniques that assess hydration in real time and are precise, accurate, reliable, non-invasive, portable, inexpensive, safe and simple are lacking.66
Acknowledgments
The author would like to thank all athletes and coaches for participating in the preceding projects and the IOC, the FIS and the Austrian Research Funds FWF (15130 Med, 14388 Tec) for their support. The author would also like to thank the athletes and coaches for the excellent cooperation and their support, which led to the FIS rule changes. Thanks also go to T DeVaney, A Fürhapter-Rieger, M Horn, P Rosmann and T Zarfl, who have contributed to the preparation of this manuscript.
REFERENCES
Footnotes
Competing interests None.
Provenance and Peer review Commissioned; not externally peer reviewed.