Article Text

Statistics from Altmetric.com
Introduction
More and more sports medicine clinicians are taking an active approach to prevent injury and illness within their team.1–3 The first steps in developing a risk management plan are risk estimation and assessment.4–7 In this phase, the main questions are: what injuries can we expect? Or illnesses? And which are the most serious? Another question is: when is injury risk the greatest? The purpose is to identify which problems need to be focused on in a risk management plan in order to mitigate risk.
These questions can be answered by establishing injury surveillance within the team or by reviewing data from epidemiological studies on teams from a similar level.6 7 However, as a practitioner, you need to know how to interpret such data, whether they are your own or from others.8
The need for precise language to describe the extent of the problem: incidence, severity or burden?
A number of consensus statements have been published to encourage consistency in how injuries are defined and reported in epidemiological studies, initially on cricket (2005, updated in 2016),9 10 followed by football (2006)11 and several other sports such as rugby (2007),12 tennis (2009),13 athletics (2014)14 and aquatic sports (2016).15 In general, these recommend that the rate of injury should be reported as injury incidence, calculated as number of injuries per 1000 hours of exposure. This recommendation has since been followed by the vast majority of surveillance studies, and incidence is typically also the main outcome used to compare sports, genders, age groups and so on. However, we argue that focusing on injury/illness incidence alone may give an incomplete and even erroneous picture of risk.
It should be noted that the consensus statements also recommend that injury severity be reported, generally as the number of days from the date of injury to the date of the player’s return to full participation. This is a useful measure but it can be made even more useful.
In the following, we will use three examples to help guide the clinician in how to better interpret data from injury surveillance studies in a risk management setting. We will argue that it is time to move beyond reporting and assessing rate (incidence) and severity (duration of time loss) in isolation, and rather combine the two into the concept of ‘injury burden’—the cross-product of severity and incidence. This concept is not new, but originated in the occupational health and safety setting in the mid-1900s and was later applied to football injuries by Drawer and Fuller.16 Injury burden has subsequently been applied to rugby in numerous publications on injury epidemiology,17–25 including the annual reports from the England Professional Rugby Injury Surveillance Project since 2002.26 Routinely reporting injury burden would bring the rest of sports medicine into line with other areas of healthcare research where burden of illness combines the rate of disease (incidence) and a measure of loss. The best known are quality-adjusted life years or disability-adjusted life years,27 but we will focus on sport. Interestingly, none of the consensus statements9–15 include any mention of or recommendations for the reporting of injury burden.
Example 1: which injury types should the team focus on reducing?
Injury data can be illustrated by a risk matrix that highlights risks in terms of likelihood (incidence) and consequences (severity). A risk matrix is a powerful tool for risk assessment, as first applied to sports injuries by Drawer and Fuller in 2002.4 16 The example shown in figure 1 is derived from professional football at the UEFA Champions League level and shows the incidence and severity in terms of days lost from training and competition for each of the most common types of time-loss injuries. The shading illustrates relative importance of each of the injury types; the darker the colour, the greater the injury burden, and the greater the priority should be given to prevention. Low incidence, high severity injuries and high incidence, low severity injuries can thus yield the same injury burden.7

Quantitative risk matrix in UEFA Champions League football (based on data from the UEFA Elite Club Injury Study), illustrating the relationship between the severity (consequence) and incidence (likelihood) of the 14 most commonly reported injury types. For each injury type, severity is shown as the average number of days lost from training and competition (log scale), while incidence is shown as the number of injuries per 1000 hours of total exposure (match and training combined) for each injury type. Please note that the colour shading is conceptual; because of the log scale on the severity axis, the shading does not match the relative importance of each of the injury types exactly. MCL, medial collateral ligament.
The risk matrix suggests that injury reductions in the areas of hamstring, groin, knee and ankle injuries are priorities, while for example concussions represent less of a health burden. If focus were on injury incidence alone, neglecting severity, the picture would be incomplete.
This approach has some limitations that should be kept in mind. First, the risk matrix will usually differ substantially between sports and may also vary between different levels, genders and age groups within the same sport. Second, as noted by Fortington et al,28 fatalities are typically not captured in sports injury/illness surveillance studies. The fact that there were no deaths in the study sample used in figure 1 does not mean that efforts to prevent sudden cardiac death in football, such as emergency preparations, supply of automated external defibrillators and resuscitation training, should be abandoned.29
Also, although using the number of days of time loss from sports as a measure of severity seems to be the default option in the sports setting,9 this approach has several limitations, of which we will highlight two. First, it does not capture consequences beyond those directly related to sports participation, such as later disability (eg, due to osteoarthritis after an ACL injury) or medical or societal costs,30 as discussed in the consensus statement on aquatic sports.15 Second, it does not capture injuries where there is no time loss, but that may still limit athlete performance significantly, which is often the case for overuse injuries.31–33 An approach to address this limitation is illustrated in example 3.
Example 2: when is injury risk greatest?
There are limited data from football comparing the risk of injury in the various phases of the season, the preseason to the competitive season and the postseason playoffs, or the various stages of major tournaments. A recent study from Norwegian professional football did not find any difference in the incidence of acute or overuse injuries between the preseason and the competitive season,34 while previous studies have shown conflicting results.35 36
Injury burden can be quantified based on traditional time-loss injury surveillance data as the total number of days lost to injury per 1000 hours of exposure (training, match play or combined). Figure 2 compares the incidence and burden of injuries during training and match play for three stages of the European football championships (Euro 2016). When incidence is considered alone, the impression is that there is a gradual fall in injury risk from the preparatory stage through the group stage and the final, eliminatory phase, at least during match play. However, when injury burden is considered as the measure of risk, it becomes clear that the impact on the team increases gradually and is greatest during the final stage. The explanation is probably simple, that most injuries in the preparatory phase are minor; teams allow players with lesser complaints to rest for one or two sessions to have them fresh at the start of the tournament.
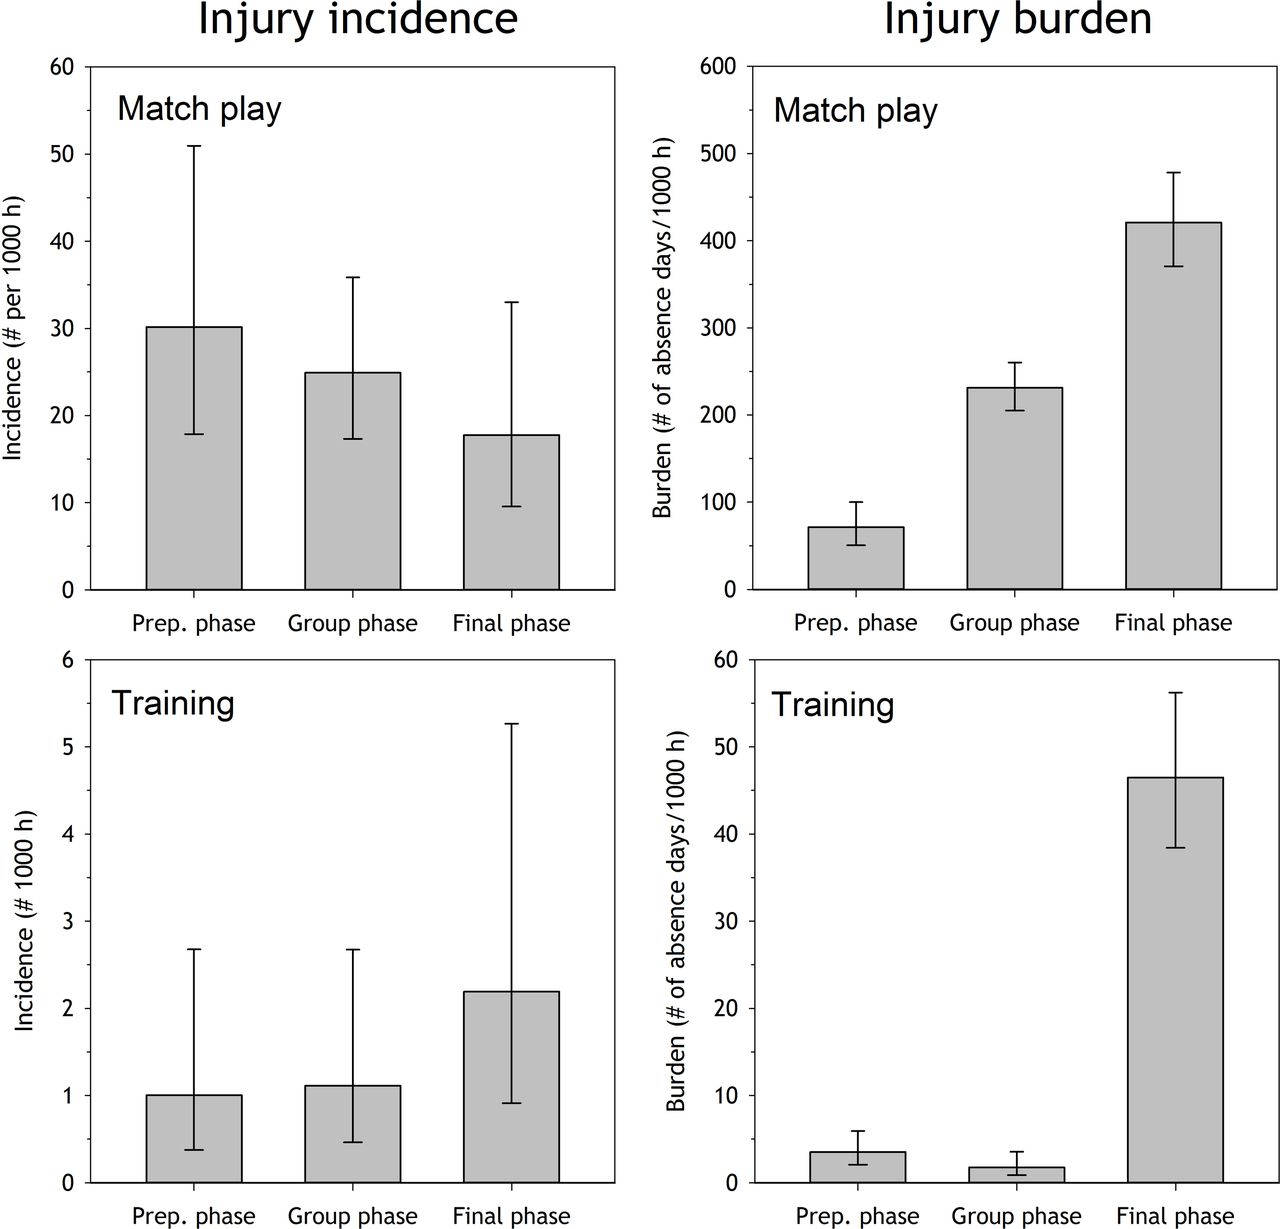
Injury incidence (number of injuries per 1000 hours of player exposure) and injury burden (number of days lost to injury per 1000 hours of player exposure injuries) during match play and training during three stages of the European football championships (Euro 2016), the preparation period, the group phase and the final phase.
Example 3: assessing the impact of acute injuries versus overuse injuries versus illness
The recommendations on how to report data from injury epidemiology studies have been widely accepted. However, as noted above, using time loss from sport alone to define injury and measure injury severity may substantially underestimate the true burden of injuries, especially overuse injuries. Athletes often continue to train and compete despite the presence of overuse conditions, at least in the early phase. The same is the case for many illnesses, such as the common cold. Therefore, many health problems do not lead to time loss from sport and are therefore not recorded in standard injury surveillance systems. To address this limitation, Clarsen et al 37 have developed the Oslo Sports Trauma Research Centre (OSTRC) Questionnaire on Health Problems for prospective monitoring of all illness and injury, not just those leading to time loss from sports participation.
However, even when using a more sensitive tool to capture all health problems, again the risk assessment may be skewed if it is based on incidence alone. As illustrated in figure 3, which represents data from the Norwegian Olympic and Paralympic teams preparing for the 2014 Sochi games, it seems as the main problem for both the alpine skiing team and the sledge hockey team may be illnesses, followed by overuse injuries, and with acute injuries representing a minor problem in both sports. However, when burden is considered, the picture changes completely. It becomes clear that acute injuries represented the greatest problem in alpine skiing, while overuse injuries were as much of a problem as illnesses in the sledge hockey team.

Injury incidence (number of injuries per athlete per year) and injury burden (arbitrary units) for the Norwegian Olympic alpine skiing team (top panels) and Paralympic sledge hockey team (bottom panels) during the 56-week period prior to the Sochi games.
It should be noted that because overuse injuries are often chronic or recurring and commonly do not lead to time loss, they are most appropriately expressed in terms of the prevalence of injury31 and it is necessary to use alternative means of determining injury severity and burden (see box 1).
Making the case for burden as a step forward
Using three examples, we have highlighted the pitfall of solely considering incidence to describe the consequences of injuries, showing that injury incidence alone provides an incomplete and sometimes even erroneous picture. For the practitioner wishing to undertake a thorough risk assessment, it is important to also consider the total burden of injury and illness. This can be done by developing a risk matrix as demonstrated in figure 1 and by calculating the total number of days lost to injury or illness for other comparisons, as also illustrated by the extensive data published on rugby injuries.17–26
We are not suggesting abandoning the separate reporting of incidence and severity. However, we do suggest that the current recommendations on how researchers should report data from epidemiological studies should be reviewed. They should also include data on injury burden, for example, reported as the total number of days lost per 1000 hours of exposure.17–26
How the data were collected
UEFA Elite Club Injury Study
The UEFA Elite Club Injury Study (ECIS) is based on an ongoing surveillance programme where 46 elite football teams from 20 European countries have been followed from 2001 to 2017.23–26 The injury data are collected in line with the consensus statement on injury definitions and data collection procedures in studies of football (soccer) injuries,11 and the general methodology has been reported elsewhere.27 An injury is defined as any physical complaint sustained by a player that results from a football match or football training and leads to the player being unable to take full part in future football training or match play (ie, a time-loss injury). Players are considered injured until the club medical staff allowed full participation in training and availability for match selection. A member of the medical staff registers individual player exposure (in minutes) for all training sessions and matches. Injury and attendance reports are sent to the study group once a month. Reports are checked, on receipt, by the study group and prompt feedback sent to the teams in order to correct any missing or unclear data. Each injury is coded according to a modified version of the Orchard Sports Injury Classification System V.2.0.9. Injury incidence is calculated as the number of injuries per 1000 hours of exposure, injury severity as the number of absence days and injury burden as the number of injury days lost per 1000 hours of exposure.38–42
Euro 2016 study
The data were collected from the 24 teams who qualified for Euro 2016, with complete data from all but one team. Each squad comprised 23 players; 529 players were followed from 1 June to 10 July, dividing the study period into three stages: the preparation period (10 days: 1 to 9 June, friendly matches), the group stage (10 to 22 June, three matches per team) and the final, knockout phase (23 June to 10 July). Data collection followed the methodology previously described above for the ECIS study.
Norwegian Olympic and Paralympic team study
The data were collected from 198 Norwegian Olympic and Paralympic candidate athletes from 13 different sports in the 56 weeks prior to the 2016 Sochi Olympic Games. During this period, athletes were sent the OSTRC Questionnaire on Health Problems once per week. Each time a problem was reported, a severity score from 0 to 100 was assigned to it based on the degree of symptoms and its consequences on sports participation, training volume and performance.43 44 The relative burden of overuse injury, acute injury and illness was calculated in the various sporting teams using cumulative severity scores adjusted for the number of athletes in each team and the questionnaire response rate.29 Incidence data were calculated using the number of new cases per athlete per year.
Acknowledgments
The authors thank Evert Verhagen for valuable comments to this paper. The Football Research Group was established in Linköping, Sweden, in cooperation with Linköping University.
References
Footnotes
Contributors RB, BC and JE: each wrote sections of the initial draft of the article, which were then discussed and refined by all authors.
Funding The Oslo Sports Trauma Research Center has been established through generous grants from the Eastern Norway Regional Health Authority, the International Olympic Committee, the Royal Norwegian Ministry of Culture, Norsk Tipping AS and the Norwegian Olympic and Paralympic Committee & Confederation of Sport. The Football Research Group was established in Linköping, Sweden through grants from UEFA, the Swedish Football Association and the Swedish National Centre for Research in Sports.
Competing interests None declared.
Provenance and peer review Not commissioned; externally peer reviewed.
Correction notice The paper has been corrected since it was published Online First. This paper is a revision of article bjsports-2017-098160: the authors asked for the opportunity to expand their text and references in response to post publication feedback. The BJSM editors sent the revised version for additional peer review. The authors responded to those peer-review comments.