Article Text

Statistics from Altmetric.com
Cardiovascular-related sudden death is the leading cause of mortality in athletes during sport.1 The majority of disorders associated with increased risk of sudden cardiac death (SCD), such as cardiomyopathies and primary electrical diseases, are suggested by abnormal findings present on an ECG. ECG interpretation in athletes requires careful analysis to properly distinguish physiological changes related to athlete's heart from findings suggestive of an underlying pathological cardiac condition. Whether used for the diagnostic evaluation of cardiovascular-related symptoms, a family history of inheritable cardiac disease or SCD, or for screening of asymptomatic athletes, ECG interpretation is an important skill for physicians involved in the cardiovascular care of athletes.
The purpose of this short report is to guide the clinician on the use of a two-page ECG criteria tool (Appendix, pages i7–i8 ). The science underpinning this instrument has been reported2 and demonstrates that providing standardised criteria to assist ECG interpretation in athletes significantly improves accuracy to distinguish normal from abnormal findings across physician specialties, even in physicians with little or no experience. The first page of the criteria tool consists of two tables. Table 1 lists each individual ECG criterion that should be considered abnormal, unrelated to athletic training, and warrants additional investigation for disorders predisposing to SCD. Table 2 lists the normal and physiological ECG changes commonly found in trained athletes that should not trigger additional testing. The second page of the tool (Appendix, page i8 ) displays several examples of uncommon ECG patterns.
Classifying ECGs as normal or abnormal
The goal of ECG interpretation in athletes is to classify the ECG as: (1) ‘normal’—no further evaluation needed or (2) ‘abnormal’—further evaluation needed. Normal ECGs include common, training-related findings in athletes such as high QRS amplitude meeting voltage criteria for left ventricular hypertrophy, early repolarisation, sinus bradycardia, sinus arrhythmia and 1° atrioventricular block. Abnormal findings are unrelated to regular training and also found in underlying pathological cardiac conditions. These include findings suggestive of cardiomyopathy such as T-wave inversion, ST depression, pathological Q-waves, left axis deviation and conduction delays and findings suggestive or diagnostic of primary electrical diseases such as long QT syndrome and Wolff-Parkinson-White syndrome.
The evaluation of abnormal ECG findings is ideally performed in consultation with a specialist with experience in athlete's heart and disorders associated with SCD in athletes. However, even if properly interpreted, ECG will not detect all conditions at risk for SCD. Further diagnostic testing often requires advanced cardiac imaging (echocardiography or cardiac magnetic resonance), ambulatory or exercise ECG monitoring, and less commonly genetic testing or electrophysiological study. Physicians may modify the ECG criteria or diagnostic testing based on past experience, practice setting or the presence or absence of concerning symptoms or family history.
An important step but what is next?
This practical tool (which may be reproduced unchanged with citation to the BJSM pages i7–i8 ) represents only a starting point to improve ECG interpretation in athletes. Physicians also may benefit by reviewing published guidelines outlining modern criteria for ECG interpretation in athletes.3–5 In addition, an international group of experts convened in Seattle in February 2012 to refine ECG interpretation criteria and develop an online training module for physicians around the world to gain a common foundation in ECG interpretation in athletes. This free online training course, co-sponsored by the American Medical Society for Sports Medicine and FIFA, will be hosted by BMJ Learning and will launch early in 2013. Until then, use of this instrument can provide physicians standardised criteria to assist them in interpreting an athlete's ECG.
Appendix
ECG Interpretation in Athletes
| Abnormal ECG finding | Definition |
|---|---|
| T wave inversion | >1 mm in depth from baseline in two or more adjacent leads not including aVR or V1 (1note exception below—figure 1) |
| ST segment depression | ≥1 mm in depth in two or more adjacent leads |
| Pathological Q waves | >3 mm in depth or >0.04 s in duration in two or more leads |
| Complete left bundle branch block | QRS >0.12 s, predominantly negative QRS complex in lead V1 (QS or rS), and upright monophasic R wave in leads I and V6 (figure 2) |
| Complete right bundle branch block | QRS >0.12 s, terminal R wave in lead V1 (rsR′), and wide terminal S wave in leads I and V6 (figure 3) |
| Intraventricular conduction delay | Non-specific, QRS >0.12 s |
| Left atrial enlargement | Prolonged P wave duration of >0.12 s in leads I or II with negative portion of the P wave ≥1 mm in depth and ≥0.04 s in duration in lead V1 |
| Left axis deviation | −30° to −90° |
| Right atrial enlargement | High/pointed P wave ≥2.5 mm in leads II and III or V1 |
| Right ventricular hypertrophy | Right axis deviation ≥120°, tall R wave in V1+persistent precordial S waves (R-V1+S−V5>10.5 mm) |
| Mobitz type II 2° AV block | Intermittently non-conducted P waves not preceded by PR prolongation and not followed by PR shortening |
| 3° AV block | Complete heart block |
| Ventricular pre-excitation | PR interval <0.12 s with a delta wave (slurred upstroke in the QRS complex—figure 4) |
| Long QT interval | QTc ≥0.47 s (99% males) QTc ≥0.48 s (99% females) QTc ≥0.50 s (unequivocal LQTS; figure 5) |
| Short QT interval | QTc ≤0.34 s |
| Brugada-like ECG pattern | High take-off and downsloping ST segment elevation in V1−V3 (figure 6) |
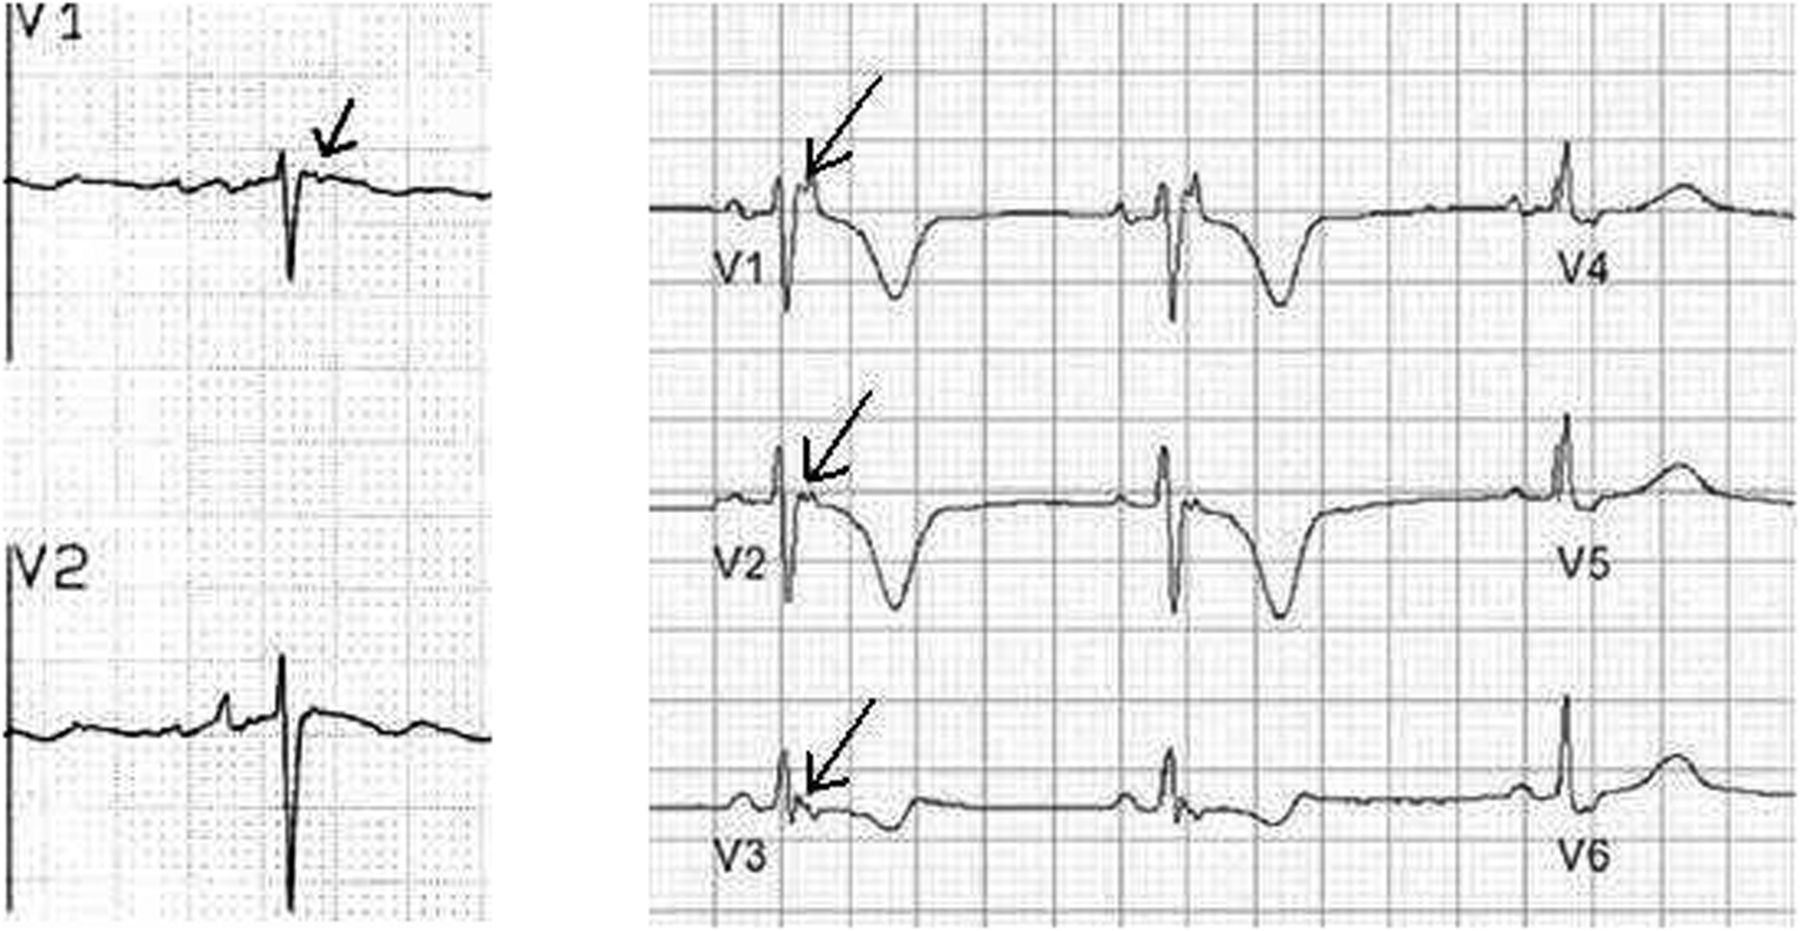
| Epsilon wave | Small negative deflection just beyond the QRS in V1 or V2 (figure 7) |
| Profound sinus bradycardia | <30 BPM or sinus pauses ≥3 s |
| Atrial tachyarrhythmias | Supraventricular tachycardia, atrioventricular nodal reentrant tachycardia, atrial-fibrillation and atrial-flutter |
| Premature ventricular contractions | ≥2 per tracing |
| Ventricular arrhythmias | Couplets, triplets and non-sustained ventricular tachycardia |
1Note: Exception to T wave inversion: elevated ST-segment with an upward (‘domed’) convexity, followed by a negative T-wave in V2 – V4 is a common pattern of early repolarisation seen in athletes of African-Caribbean descent and should be considered normal (figure 1). This should not to be confused with the downsloping ST segment elevation in V1 – V3 found in a Brugada-like ECG pattern which is abnormal (figure 6).
AV, atrioventricular.
Abnormal ECG criteria in Athletes
Any abnormal finding is considered training-unrelated and suggests the possibility of underlying pathological cardiac disease, requiring further diagnostic work-up.
| Sinus bradycardia | First degree AV block | Early repolarisation |
|---|---|---|
| Sinus arrhythmia | Incomplete RBBB | Isolated QRS voltage criteria for left ventricular hypertrophy2 |
2Note: Isolated increases in QRS amplitude are common in trained athletes. However, QRS voltage criteria for LVH+any non-voltage criteria for LVH (such as atrial enlargement, left axis deviation, a ‘strain’ pattern of repolarisation, ST-segment depression, T-wave inversion or pathological Q waves) is abnormal and requires further evaluation.
LVH, left ventricular hypertrophy; RBBB, right bundle branch block.
Common ECG findings in athletes
Training-related ECG alterations are common, physiological adaptations to regular exercise and are considered normal variants in athletes.
[ECG criteria based on: Corrado D, Pelliccia A, Heidbuchel H, et al. Recommendations for interpretation of 12-lead electrocardiogram in the athlete. Eur Heart J 2010;31:243–59]

Normal variant of T wave inversion in athletes of African-Caribbean descent.
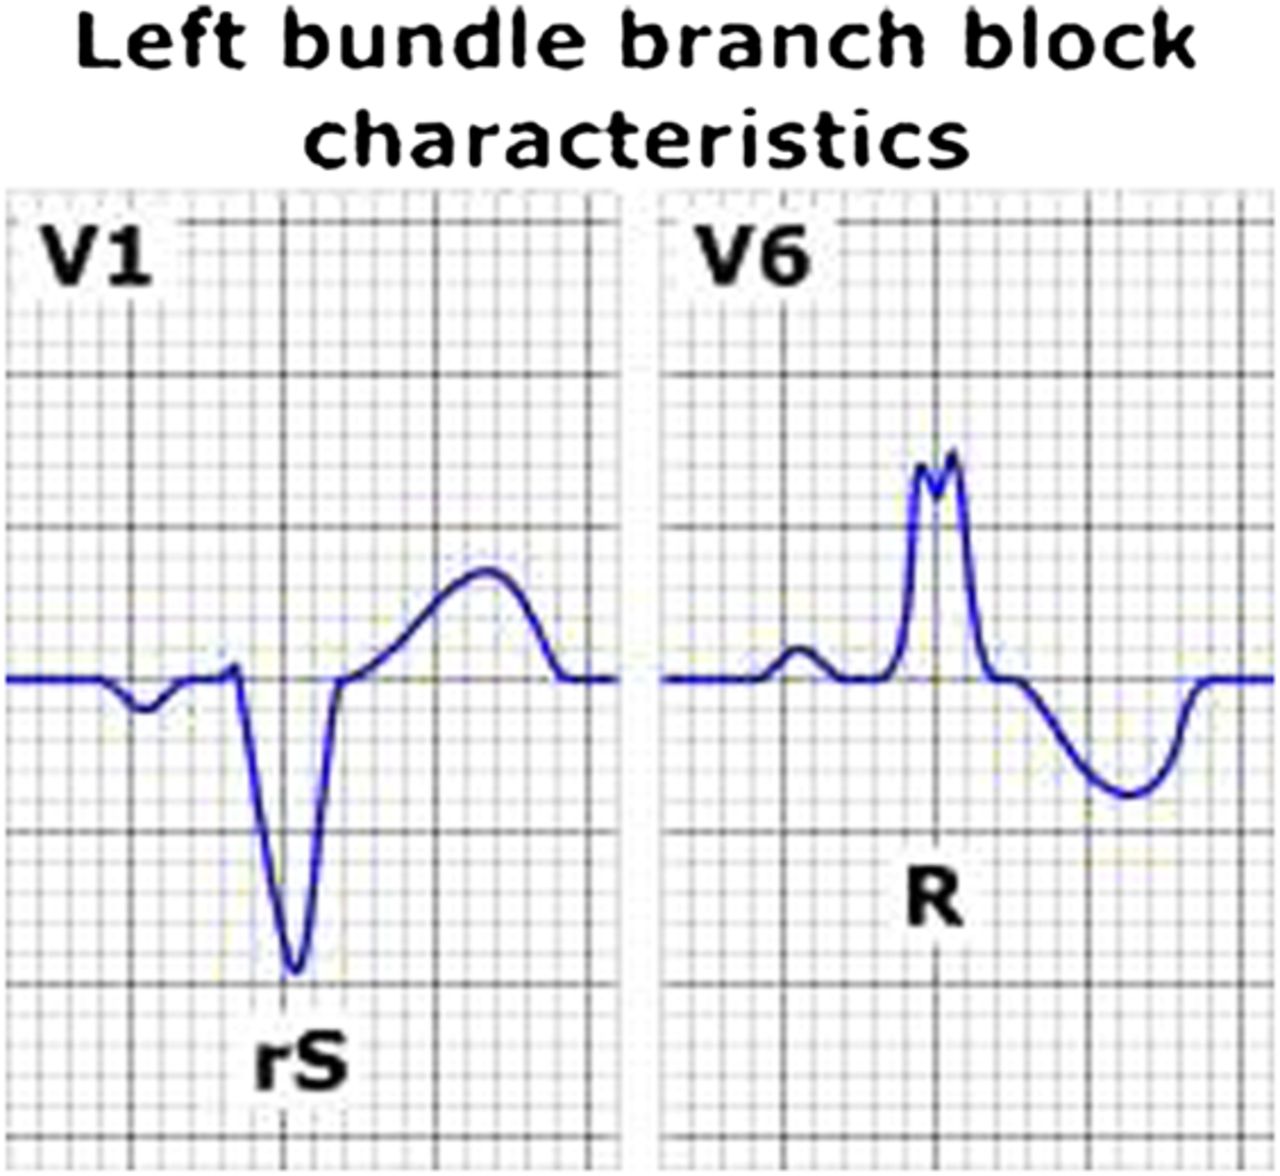
Left bundle branch block: QRS >0.12 s, predominantly negative QRS complex in lead V1 (QS or rS), and upright monophasic R wave in leads I and V6.

Right bundle branch block: QRS >0.12 s, terminal R wave in lead V1 (rsR′), and wide terminal S wave in leads I and V6.

Delta wave: suggestive of ventricular pre-excitation; PR interval <0.12 s with or without a delta wave (slurred upstroke in the QRS complex).

QTc interval: LONG QT: QTc ≥0.47 s (99% males) or QTc ≥0.48 s (99% females). (QTc ≥0.50 s (unequivocal LQTS)).
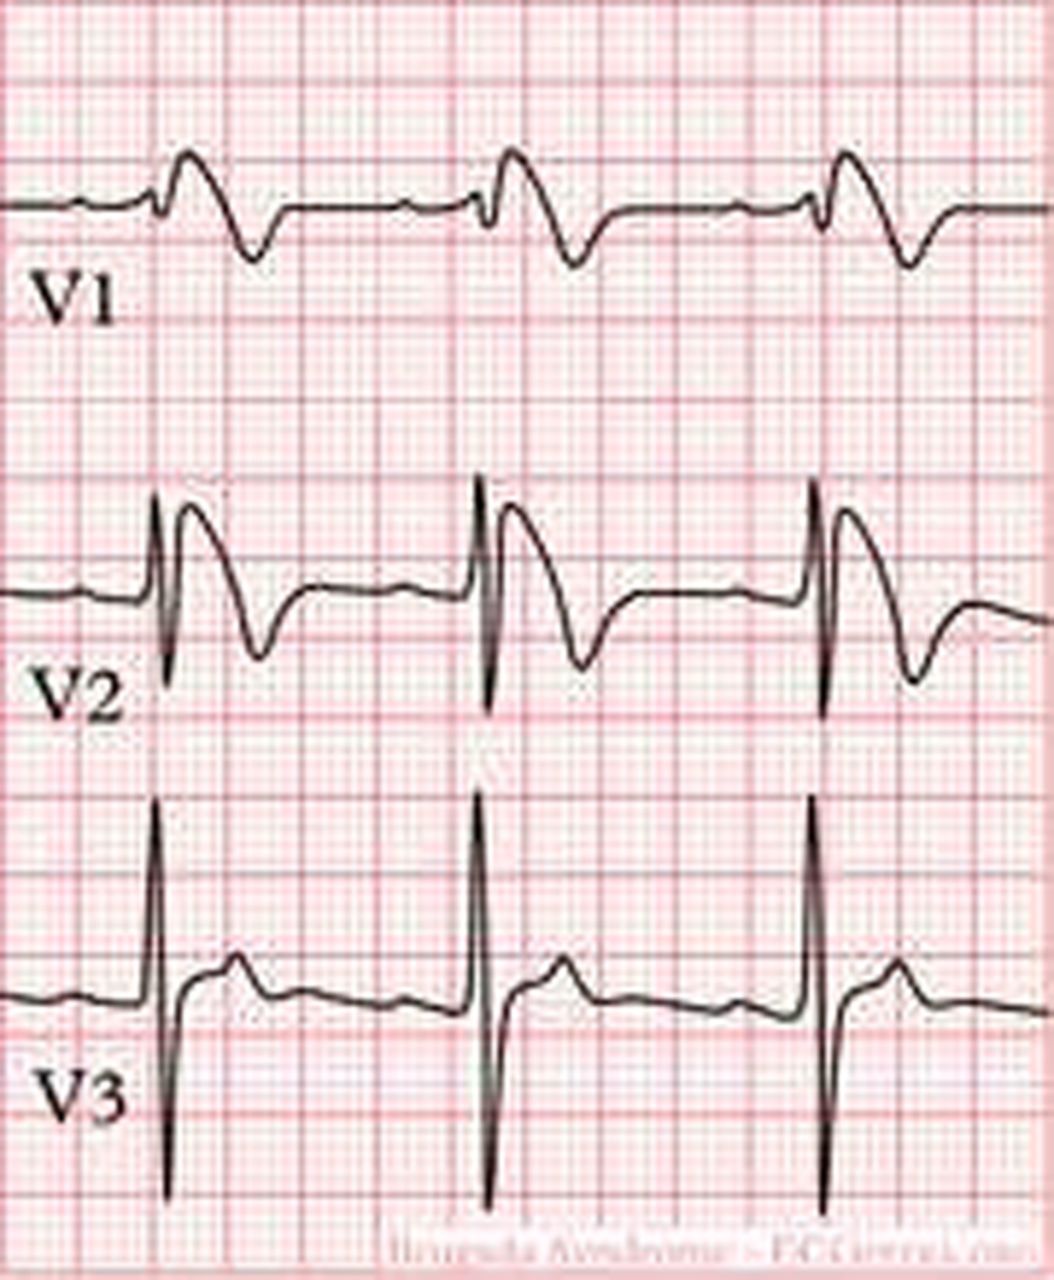
Brugada ECG: high take-off and downsloping ST segment elevation in V1 – V3.

Epsilon wave: small negative deflection just beyond the QRS in V1 or V2.
Footnotes
-
▸ Additional data are published online only. To view this file please visit the journal online (http://dx.doi.org/ 10.1136/bjsports-2012-091703)
-
Competing interests None.
-
Provenance and peer review Commissioned; internally peer reviewed.