Article Text

Statistics from Altmetric.com
Aim
The aim of this paper is to give a “medical” viewpoint on sports injury data collection and analysis, and to emphasise the importance of epidemiological sports data collection with regard to incidence rates and exposure risk hours and highlight the need for uniform definitions within and across sport. It is designed not as a statistical or epidemiological paper but as a resource to be used by those involved in sports injury research so that they may confidently analyse, evaluate, and compare existing research and to enable them to collect accurate sports injury data in their own field.
Introduction
Scientifically, it is not sound to rely on case reports to indicate injury patterns in sport, and yet it is common practice. It is always problematical to compare injury statistics across sports because of the added factors of the number of people involved, the time played, and variable injury definition. Increasingly, sports injury data are reported as incidence rates—for example, injuries per 1000 hours played—that is, using numerator and denominator data—as this methodology takes account of the exposure time at risk.
Sports injuries occur when athletes are exposed to their given sport and they occur under specific conditions, at a known time and place.
The last point should relate to time missed in training days as well as competitive participation and may also consider time lost to work in the case of a semiprofessional athlete. The knowledge gained from asking these questions may help us to predict and thus prevent injury.
In sports medicine, we are thus all epidemiologists “concerned with quantifying injury occurrence with respect to who is affected by injury, where and when injuries occur and what is their outcome—for the purposes of explaining why and how injuries occur and identifying strategies to control and prevent them”.1
To interpret the literature, we must be able to discern good studies from bad, to verify whether conclusions of a particular study are valid, and to understand the limitations of a study.2 Many studies are limited because the data collection is for injured athletes alone or risk factors alone, which does not allow the use of the epidemiological concept of athletes being at risk. There is no common operational definition of sports injury in existence at present and furthermore no set definition of severity. Some studies classify a severe injury as one that results in five games being missed, whereas others classify a severe injury as one that requires five weeks out of competition to heal; these clearly are not compatible for comparisons of sports for which more than one game is played each week.3,4 There is currently no set format for data collection across sports, and the size of the samples vary: some studies refer to only one team and others use multiple teams.3,5–7 Therefore methodological factors alter the perception and interpretation of incidence rates.
When examining sports injury data the questions typically asked are:
-
is there a greater risk in one certain sport?
-
is there a common site and type of injury in a given sport?
-
who is at most risk in a team sport?
-
what is the participation time missed as the result of that specific injury?
Rates
The fundamental unit of measurement is rate. To calculate a valid injury rate, the number of injuries experienced (numerator data) is linked to a suitable denominator measure of the amount of athletic exposure to the risk of injury. Thus a rate consists of a denominator and a numerator over a period of time. Denominator data can be a number of different things; they could be the number of athletes in a club or team, the number of games played, the number of minutes played, or the number of player appearances. The choice of the denominator affects the numerical value of the derived data and also their interpretation. For example, injuries can be expressed as the number of injuries per game, an injury every so many minutes of play, or the number of injuries per (x) player appearances.8
Incidence rates
Incidence is the most basic expression of risk. Incidence rates pertain to the number of new injuries that occur in a population at risk over a specified time period or the number of new injuries during a period divided by the total number of sportspeople at that period. Thus the epidemiological concept of athletic exposure in games or training is multiplied by the number of players participating. Incidence rates that do not consider exposure do not reliably indicate the problem and cannot be used to compare injury incidence.
Determining incidence rates
Accurate and consistent medical diagnosis is imperative. Diagnoses may be made by the doctor or physiotherapist but must be consistent throughout, with the use of set codes for site, nature, and severity of injury. All injuries should be recorded, including transient injuries—that is, those that require medical attention but result in no time lost to training or playing. Time lost from participation must be recorded accurately, using both training and game/competitive participation data, in days lost as well as games and weeks lost. Many studies exclude training injuries and training time lost, using only those injuries that occur in a game or that require a competitive game to be missed.3,9 These studies lose valuable data and fail to portray the true injury picture of the sport. If training information is excluded, then the data only represent the tip of the iceberg—submerged missed data may include the effects of training injuries or, more importantly, the training time lost on the player, his/her fitness, and ultimately his/her career. The same argument can be used to show the importance of including transient injuries in the data analysis. Excluding these injuries gives a false picture of the injuries sustained in a given sport.
Coding of injury diagnosis
Coding and recording of injuries should be through the consistent use of a set of established definitions of injury, which are expansive and descriptive to avoid subjectivity. Standard classifications of diagnoses are in existence such as the International Classification of Diseases; however, these are often not specific enough and thus not of any use for sports injury data collection. In contrast, there is the Orchard Codes system, which is very descriptive and expansive and may be used in this type of research. A single person should record the information where possible to achieve greatest intra-rater reliability. Time lost from sport participation must be considered an objective measure that is not sensitive to the concept of returning to play when the athlete is not fully healed and must always be referred to as a filter when conclusions on sports injury data are drawn. Athletes are often paid professionals and as such do not wish to miss a training or competitive/playing session, which could result in loss of their team place in the next game or their wage at the end of the week. Athletes are eager to participate and thus always challenge the healing process as they almost always aim to return to competition much sooner than the lay person.10 We do not have any reliable criteria on return to sport.
Study design
The US Preventative Services Task Force in 1989 established a hierarchy of evidence in which greater weight was given to study designs in decreasing order of importance.11 Random control trials were rated first; these expose some subjects, but not others, to an intervention—for example, risk of injury. Therefore this type of research is more clinical in nature and not typically appropriate for the study of injury patterns. Cohort studies were rated next; this type of study monitors both injured and non-injured athletes, thereby providing results on the effects of participation, and are ideally prospective in nature. Case-control was the third type of study, monitoring only those athletes who suffered an injury and are typically more retrospective in nature. These make up the vast majority of sports injury studies at present; however, we should recognise that multiple anecdotes do not add up to an evidence base.
Weaknesses in sports injury epidemiology research
-
Retrospective data are used which may lead to bias.
-
Multiple injury recorders leading to a lower inter-rater reliability.
-
Single or part season's data analysed.
-
Single team analysed.
-
Injury cases documented are not adjusted for exposure risk hours of training or playing.
-
Comparisons made with other studies that have not used the same injury coding or methodology (may not even be of the same sport).
Studies should have validity and reliability. The former is defined as the extent to which you measure what you intended to measure and is usually compared against a yardstick. Sports injury incidence at present has no yardstick against which comparisons can be made. Reliability is the ability to produce the same results on more than one occasion and is dependent on inter-rater or intra-rater data collection. For accurate injury incidence, reliability is imperative.12
Sample size influences results. It is impossible to compare studies in which various sample sizes—that is, one team or many—have been used, unless adjustments for exposure have been made and this is clearly stated in the methods. Studies on one particular sports team, however, can be powerful if the number of injuries incurred is large enough to show statistical significance.13
The type of statistical analysis is directly related to the methodology of the study. For example, the χ2 test can be used to assess the differences between observed and expected injuries in a season or number of seasons. Multiple regression and multiple variate analyses may be chosen to assess the influence of independent factors on the injuries incurred—for example, the player position or the hardness of the ground. The calculation of incidence rates has been identified as a critical feature of sound epidemiological sports injury studies.14
As a footnote, it should be mentioned that any patient injury information collected must always be confidential.
Exposure risk hours and rates per 1000 hours
The way in which incidence is expressed has also been shown to affect the calculation/interpretation of incidence rates. Increasingly, incidence rates in all sports are being expressed as rates per 1000 hours. This is a good approach and allows some comparison across sports. However, a further refinement of the calculation of incidence rates is to measure the actual exposure time at risk. Thus expected injuries are calculated using player exposure/risk hours. These risk hours should ideally include training time as well as competitive participation.13,15
The following is an example of how exposure/risk hours are calculated in a team sport, specifically rugby league. There are 13 players of one team on the field at any one time. The duration of the game is 80 minutes (1.33 hours). Thus there are 17.33 player exposure/risk hours per team per game of rugby league (13 × 1.33). Over an average season—for example, 30 games—there may be 520 player exposure/risk hours (13 × 1.33 × 30).
To calculate the incidence in relation to these exposure hours, the total number of injuries recorded over a period is divided by the total exposure for that period, and the result multiplied by 1000 to obtain the rate per 1000 hours. This period could be one game, several games, or a whole season or number of seasons. To see if there are significant differences across games or seasons, observed and expected injuries can be used. Observed injuries are those recorded over the period under consideration. Expected injuries are calculated by dividing the total injuries—for example, over four seasons—by the total exposure—for example, for the same four seasons—and multiplying the result by the exposure for the period under consideration—for example, one season only—giving an expected injury case for that one season. Significance tests may then be applied.
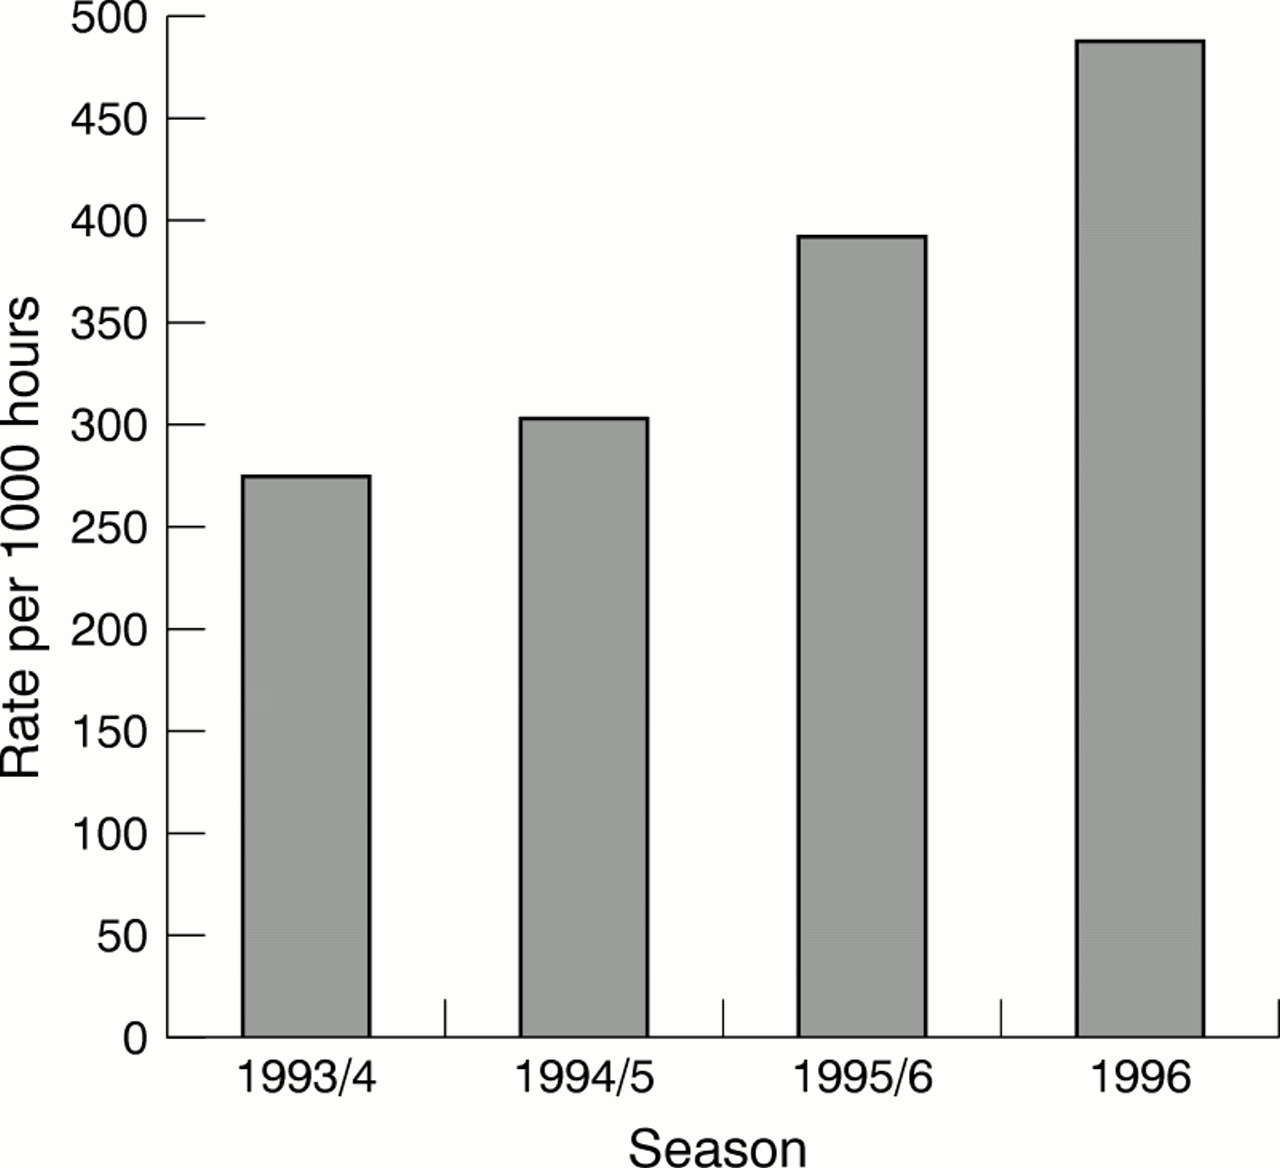
The relevance of recording and analysing data in this way is shown below taking data from a previous study.13 Figure 1 shows the number of injury cases recorded over four rugby league seasons at one British professional rugby league club (1993–1996 inclusive). On initial observation, there does not appear to be a significant difference across the four seasons, and the observer may even say that the injuries were in fact lower over the last two seasons. However, in fig 2, which is for the same four seasons but the data are adjusted for exposure/risk hours and presented as rates per 1000 hours, the true picture is disclosed. An obvious increase in injury incidence is seen. In truth, in the 1996 season, the incidence of injury was almost double that of the first season recorded (1993/1994). Excluding exposure time at risk prevents the true picture from being seen. This can be highlighted by the fact that, during the 1993/1994 season, there were 35 games played (605.15 exposure hours) and in 1996 only 21 games were played (363.09 exposure hours); however, observe the difference in injury incidence again. Not adjusting for exposure/risk hours but only commenting on total injury cases is a fatal flaw in sports injury data presentation.

Game injury statistics showing number of injury cases per season.

Game injury statistics showing rates per 1000 hours per season.
Strengths in sports injury epidemiology research
-
Using one recorder to diagnose and document injuries gives a high intra-rater reliability.
-
Incidence rates are used and adjusted for exposure.
-
Training injuries are included.
-
Time lost to competitive participation plus time lost to training and work also documented.
-
Prospective studies conducted using descriptive set injury coding definitions and methodology.
-
Filters recognised and referred to.
-
Comparisons made with similar studies but acknowledging the differences in diagnostic coding and definitions of severity.
-
Acknowledging where professional sport is compared with amateur sport.
-
Using more than one team where possible: improved generalisability.
If we apply the above to what we already know clinically, we may help to predict and prevent future injury occurrence. Thus accurate data collection could be essential in the prevention of injuries. If specific influences are identified as a contributing factor to the risk of injury and supported by scientific data collection, then the rules of the sport may be changed to prevent this happening again. This will have the effect of making our athletes as injury free as possible and may even help to lengthen their time in competitive participation.
Ideal study
-
Cohort design (injured and non-injured athletes observed).
-
Conducted over several teams.
-
Longitudinal prospective data collection.
-
One recorder where possible (high intra-rater reliability).
-
Uniformity of injury definition across sports.
-
Specific definitions of injury severity so comparisons between studies can be made accurately.
-
Exposure hours used to express incidence rates for competitive participation and training.
-
Acknowledgement of existing filters.
Acknowledgments
I would like to thank Dr Mark E Batt for his help and advice on preparing this paper.