Article Text

Abstract
Background Different diagnostic imaging modalities, such as ultrasonography (US), MRI, MR arthrography (MRA) are commonly used for the characterisation of rotator cuff (RC) disorders. Since the most recent systematic reviews on medical imaging, multiple diagnostic studies have been published, most using more advanced technological characteristics. The first objective was to perform a meta-analysis on the diagnostic accuracy of medical imaging for characterisation of RC disorders. Since US is used at the point of care in environments such as sports medicine, a secondary analysis assessed accuracy by radiologists and non-radiologists.
Methods A systematic search in three databases was conducted. Two raters performed data extraction and evaluation of risk of bias independently, and agreement was achieved by consensus. Hierarchical summary receiver-operating characteristic package was used to calculate pooled estimates of included diagnostic studies.
Results Diagnostic accuracy of US, MRI and MRA in the characterisation of full-thickness RC tears was high with overall estimates of sensitivity and specificity over 0.90. As for partial RC tears and tendinopathy, overall estimates of specificity were also high (>0.90), while sensitivity was lower (0.67–0.83). Diagnostic accuracy of US was similar whether a trained radiologist, sonographer or orthopaedist performed it.
Conclusions Our results show the diagnostic accuracy of US, MRI and MRA in the characterisation of full-thickness RC tears. Since full thickness tear constitutes a key consideration for surgical repair, this is an important characteristic when selecting an imaging modality for RC disorder. When considering accuracy, cost, and safety, US is the best option.
- Shoulder
- Ultrasound
- MRI
- Meta-analysis
This is an Open Access article distributed in accordance with the Creative Commons Attribution Non Commercial (CC BY-NC 4.0) license, which permits others to distribute, remix, adapt, build upon this work non-commercially, and license their derivative works on different terms, provided the original work is properly cited and the use is non-commercial. See: http://creativecommons.org/licenses/by-nc/4.0/
Statistics from Altmetric.com
Introduction
Shoulder pathology is common and associated with substantial functional limitations that increase with age.1 Disorders of the rotator cuff (RC) tendons constitute the most common group of pathologies of the shoulder.2 RC disorders are of multifactorial origin and may result in a progressive degeneration of the RC tendons.3 Knowledge of the integrity of the RC tendons in an episode of subacromial pain is an important factor to consider in treatment decision-making (surgical vs conservative management),4 and clinicians use a variety of diagnostic tests to detect RC disorders and to define the extent of damage. Medical imaging technologies, such as ultrasonography (US), MRI and MR arthrography (MRA) provide clinically useful information that can help establish the proper treatment plan.5
Several systematic reviews have been published on the diagnostic accuracy of medical imaging for the characterisation of RC disorders.5–11 However, since the publication of the last systematic reviews,5 ,10 ,11 more than 10 diagnostic studies, mostly with sound methodology, have been published, most of them using more advance technology and technique, such as devices with higher frequency transducers for US and higher field strength magnets for MRA and MRI. Also, a recent statistical package, the hierarchical summary receiver-operating characteristic (HSROC) has been proposed to optimise the realisation of meta-analyses on the accuracy of diagnostic tests.12 This statistical approach enables the calculation of pooled estimates of the sensitivity and specificity of a test and provides a mechanism to provide more precise estimates of the diagnostic accuracy of different imaging methods.
When new data are available, as it is currently, a meta-analysis is warranted to determine if these new data have an impact on the diagnostic accuracy of a given tool. Especially since technology and technique have been improving over the years for imaging modalities, and that a recent statistical package has been shown to optimise meta-analyses.
Another aspect of musculoskeletal imaging modalities that have changed recently is the increase use of US at the point of care in environments such as sport medicine.13 In fact, non-radiologists such as specialists in physical medicine, rheumatology, orthopaedic and family medicine are currently using US during physical examinations.14 However, given the user-dependent nature of US, health professionals must make sure that they possess the competence and training before using it. Therefore, a synthesis of the literature is also needed to determine if the diagnostic accuracy of US is similar when non-radiologists and radiologists use this technology.
The primary objective of this study was to perform a systematic review with a meta-analysis on the diagnostic accuracy of US, MRI and MRA for the characterisation of tendinopathy, partial thickness RC tears and full-thickness RC tears in individuals with shoulder pain. Secondary objectives were to compare the accuracy of these imaging modalities depending on the inclusion criteria of participants in the studies, as well as regarding the technological characteristics of the equipment used in the included studies. Finally, since US is used at the point of care, another secondary analysis was to assess the diagnostic accuracy by radiologists and non-radiologists.
Methods
The presentation of this systematic review follows recommendations of PRISMA.15
Search methods for eligible studies
Searches for eligible articles were conducted in Medline, Embase and CINHAL databases from their date of inception to December 2013 using the following search strategy:«Shoulder joint»[MeSH] OR « Shoulder impingement syndrome » OR « Subacromial impingement » OR «Rotator cuff»[MeSH] OR ((Bursitis[MeSH] OR Tendinopathy[MeSH]) AND shoulder) OR «Shoulder pain»[MeSH] OR Shoulder
AND« Diagnostic imaging »[MeSH] OR Ultrasound OR Ultrasono* OR Sonograph* OR MRI OR « magnetic resonance imaging » OR MRA OR « magnetic resonance arthrography »
AND«Sensitivity and specificity»[MeSH] OR «Diagnostic accuracy» OR «Diagnostic value» OR Accuracy OR Reliability OR « diagnostic efficiency»
This search strategy was adapted to each database. Reference lists of retrieved studies and previous systematic reviews were also searched to identify additional relevant publications.
Eligibility criteria
Articles were included if they met the following inclusion criteria: (1) included adult participants with shoulder pain; (2) used MRI, MRA or US as index test, and surgery (arthroscopy or open surgery) as reference standard; (3) reported on diagnostic accuracy of medical imaging for the characterisation of an RC disorder (tendinitis/tendinosis/tendinopathy (subacromial impingement syndrome), full or partial RC tears). For the purpose of this study, all imaging findings used in the selected studies to qualify RC abnormalities other than RC tears will be referred to as ‘tendinopathy’. For the meta-analysis, only articles that published a 2×2 table or included data that allowed the construction of a 2×2 table were included.
Data extraction and risk of bias evaluation
Data were extracted for participants’ characteristics, index test used including specific equipment's characteristics, reference standard (who administered the tests, time between the tests). Data on diagnostic accuracy were also extracted. A first reader extracted the data. A second reader then corroborated or completed it if data were missing.
The risk of bias was evaluated for each article with the QUADAS 2 (Quality Assessment Tool for Diagnostic Accuracy Studies) that evaluates four domains that may bias the results.16 The first one is Patient selection (participants recruited consecutively or selected randomly). Participants included in the study had to represent a large spectrum of conditions that included the target condition, but was not restrained to it. Thus, studies were scored as having a high risk of bias when only participants strongly suspected of having RC disorders were considered. The second domain relates to bias that could be introduced by the Index test (blinding when interpreting the index test, clear description of the diagnostic thresholds). The third domain refers to the Reference standard or ‘gold standard’ (as near as possible to perfect accuracy, interpreted without the results of the index test). The last domain is the Flow and timing (patient retention, time period between index test and reference standard). A study was scored as having a high risk of bias for this domain when the interval between the index test and the reference standard was more than 30 days.17 Two raters independently evaluated each article with the QUADAS 2. After the independent evaluation, the pair of raters met to discuss the article. Each specific domain was openly discussed to reach consensus. A preconcensus inter-rater agreement was calculated for each specific domain with the κ statistic.
Statistical analyses
Data were analysed with V.3.0.2 of the R statistical software (http://www.r-project.org/). The HSROC package was used to calculate overall pooled estimates of the included diagnostic studies by taking into account the between-study and within-study variability.12 This routine, based on Bayesian rules, estimates the overall sensitivity (Sn) and specificity (Sp) for a group of studies and produces a ROC curve with confidence and credible intervals. The classical confidence interval (CI) presumes that differences in Sn and Sp between studies are caused only by a statistical instability related to sampling or measurement errors. All estimates would turn around a unique value of Sn and a unique value of Sp. In reality, for a same technique, Sn and Sp may vary in time, with different populations, with different operators or any other relevant conditions that change the nature of the test. Across different conditions, Sn and Sp could fluctuate among a range of values that reflect a change in reality rather than a statistical instability. The credible intervals delimit how the reality of Sn and Sp could fluctuate for reasons other than sampling or measurement errors. In this context, the CI adds to the credible interval the uncertainty caused by the sampling and measurement errors. The credible interval lies within the CI. Heterogeneity was explored graphically with forest plot. Positive (LR+) and negative (LR−) likelihood ratios were calculated from the overall Sn and Sp.18 However, confidence and credible intervals could not be calculated for likelihood ratios.
Data on diagnostic accuracy of MRI, MRA and US were pooled for (1) full or partial RC tears, (2) full RC tears only, (3) partial RC tears only and (4) tendinopathy. Thereafter, for each of these categories, meta-analyses were performed for studies with a high risk of bias for the participant selection domain of the QUADAS 2 and studies with a low risk of bias on the same domain. Meta-analyses were also performed for equipment characteristics (US frequency ≤7.5 MHz or >7.5 MHz; MRI field strength ≤1.5 T or 3 T) and regarding the professionals who performed the index test (only for US studies since MRI and MRA are interpreted by radiologists in the included studies).
Results
Search results and selected articles
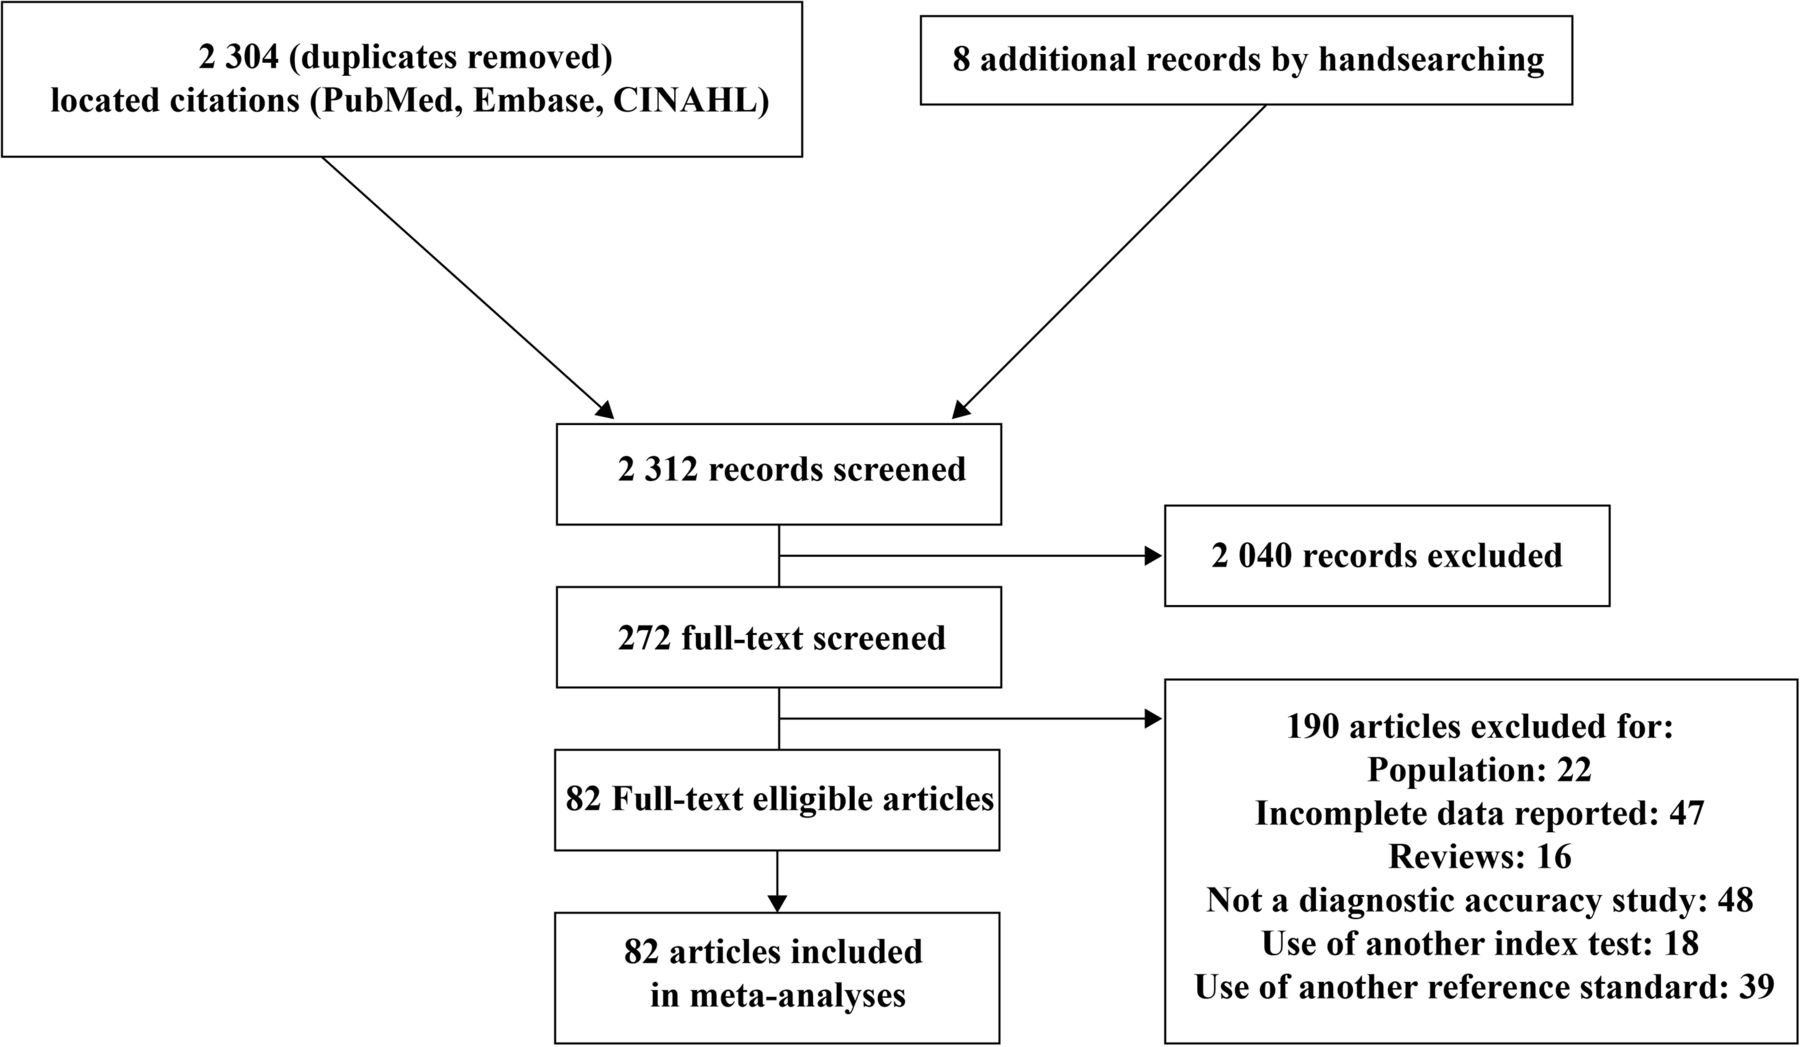
Searches resulted in 2304 citations (duplicates removed). Two evaluators screened the titles and abstracts for eligible articles. Two hundred and sixty-four articles were accepted for full review, while 2040 were excluded by consensus. In addition, eight articles were obtained from reference list of selected results and previous reviews, for a total of 272 articles eligible for full review. Of these articles, 82 reached eligibility for meta-analysis (47 for US, 29 for MRI and 21 for MRA; figure 1, see online supplementary appendix 1).

Flow diagram of the bibliographic search.
Risk of bias assessment of the included studies
For the risk of bias evaluation, the two raters were fairly concordant, with average κ inter-rater ranging from 0.33 to 0.64.
The evaluation of the risk of bias shows recurrent sources of bias on three of the four items of the QUADAS 2 tool (figure 2). The first item, participant selection, was rated as a high risk of bias in 61% of the studies; meaning that in most studies, a preselection of participants was made. The third item, related to the reference standard, has also been frequently rated as a high risk of bias given that the surgeons were often aware of the results of imaging tests before the surgery. Considering the invasive nature of the reference standard, this is understandable as it would have been unethical for surgeons to operate blindly as to the condition of the patient. The last item, flow and timing, has also often been evaluated as a high risk of bias. This is due to the fact that in most studies, the interval of time between the index test and the reference standard exceeded 30 days. The second item of the QUADAS was the one with the lowest risk of bias given that a clear description of the diagnostic threshold and of the standardised procedure for the index test was provided.
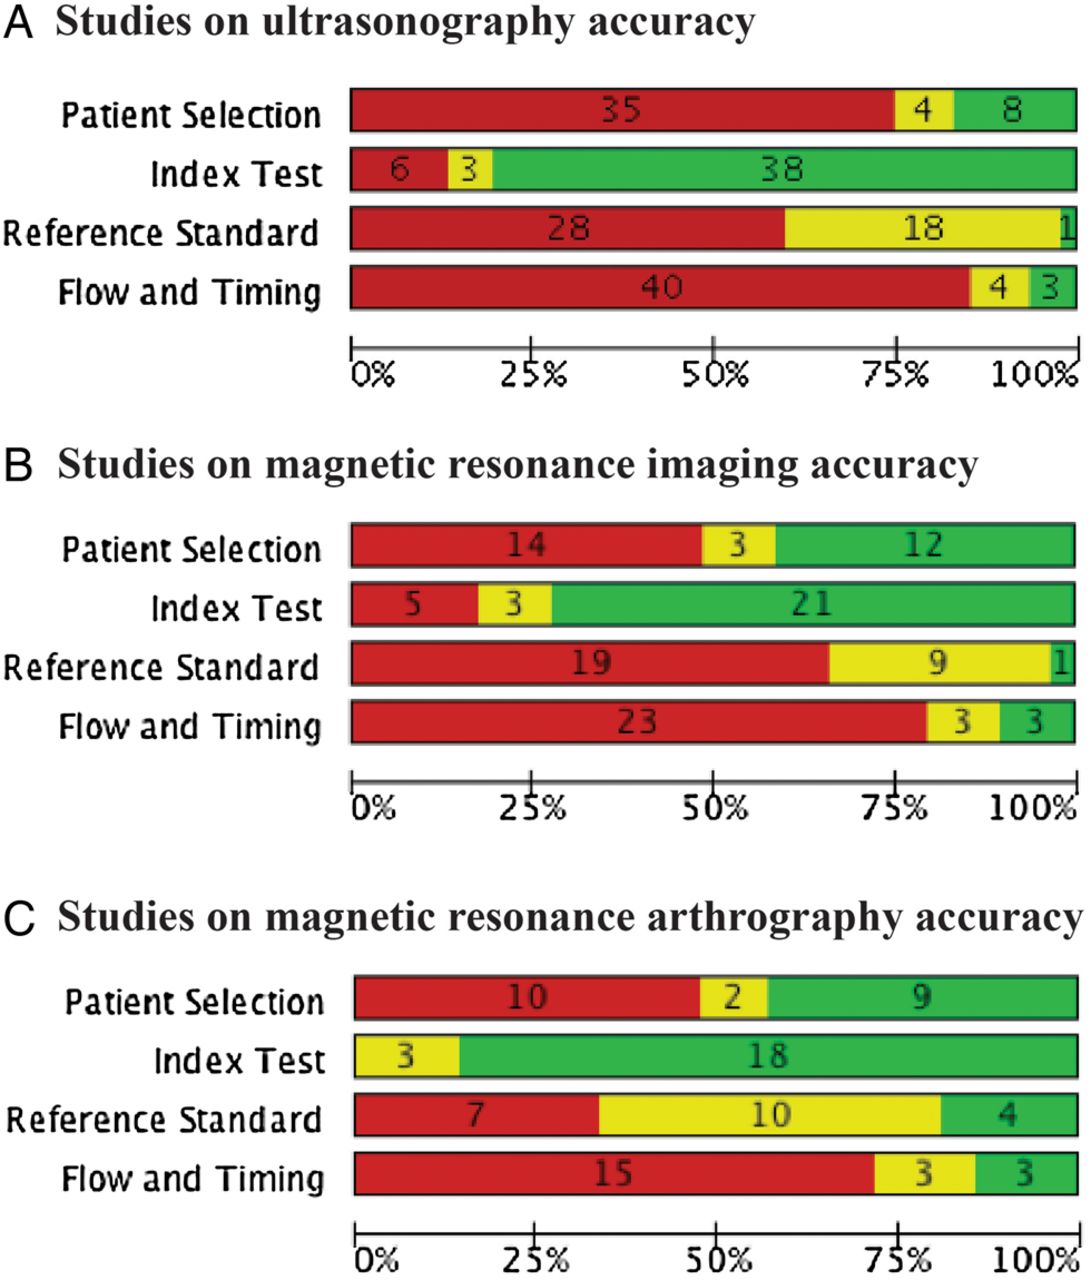
Risk of bias assessment of included studies using the QUADAS 2 tool. For the 3 imaging modalities (A–C), each bar shows the number and percentage of studies with a high (red), intermediate (yellow) and low (green) risk of bias for the 4 categories of QUADAS 2 tool.
Diagnostic accuracy of imaging modalities for any type of RC tears
Pooled data for all included studies
Results indicate an equivalent performance of the three imaging modalities (US, MRI and MRA) in the diagnosis of full or partial RC tears considered together (Sn: 0.90 to 0.91; Sp: 0.86 to 0.90; table 1A; figure 3). The credible intervals of the overall estimates of Sn and Sp of the MRA were larger than those of MRI and US, probably because of the smaller number of studies that evaluated MRA.
Overall Sn and Sp of US, MRI and MRA in the characterisation of full-thickness or partial-thickness RC tears

Accuracy of individual studies for ultrasonography, MRI and MR arthrography in characterisation of any tear. TP, true positive; FP, false positive; FN, false negative; TN, true negative; 95% CI, 95% confidence interval.
Secondary analysis based on the risk of bias in patient selection
The overall Sn of the group of studies with a high risk of bias in patient selection was substantially higher than the group of studies with a low risk for MRA (Sn: 0.93 and 0.83, respectively) and US (Sn: 0.93 and 0.76, respectively; table 1B). For MRA, the Sp analyses show that the group of studies with a high risk of bias has a substantially higher value compared to the low risk of bias studies (Sp: 0.95 and 0.73, respectively).
Secondary analysis regarding equipment characteristics
In most studies on the diagnostic accuracy of US, a transducer frequency equal or lower to 7.5 MHz was used, while 12 studies used a transducer frequency higher than 7.5 MHz (table 1C). The diagnostic accuracy based on the transducer frequency used was similar for the overall Sn or Sp.
In MRI studies, a 1.5 T or less density was mostly used, while two studies used a density of 3.0 T. Despite the wide credible intervals for the 3.0 T studies, overall Sn and Sp of both groups were similar. This was also true for MRA studies.
Secondary analysis regarding the specialist performing the US examination
The meta-analyses showed a similar diagnostic accuracy of US when the examination was performed by a trained radiologist or by other professionals (trained sonographers or orthopaedists; table 1D).
Diagnostic accuracy of imaging modalities for full-thickness RC tears
Pooled data for all included studies
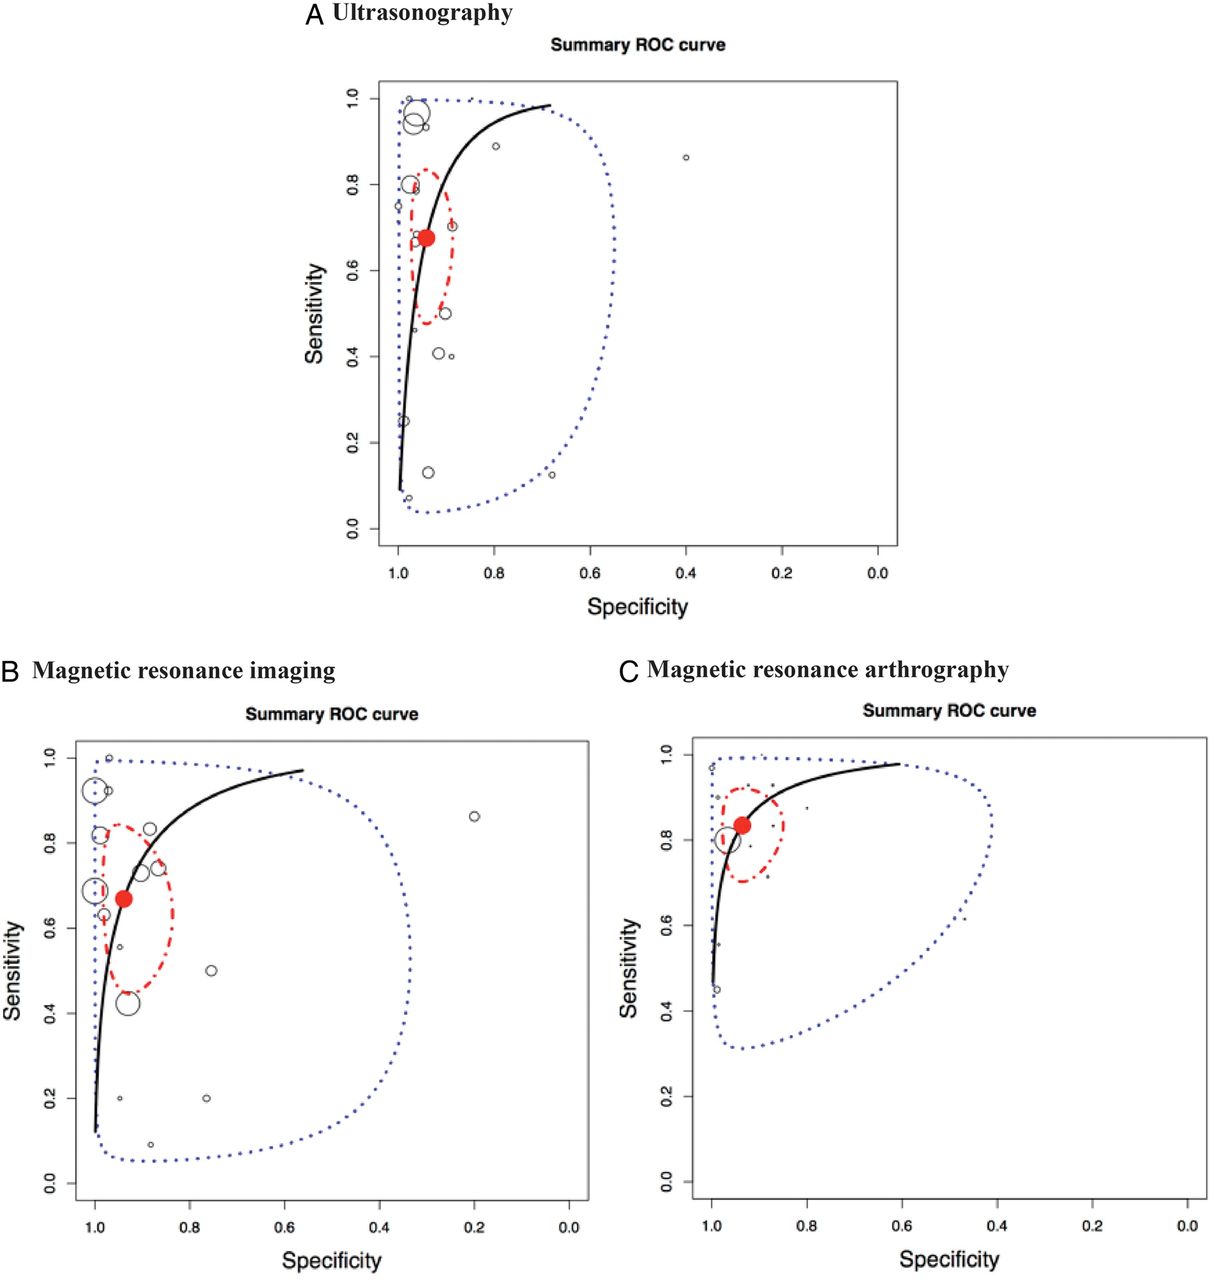
For the diagnostic accuracy of US, MRI and MRA in the characterisation of RC full-thickness tears, meta-analysis showed a similar performance of the three imaging modalities for overall estimates of Sn (0.90 to 0.91) and Sp (0.93 to 0.95; table 2A, figure 4). Figure 5 illustrates the HSROC curves of the US, MRI and MRA in the characterisation of full-thickness RC tears.
Overall Sn and Sp of US, MRI and MRA in the characterisation of full-thickness rotator cuff tears
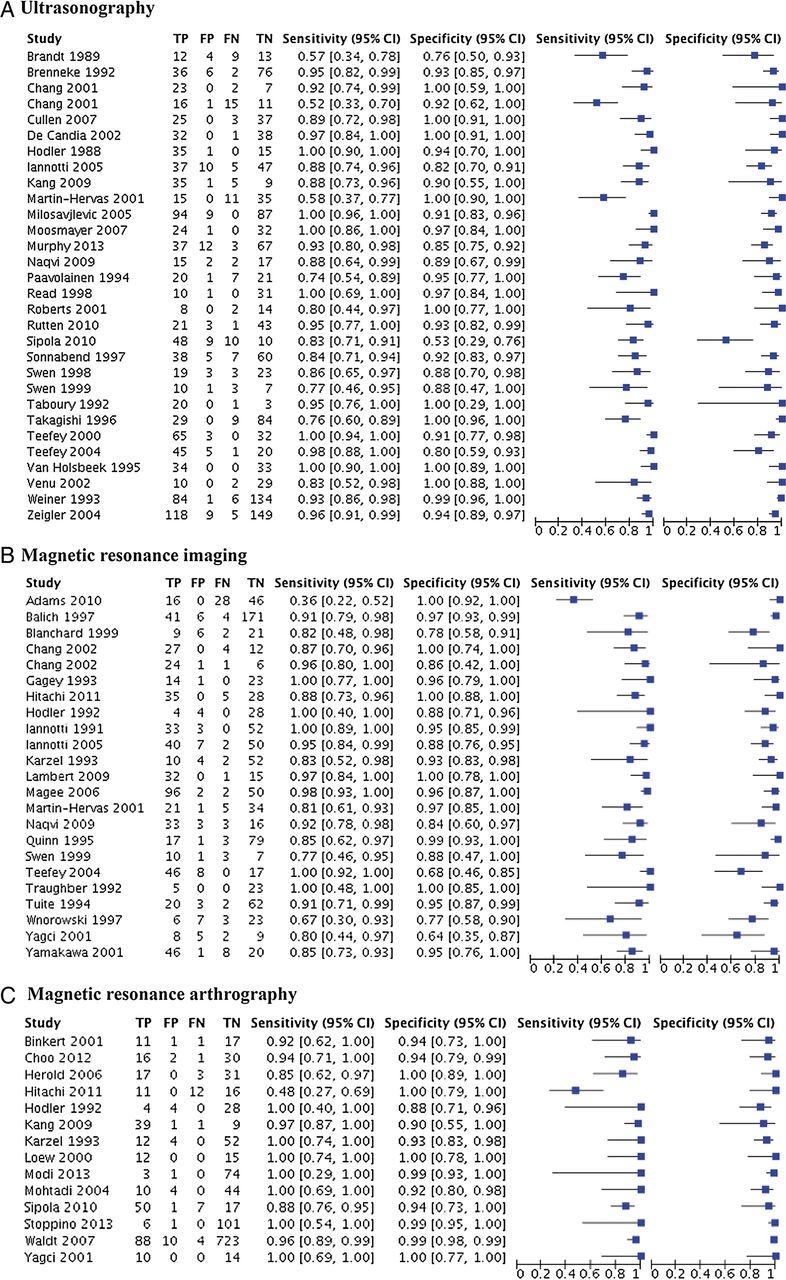
Accuracy of individual studies for US (A), MRI (B) and MRA (C) in characterization of full thickness rotator cuff tears. TP, true positive; FP, false positive; FN, false negative; TN, true negative; 95% CI, 95% confidence interval.

Hierarchical summary ROC curve for full thickness rotator cuff tears. Hierarchical summary receiver operating characteristic (HSROC) curve composed of studies examining the diagnostic value of the ultrasonography, MRI and MR arthrography in characterisation of full-thickness or partial-thickness rotator cuff tears. Circles represent each study, blue dotted line, the CI and red dotted line the credible interval. TP, true positive; FP, false positive; FN, false negative; TN, true negative.
Secondary analysis regarding risk of bias evaluation
Grouping studies according to the risk of bias on patient selection did not reveal any significant difference for US. For MRI (Sn: 0.83 and 0.90, respectively) and MRA (Sn: 0.83 and 0.93, respectively), Sn was slightly lower for the low risk of bias group of studies (table 2B). The credible intervals of the Sn, however, did overlap.
Secondary analysis regarding equipment characteristics
For characterisation of full-thickness RC tears, pooling data regarding US transducer frequency (≤7.5 MHz or >7.5 MHz) did not show any significant difference (table 2C). Similarly, for the electromagnetic flux density of MRI and MRA, the differences of overall Sn and Sp between ≤1.5 T and 3.0 T were not statistically significant (credible intervals overlapped).
Secondary analysis regarding the specialist performing the US examination
The meta-analyses showed a similar diagnostic accuracy of US when the examination was performed by a trained radiologist or by other professionals (trained sonographers or orthopaedists; table 2D).
Diagnostic accuracy of imaging modalities for partial thickness RC tear
Pooled data for all included studies
For the diagnosis of partial RC tears, while the overall Sn of US and MRI were similar (0.68 and 0.67, respectively), that of MRA's was higher (Sn 0.83; table 3A, figure 6). For the overall estimate of Sp, the three imaging modalities performed equivalently (0.93–0.94). Figure 7 illustrates the HSROC curves of the US, MRI and MRA in the characterisation of partial thickness RC tears.
Overall Sn and Sp of US, MRI and MRA in the characterisation of partial thickness rotator cuff tears
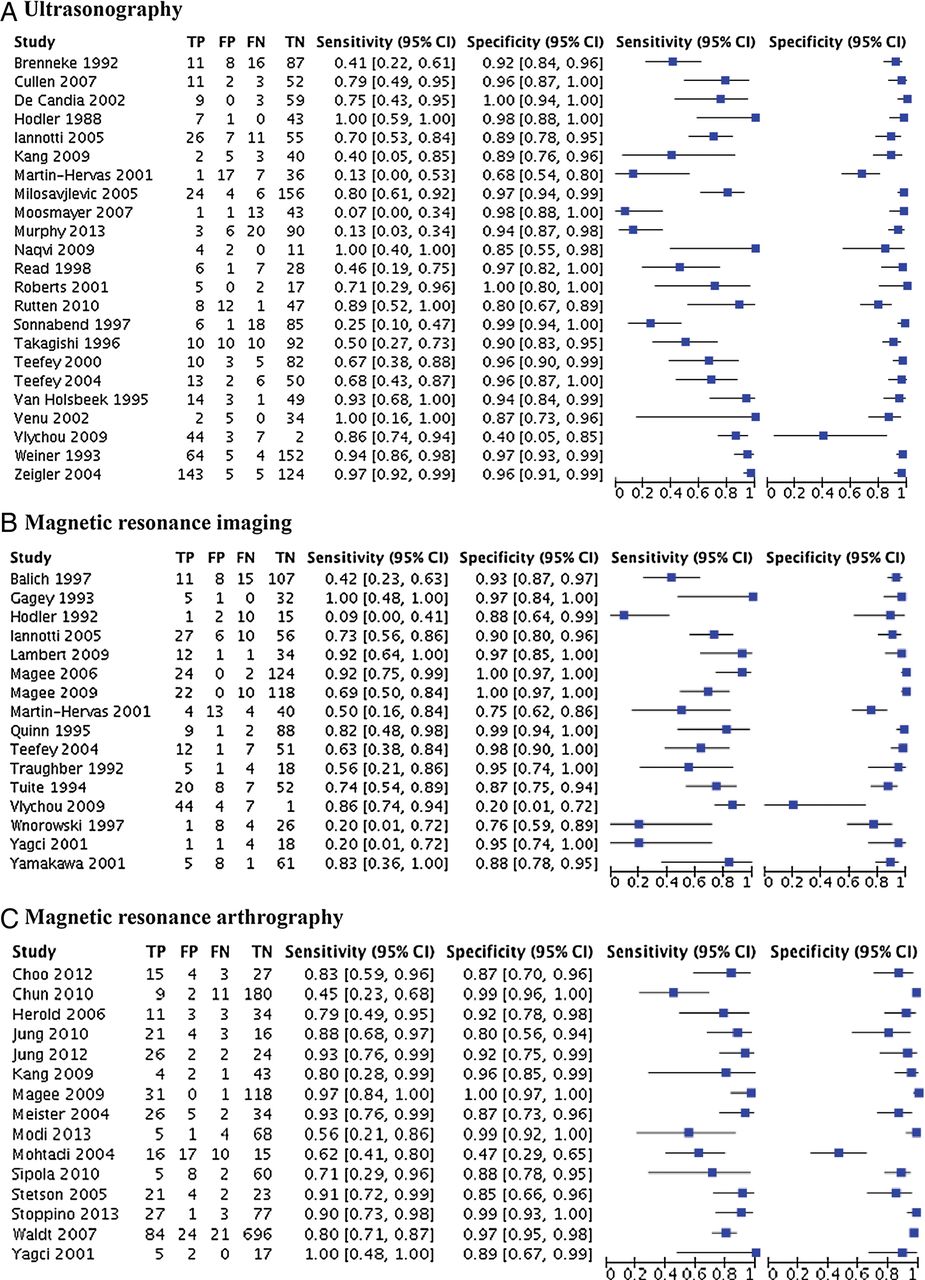
Accuracy of individual studies for ultrasonography, MRI and MR arthrography in characterisation of full thickness rotator cuff tears. TP, true positive; FP, false positive; FN, false negative; TN, true negative.
Hierarchical summary ROC curves for partial thickness rotator cuff tears. Hierarchical summary receiver operating characteristic (HSROC) curve composed of studies examining the diagnostic value of the ultrasonography (A), MRI (B) and MRA (C) in characterisation of full or partial thickness RC tears. Circles represent each study, blue dotted line, the confidence interval and red dotted line the credible interval.
Secondary analysis regarding risk of bias evaluation
The results of the secondary analysis regarding the risk of bias in patient selection revealed an important difference, particularly for US, between the group of studies with a high risk of bias and the group of studies with a low risk of bias for Sn (0.77 and 0.43, respectively for US; table 3B). The intervals of the overall estimates of sensitivity for these groups, although quite large, barely overlapped. The overall estimate of Sp was 0.94 in both groups. With the MRI studies, similar overall estimates of Sn and Sp were found. As for MRA, the overall estimates of Sn were similar in both groups. A difference of 12% between the overall estimates of Sp were, however, observed, the estimate being higher in the group of studies with a low risk of bias (Sp: 0.97) than in the group of studies with a high risk of bias (Sp: 0.85). Again, the credible intervals of the overall estimates specificity for these groups barely overlapped.
Secondary analysis of equipment characteristics
For the diagnostic accuracy of US in characterisation of partial RC tears, there seems to be no advantage to use a frequency higher or lower than 7.5 MHz (table 3C). For MRI, this comparison revealed non-significant differences of 12% in Sn and 8% in Sp between a density of 1.5 T and of 3.0 T in favour of 3.0 T. Based on likelihood ratios though, a 3.0 T density would be more efficient for the confirmation of a partial thickness RC tear, compared to a density of 1.5 T. The same can be concluded for MRA, where overall estimates of Sn and Sp were similar, but likelihood ratios revealed a slight advantage in favour of a flux density of 3.0 T.
Secondary analysis regarding the specialist performing the US examination
Here again, the meta-analyses showed a similar performance by a trained radiologist or by other professionals (trained sonographers or orthopaedists; table 3D).
Diagnostic accuracy of imaging modalities for RC tendinopathy
It was possible to combine five studies (311 shoulders; arthroscopy or open surgery as reference standard) that provided data for the diagnostic accuracy of US in the characterisation of tendinopathy. Overall estimate of Sn of this group of studies was 0.79 and the overall estimate of Sp was 0.94 (table 4).
Overall Sn and Sp of US for the characterisation of tendinopathy
Discussion
This meta-analysis revealed very good diagnostic accuracy of US, MRI and MRA in the characterisation of full-thickness RC tears, while the overall sensitivity of these tools was lower for the characterisation of partial RC tears and tendinopathy (the later was only evaluated for US). For partial thickness RC tears, the overall sensitivity of MRA was found to be slightly higher than those of MRI and US. An electromagnetic flux density of 3.0 T was also found to confirm a partial thickness RC tear with more confidence than with a density of 1.5 T (albeit, the difference was not significant). However, the studies published on the diagnostic accuracy of flux density of 3.0 T were more recent (range: 2009 to 2013; mean: 2010) compared to the studies evaluating flux density of 1.5 T (range: 1991 to 2013; mean: 2001). Therefore confounding factors such as improved technology also need to be considered when interpreting this result.
Finally, in cases of partial RC tears diagnosed by US, the overall sensitivity was lower in the group of studies with a low risk of bias in participant selection compared to the group of studies with a high risk of bias. This means that studies that have included participants with a large spectrum of shoulder conditions, and not only participants strongly suspected of having RC diseases, would have provided a more valid estimate of the sensitivity of US. It is likely that when a preselection of participants is made as to their probable diagnosis, the sensitivity of US is overestimated due to an increased prevalence of RC pathologies.100
Comparison to other systematic reviews with meta-analysis
Our results are consistent with previous systematic reviews,5–7 ,9–11 but add new data and evidence on the diagnostic accuracy. The most recent systematic review of imaging, published in 2013,5 included only patients for whom surgery for a RC disorder had been considered. These highly specific eligibility criteria allowed inclusion of a limited number of studies, which could explain the differences in estimated diagnostic accuracy between that study and the present one. For example, the overall estimate of sensitivity for MRI in the characterisation of any RC tears was 0.98 and overall estimate of specificity was 0.79.14 In our study, the equivalent estimates were 0.90 for sensitivity and specificity.
In two meta-analyses by Smith et al,10 ,11 similar results as those found in the present study were obtained; however, for partial thickness RC tears for US, differences were noted. They obtained an overall estimate of sensitivity of 0.84 compared to 0.68 in the present study. This could be explained by the fact that some studies that were included in the aforementioned systematic reviews were excluded in the present review for several reasons: unable to reconstruct the 2×2 tables (seven articles), study population ineligible (three articles), not in English (four studies), surgery not the reference standard (two studies) and articles not on diagnostic accuracy (three articles). Further, 26 articles included in the present study were not included in the Smith et al's meta-analysis (mostly more recent studies). For partial thickness RC tears, our conclusions coincide more closely to those of De Jesus et al6 and Dinnes et al.7 In these meta-analyses, despite the differences in the statistical methods used and in the number of included studies, the conclusions remain very close to ours. In accordance with their conclusions, we also found equivalent performance between the three diagnostic tools, with a slight advantage to MRA for partial thickness RC tears. Partial RC tears are the most difficult to detect, but the specificity of all tools was high even for this specific pathology.
The consistency of findings across systematic reviews with different search strategies, inclusion criteria and dates covered confirms the high specificity of US, MRI and MRA. Conversely, the pooled estimate of sensitivity varies among the reviews and our findings represent the most recent, rigorous estimate of overall accuracy and factors that might contribute to variation.
Clinical implications
From our findings, US, MRI and MRA can be considered highly specific tools for the diagnosis of RC disorders, while being highly sensitive mostly for full-thickness RC tears. Beside diagnostic value, several factors must be considered to appreciate the clinical implications of such results. Safety, cost, availability and impact of the results of clinical management are key elements. Regarding safety, beside some specific contraindications for MRI, US and MRI are non-invasive tests. Claustrophobia can be an issue with MRI and MRA. Although MRA showed a slightly better performance, this procedure involves an intra-articular injection that can cause inconveniences to patients (discomfort, risk of infection). When considering cost and availability, these tests can be classified as follows in most settings: US <MRI <MRA.101 ,102 Finally, and likely most important when requesting imaging for RC injuries, one must consider the impact of the test results on clinical management.
In general, partial RC tears are treated using modalities similar to tendinopathy while RC repair surgery is considered in cases of full-thickness RC tears associated with a number of criteria such as duration (acute vs chronic), age, function, pain and size of tear.103 The most clinically important characteristic when selecting a shoulder imaging modality for RC disorder evaluation is therefore the capacity to properly detect a full-thickness RC tear since it constitutes a key indication for surgical repair.104 Hence, the most clinically relevant aspect of this meta-analysis is the data related to the capacity of the tests to document full-thickness RC tears.
Interestingly, one finding of this study is that, when performed by specially trained operators, shoulder US may not be as user dependent as previously thought since, for the diagnosis of a full-thickness RC tear, diagnosis was similar whether trained radiologists, sonographers or orthopaedists performed the US examination. However, it is important to take into consideration that the sonographers and orthopaedists who performed the US examination in the included articles were specially trained, and that there is a steep learning curve to US.14 Therefore, the use of ultrasound at the point of care must be linked to specific training that should be defined in curriculum such as the one recently updated by the American Medical Society for Sports Medicine (AMSSM).105 Finally, diagnostic use of US at the point of care can also lead to improved therapeutic efficiency through the immediate use of interventions such as injections, which have been shown to be more effective under US guidance.106 ,107 ,108
The use of US, providing equivalent information to MRI but less expensive, is therefore recommended for the diagnosis of RC disorders. In the event that US or MRI do not provide the diagnosis, MRA may be indicated. These conclusions are consistent with the imaging algorithms for evaluating suspected RC disease proposed by the Society of Radiologists in Ultrasound.102 Also, clinical situations where other shoulder conditions such as articular cartilage injuries or labral tears must be considered (eg, in cases where glenohumeral instability in younger patients or osteoarthritis in older patients overlap with RC disorders) could justify the use of MRI or MRA. However, in most conditions, first we advocate a combination of different non-invasive and less expensive clinical evaluation tests before the use of medical imaging, as these tests are mostly appropriate for confirming a number of specific RC pathologies.108 However, in situations of acute shoulder injuries where full-thickness RC tears is considered, imaging must be obtained rapidly as rapid repair of a ‘fresh’ tear on a previously healthy RC has the best prognosis.
Strengths and limitations
This meta-analysis was based on a rigorous literature search, which resulted in the inclusion of 82 articles, and a validated appraisal tool was used to determine the risk of bias of included studies. Still, there are some limitations. With the statistical package used in the present study, we were able to calculate confidence and credible intervals for the overall sensitivity and specificity, but not for the likelihood ratios. No method was found to calculate CIs around the likelihood ratios that are derived from overall estimates of sensitivity and specificity. Other limitations include that 47 studies were specifically excluded because of incomplete data reporting (unable to construct a 2×2 table). There were also recurrent sources of bias on three of the four items of the QUADAS 2 tool, which shows poor reporting of participants’ characteristics and study design for the included studies. Finally, while the two raters were fairly concordant when evaluating the risk of bias (κ>0.50), one item was less concordant (item 1: patient selection; κ=0.33). However, agreement was easily obtained between to two raters and the initial disagreements were mostly related to adherence to the defined standard.
Summary
The high and stable specificity across studies of the US, MRI and MRA leads us to recommend their uses for the confirmation of RC pathologies in patients already suspected of having those problems on the basis of clinical evaluation tests in acute cases where surgery might be considered rapidly or in situations where conservative treatments have failed. When considering accuracy, cost, availability, safety and efficiency of management when used at the point of care, US is likely be the best option in most settings for the diagnosis of full-thickness RC tears.
What are the new findings
The meta-analysis confirms the similar and high diagnostic accuracy of ultrasonography (US), MRI and MR arthrography (MRA) in the characterisation of full-thickness rotator cuff (RC) tears in individuals with shoulder pain.
Conversely, the pooled estimate of sensitivity varies among the reviews and our findings represent the most recent, rigorous estimate of overall accuracy and factors that might contribute to variation. Thus, the sensitivity of the US, MRI and MRA is more susceptible to variation for all diagnoses of RC disorders, while the specificity of these diagnostic tools is stable and high.
Diagnostic accuracy of US is similar whether a trained radiologist, sonographer or orthopaedist performed the US examination.
References
Supplementary materials
Supplementary Data
This web only file has been produced by the BMJ Publishing Group from an electronic file supplied by the author(s) and has not been edited for content.
Files in this Data Supplement:
- Data supplement 1 - Online supplement
Footnotes
Contributors J-SR, FD, CED, JCM, NB and PF participated in the design of the study. J-SR, CB, JL, FD, CED, JCM, NB and PF participated in the analysis and the interpretation of data and drafted the manuscript. J-SR and CB carried out the acquisition of data and the evaluation of the risk of bias. JL is the statistician.
Funding Financial support has been provided by the Institut de Recherche Robert-Sauvé en Santé et Sécurité au Travail (IRSST) and the Réseau Provincial de Recherche en Adaptation-Réadaptation/Fonds de recherche du Québec – Santé (REPAR/FRQ-S). JS Roy was supported by a salary award from the FRQ-S. JC MacDermid was supported by a Chair in Gender, Work and Health by the Canadian Institutes of Health Research.
Competing interests None.
Provenance and peer review Not commissioned; externally peer reviewed.